3550 China Gdn #38 · Diamond Springs, CA
Flood risk 1/10 · Minimal
- FEMA flood zone
- X (unshaded)
- Chance of flooding over 30 yrs
- 0.0%
- Est. flood insurance / yr
- $507 – $1,088
Fire risk 9/10 · Severe
- Est. fire insurance / yr
- $659 – $1,223
Heat risk 6/10 · Moderate
- Hot days now (above 100°F)
- 7 days/yr
- Hot days in 30 yrs
- 16 days/yr
Wind risk 1/10 · Minimal
- Chance of severe wind over 30 yrs
- —
Air-quality risk 10/10 · Severe
- Unhealthy air days now
- 31 days/yr
- Unhealthy air days in 30 yrs
- 38 days/yr
Risk factors via First Street. Map © Google.
Why this score? — see what drove the B grade
The composite is a weighted blend of 9 inputs, each scored 0–100. Each bar is that input's sub-score; the figure is the points it added to the 100-point composite (weight × sub-score).
- Cash flow +30.0/30.0
- 1% rule +10.0/10.0
- DSCR +10.0/10.0
- ARV discount +7.5/15.0
- Rent growth +5.0/5.0
- Schools +3.7/10.0
- Condition / age +2.5/5.0
- Livability +2.4/5.0
- Appreciation +0.0/10.0
$69,500
🖨 Deal sheet (PDF) 📄 Offer letter ✓ Due diligence
Listing remarks
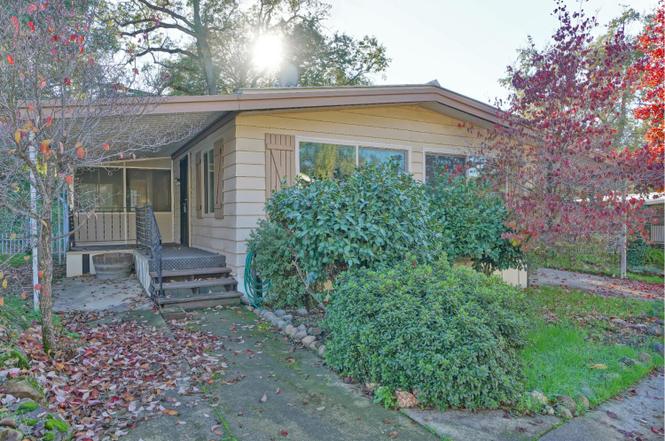
Welcome to this 55+ community. Here's your opportunity to put your touch on this home. Open floorplan with large living room leading into kitchen, dining and den. Sliding doors lead to a screened in room, perfect for hobbies! Master suite offers large closet and bath has dbl sinks and a tub with shower above. Inside laundry room has gas and electric hookups for dryer and washer is included.
Key facts
- Master suite
- Large closet
- Open floorplan
Tags
Property features AI
Finance
- Other: Located at 3550 China Gdn #38, Placerville, CA 95667; Directions: Hwy 50 to South on Missouri Flat. Left on China Garden. Right into park to 2nd left to #38 on right just past the guest parking area.
- HOA & community: No homeowners association; Senior community
Exterior
- Parking: Attached covered parking; Guest parking available
- Utilities: Cable available; Internet available; Individual electric meter; Individual gas meter; 220V in laundry; Public sewer; Public water
- Home design: Manufactured in park, double wide; Original condition; Built in 1972
- Construction: Metal roof; Metal skirting; Viking make (manufactured home)
- Exterior features: Fenced yard; Storage area; Shed(s)
Interior
- Kitchen: Free-standing refrigerator; Built-in gas oven and double oven; Gas cooktop; Dishwasher; Plumbed for ice maker / ice maker
- Bedrooms: 2 bedrooms (including a master bedroom)
- Flooring: Carpet; Tile; Linoleum
- Bathrooms: 2 full bathrooms; Double sinks and shower stall(s)
- Heating & cooling: Central heating; Central cooling
- Interior features: Dual-pane partial windows; Carpeted porch; Screened room; Pantry cabinet, kitchen island, and laminate counters; Kitchen/family combo with dining bar; Unfurnished; Storage area inside (storage/shed)
- Laundry & utility: Washer included; Electric and gas hook-ups; Laundry located inside
Neighborhood map
What this means for you Summary
Snapshot
- This is a 2-bed/2.0-bath manufactured listed at $70k.
Deal economics
- At list price, monthly cash flow is $1k ($15k/yr) — positive.
- The deal already cash-flows at list — no discount required.
- Meets the 1% rule at list price ($2k rent vs $70k).
- Recommended offer: $61k (12.0% below list) — sets the bar for market timing.
- Cap rate 27.9% vs local median 2.3% in Diamond Springs — top-decile yield for the area; either an underpriced asset or a hidden risk that comps aren't pricing in. Stress-test before assuming the spread holds.
Location & tenants
- Location reads 47/100 on livability (#1,239 in CA) — a working-class tenant base; expect higher turnover. Strengths: housing B+; Watch: schools D, crime D-, amenities F.
- Mother Lode Union Elementary (rural): math 36% / reading 41% proficiency, ranked #726 of 1,400 in CA (top 52%) — families likely to look elsewhere, expect single-tenant / working-renter base with shorter leases.
- Market conditions: Rents rising fast (+12.5%/yr); 351 active listings in the ZIP; 3 comparable units currently listed for rent nearby; rentals leasing fast (median 3d on market — plan ~1-2 weeks tenant-placement turnaround); solid renter incomes; 437 units permitted in El Dorado County in 2024 (0 in 5+ unit buildings).
Forward outlook
- Local home prices are declining (-3.0%/yr); year-one equity from $481 of loan paydown is wiped out by about $2k of value loss. Plan a longer hold.
- El Dorado County population projected to shrink 3% by 2050 — rents likely to lag national; underwrite the cash flow, not the appreciation.
- At projected returns (-3.0% appreciation + 8.0% rent growth), your $19k cash investment doubles in ~2 years — after that, you're playing with house money.
Negotiation context
- It's been on market 244 days — a 12% lower offer ($61k) is reasonable based on typical stale-listing flexibility.
Risks & watch-outs
- Climate carrying-cost: severe wildfire risk; extreme-heat days projected 7→16/yr by 2055 (HVAC capex compounding) — expect insurance premiums to compound above CPI over the hold.
Questions for the listing agent
- It's been on market 244 days. Have you received any prior offers? Is the seller open to a 12% concession, seller financing, or rate buy-down credit?
- Built in 1972 — when were the roof, HVAC, electrical panel, plumbing, and water heater last replaced?
- Why hasn't it sold? Are there any deal-killer items the seller is aware of (foundation, flood, title, zoning, code violations)?
- Is there a deadline driving the sale (1031 exchange, divorce, estate, relocation)? That informs how much negotiation room exists.
- Schools are D-rated, which usually means shorter tenancies and higher turnover. Who's the typical renter profile here, and what's been the actual vacancy rate?
- Crime grade is D in this area — have there been break-ins, vandalism, or insurance claims at this property in the last 3 years? What carrier currently insures it and at what premium?
- What's the average days-on-market for RENTAL listings here right now (not sales)? A rising rental-DOM trend means longer vacancies and softer asking-rent achievability than the comps imply.
- What's the recent tenant-quality profile in this submarket — average credit score on applications, eviction rate, late-payment / NSF rate, and stable-employment percentage? A property-management company in the area should have these aggregated.
- How much new for-sale + rental construction is in the pipeline within 1–3 miles? Heavy new supply typically softens prices + rents 12–24 months out; constrained supply supports both.
Investment metrics
- 1% rule
- 3.03% ✓
- Cap rate
- 27.88%
- Cash-on-cash
- 77.09%
- DSCR
- 4.43
- GRM
- 2.8
CMA / ARV
- ARV (on-the-fly)
- $147,312
- Comps found
- 11
Show comp detail 11 sales within ~0.75 mi
| Address | Dist | Beds/Ba | Sqft | Sold | Price | $/sf | Match |
|---|---|---|---|---|---|---|---|
| 3550 China Garden Rd #44 | 0.07mi | 3/2.0 (+1) | 1,440 (-3%) | 7mo | $100,000 | $69 | 80 |
| 3550 China Gdn #136 | 0.13mi | 2/2.0 | 1,560 (+5%) | 7mo | $82,500 | $53 | 80 |
| 3550 China Garden Rd #63 | 0.08mi | 2/2.0 | 1,440 (-3%) | 20mo | $142,000 | $99 | 74 |
| 3550 China Garden Rd #54 | 0.05mi | 2/2.0 | 1,440 (-3%) | 22mo | $131,000 | $91 | 74 |
| 3550 China Garden Rd #150 | 0.14mi | 3/2.0 (+1) | 1,566 (+5%) | 7mo | $200,000 | $128 | 74 |
| 3550 China Garden Rd #145 | 0.15mi | 2/2.0 | 1,392 (-6%) | 11mo | $150,000 | $108 | 72 |
| 3550 China Garden Rd #119 | 0.13mi | 2/2.0 | 1,510 (+2%) | 23mo | $157,500 | $104 | 72 |
| 3550 China Gdn #4 | 0.14mi | 2/2.0 | 1,440 (-3%) | 23mo | $139,500 | $97 | 69 |
| 3550 China Garden Rd #70 | 0.07mi | 2/2.0 | 1,296 (-13%) | 10mo | $95,000 | $73 | 67 |
| 3550 China Garden Rd #131 | 0.11mi | 2/2.0 | 1,305 (-12%) | 19mo | $166,000 | $127 | 59 |
| 350 Pleasant Vly #74 | 0.30mi | 3/2.0 (+1) | 1,280 (-14%) | 20mo | $195,000 | $152 | 40 |
Match score weights: distance 35% · size 25% · config 20% · recency 20%. Top-matched comps best support the ARV.
Projected returns pro-forma
-3.0% appreciation · 8.0% rent growth · sell at horizon
- IRR
- 82.5%
- Equity multiple
- 5.08×
- Total profit
- $79,476
- Equity at exit
- $10,363
- IRR
- 87.0%
- Equity multiple
- 12.42×
- Total profit
- $222,315
- Equity at exit
- $6,009
Cash invested: $19,460 (down + closing). Projections, not guarantees.
Landlord ↔ Tenant lean methodology
- Overall (STATE)
- 18 Strongly Tenant-Friendly
- State California
- 18 Strongly Tenant-Friendly · D+13
- County
- — inherits STATE
- City
- — inherits STATE
ZIP-level market 95667
- Rents YoY
- 12.5%
- Active inventory
- 351
- Price-to-rent
- 2.8×
Monthly cashflow live
- Estimated rent
- $2,104 medium interval (Pro) →
- Mortgage (P&I)
- −$364
- Tax from tax record
- −$19 /mo · $227/yr
- Insurance
- −$29
- HOA
- −$0
- Vacancy / Maint / Mgmt
- −$442
- Net cashflow
- $1,250
Break-even live
Sensitivity live
| Price | -10% $1,290 | -5% $1,270 | +0% $1,250 | +5% $1,231 | +10% $1,211 |
|---|---|---|---|---|---|
| Rent | -10% $1,084 | -5% $1,167 | +0% $1,250 | +5% $1,333 | +10% $1,416 |
| Rate | -1.0pp $1,285 | -0.5pp $1,268 | base $1,250 | +0.5pp $1,232 | +1.0pp $1,214 |
UW: 25.0% down · 7.5% · 30yr · 1.5% tax · 5.0% vac · 8.0% maint · 8.0% mgmt
Financing live
Cash to close
- Down payment
- $17,375
- Closing costs
- $2,085
- Reserves months
- —
- Total cash needed
- —
Loan-product check · same deal, 3 products live
Conventional
25% down · 7.5% · 30yr
- Down + closing
- —
- Monthly P&I
- —
- Monthly cashflow
- —
- DSCR
- —
- Eligible?
- —
Personal DTI + credit; lowest rate.
DSCR
20% down · 8.5% · 30yr
- Down + closing
- —
- Monthly P&I
- —
- Monthly cashflow
- —
- DSCR
- —
- Eligible?
- —
No personal income docs; deal must DSCR.
Hard money
10% down · 12.0% · 12mo
- Down + closing
- —
- Monthly P&I
- —
- Monthly cashflow
- —
- DSCR
- —
- Eligible?
- —
Short-term bridge; refi at stabilization.
Rent comps 3 comps
| Address | Beds | Baths | Sqft | Rent | $/sqft | DOM | Units | Dist |
|---|---|---|---|---|---|---|---|---|
| 579 Racquet Way Diamond Springs, CA | 2.0 | 2.0 | 968 | $1,900 | $1.96 | 2d | 1 | 0.64mi |
| 4012 Wimbledon Dr Diamond Springs, CA | 3.0 | 2.5 | 1233 | $2,250 | $1.82 | 2d | 1 | 0.71mi |
| 3884 Rosey Way Placerville, CA | 3.0 | 2.0 | 1100 | $2,595 | $2.36 | 20d | 1 | 0.89mi |
Listing history 15 events
-
2026-06-18days on market $69,500 Active 244 DOM
-
2026-06-17days on market $69,500 Active 243 DOM
-
2026-06-16days on market $69,500 Active 242 DOM
-
2026-06-15days on market $69,500 Active 241 DOM
-
2026-06-13days on market $69,500 Active 239 DOM
-
2026-06-13days on market $69,500 Active 238 DOM
-
2026-06-10remarks 393-char remark
-
2026-06-10price $69,500 Active 235 DOM
-
2026-06-09days on market $75,000 Active 235 DOM
-
2026-06-08days on market $75,000 Active 234 DOM
-
2026-06-07days on market $75,000 Active 233 DOM
-
2026-06-03days on market $75,000 Active 229 DOM
-
2026-06-02days on market $75,000 Active 228 DOM
-
2026-06-01days on market $75,000 Active 227 DOM
-
2026-05-31days on market $75,000 Active 226 DOM
ⓘ Source: listings_history table (triggers on properties + properties_extension) + one-shot
backfill from property_details.listing_events for pre-trigger history.
Tax reassessment forecast CA · Resets to sale price
- Current annual tax
- $227 · $19/mo
- Projected year-2 tax
- $528 · $44/mo
- Expected delta
- +$301/yr (+$25/mo · 132.9%)
ⓘ Screening estimate from a state-policy table — verify with the county assessor before closing.
Climate risk First Street
- Flood 1/10 Low FEMA zone X (unshaded) · 0% chance over 30 yrs
- Wildfire 9/10 Extreme
- Heat 6/10 Major 7 d/yr ≥100°F today · 16 d/yr by 30 yrs out
- Wind 1/10 Low
- Air quality 10/10 Extreme 31 unhealthy d/yr today · 38 by 30 yrs out
Nearby sold comps map
Loading sold comps map…
Walkable amenities ~0.75 mi
Loading nearby amenities…
Taxation est. · year 1
- Rental income
- $25,254
- − Mortgage interest
- −$3,893
- − Property taxes
- −$227
- − Insurance
- −$348
- − Repairs & maintenance
- −$2,020
- − Management
- −$2,020
- − Depreciation
- −$2,022
- Taxable income
- $14,724
- Est. tax owed @ 24.0%
- −$3,534
- After-tax cash flow
- $11,469/yr
For passive investors: Depreciation is non-cash, so a rental often shows a tax loss while cash-flowing — sheltering income. Rental losses are passive: they offset passive income freely, and up to $25,000/yr can offset ordinary (W-2) income if you actively participate and your MAGI is under $100k (phasing out to $0 by $150k); unused losses carry forward. On sale, claimed depreciation is recaptured at up to 25%, and gains may owe capital-gains tax (a 1031 exchange can defer both). Figures are a year-1 estimate at your 24.0% rate — not tax advice; consult a CPA.
Schools (NCES district)
- District
- Mother Lode Union Elementary
- NCES district ID
- 0625980
- Math proficiency
- 36% ▬ 0.00%
- Reading proficiency
- 41% ▼ -4.00%
- Median HH income
- $59,429
- Composite
- 36.63/100
- National rank
- #9251
- State rank
- #726 of 1400 in CA
Livability — Diamond Springs
- Score
- 47/100
- State rank
- #1239
- US rank
- #26264
Category grades
Schools grade is shown separately in the Schools card above.
Census & demographics
- Census place
- Diamond Springs, CA
- County
- El Dorado County · 144,198 people
- City population
- 6,362
- Metro
- Sacramento-Roseville-Folsom, CA
- Population (ZIP)
- 36,830
- Household income
- $89,938
- Rent vs Own
- Severe rent burden
- 1147.0
Population outlook (El Dorado County) Hauer SSP2
- Today (2025)
- 191,666 people
- By 2030
- 193,662 · +1.0%
- By 2040
- 192,583 · +0.5%
- By 2050
- 185,904 · -3.0%
- By 2075
- 169,543 · -11.5%
- By 2100
- 139,623 · -27.2%
Race, ethnicity, and origin ACS 2023
- Neighborhood character
- Predominantly White (78%)
- Race & ethnicity
- White 78% Hispanic / Latino 14% Two or more races 8% Native American 1%
- Hispanic origin (detail)
- Mexican 11%
- Common ancestry
- Italian 4% Slovak 4% Lithuanian 3%
- Foreign-born
- 6% · Canada, China
- Languages at home
- 92% English-only · Spanish 6%
Political lean MEDSL · El Dorado
- 2024 margin
- R (+12.0) · D 42.6% · R 54.6% · Other 2.8%
- 2008→2024 swing
- -1.5pp toward R · 2008: -10.5pp · 2024: -12.0pp
- All cycles
- 2024: R+12.0 2020: R+8.8 2016: R+13.9 2012: R+18.2 2008: R+10.5
Not yet ingested
- Civics
- —
Market trends
- HPI YoY
- ▼ -480.50%
- Current HPI
- 262.6014
- Rent YoY
- ▲ 12.48%
- Metro
- Sacramento-Roseville-Folsom, CA
- State GDP YoY
- ▲ 3.21%
- F500 in state
- 116
Industry mix (Fortune 500 HQ in CA)
| Industry | F500 HQs | Revenue |
|---|---|---|
| Technology | 27 | $1,492B |
|
||
| Financial Services | 3 | $174B |
|
||
| Retail | 3 | $44B |
|
||
| Insurance | 3 | $26B |
|
||
| Media / Entertainment | 2 | $115B |
|
||
| Pharmaceuticals / Biotech | 2 | $62B |
|
||
Property tax history
-0.0%/yrLatest (2023): $227 · -0.5% YoY. Source: county tax records.
Cash-flow waterfall
monthlySold comps — $/sqft
last 12 mo · ≤1 miLoading sold comps…