542 Barrett · San Antonio, TX
Flood risk 1/10 · Minimal
- FEMA flood zone
- X (unshaded)
- Chance of flooding over 30 yrs
- 0.0%
- Est. flood insurance / yr
- $507 – $1,088
Fire risk 1/10 · Minimal
- Est. fire insurance / yr
- $1,222 – $2,270
Heat risk 8/10 · Major
- Hot days now (above 108°F)
- 7 days/yr
- Hot days in 30 yrs
- 22 days/yr
Wind risk 7/10 · Major
- Chance of severe wind over 30 yrs
- 78.0%
Air-quality risk 2/10 · Minimal
- Unhealthy air days now
- 1 days/yr
- Unhealthy air days in 30 yrs
- 2 days/yr
Risk factors via First Street. Map © Google.
Why this score? — see what drove the B grade
The composite is a weighted blend of 9 inputs, each scored 0–100. Each bar is that input's sub-score; the figure is the points it added to the 100-point composite (weight × sub-score).
- Cash flow +30.0/30.0
- 1% rule +10.0/10.0
- DSCR +10.0/10.0
- ARV discount +7.5/15.0
- Appreciation +6.9/10.0
- Livability +4.0/5.0
- Rent growth +2.5/5.0
- Condition / age +2.5/5.0
- Schools +1.4/10.0
$70,000
🖨 Deal sheet 📄 Offer letter ✓ Due diligence
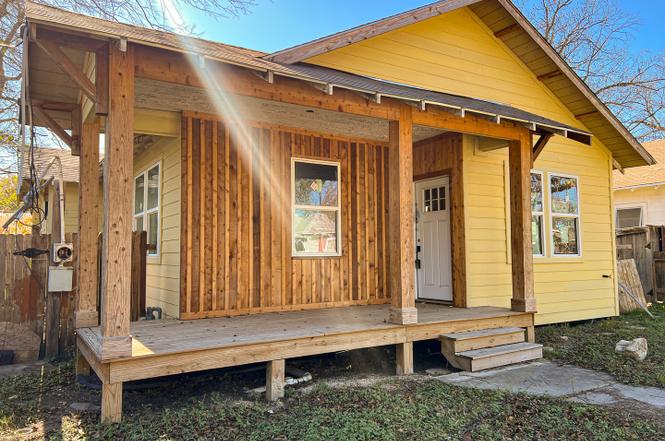
Listing remarks
A true blank-slate opportunity in Palm Heights, this 4-bedroom, 2-bath property offers the chance to step in and finish a renovation already in progress. With R-4 zoning and key improvements started, this home is well-suited for an investor or builder ready to bring their vision to life and reimagine the space from the ground up. Work previously completed is believed to include foundation repair, a newer roof, HVAC system, new windows, exterior siding and trim, front porch construction, and partial electrical and plumbing updates. From here, the project needs a thoughtful finish and a fresh perspective to unlock its full potential. Set in a growing pocket of San Antonio with flexible zoning
Key facts
- R-4 zoning
- Newer roof
- Exterior siding
Tags
Neighborhood map
What this means for you Summary
Snapshot
- This is a 3-bed/1.0-bath single-family listed at $70k.
Deal economics
- At list price, monthly cash flow is $690 ($8k/yr) — positive.
- The deal already cash-flows at list — no discount required.
- Meets the 1% rule at list price ($1k rent vs $70k).
- Cap rate 18.1% vs local median 3.8% in San Antonio — top-decile yield for the area; either an underpriced asset or a hidden risk that comps aren't pricing in. Stress-test before assuming the spread holds.
Location & tenants
- Location reads 80/100 on livability (#31 in TX, #1,616 nationally) — a professional / high-income tenant draw. Strengths: amenities A+, commute A+, cost of living A+; Watch: crime F.
- San Antonio ISD (urban): math 12% / reading 22% proficiency, ranked #805 of 826 in TX (top 98%) — low school quality limits family demand, transient renter base, plan for 1-2y turnover; 80% free/reduced lunch — lower-income household profile, screen leases tightly.
- Zoned schools: Collins Garden El (math 8% / reading 12%, grade F, #4,259 of 4,322 statewide, top 99%, 426 students, 95% FRL); Burbank H S (math 9% / reading 20%, grade F, #1,522 of 1,632 statewide, top 94%, 1,319 students, 90% FRL, charter).
- Market conditions: 36 active listings in the ZIP; 33 comparable units currently listed for rent nearby; rentals at typical pace (median 24d on market — plan ~3-4 weeks tenant-placement turnaround); 8,308 units permitted in Bexar County in 2024 (2,506 in 5+ unit buildings).
- This rent runs 38% of the median local income ($47k/yr) — at the standard rent-burdened threshold; future hikes will face affordability resistance.
Forward outlook
- In year one you build about $3k of equity ($484 loan paydown + $3k appreciation (3.8% local appreciation)).
- Bexar County population projected at +50% by 2050 — long-run rental-demand tailwind backs the buy-and-hold thesis.
- At projected returns (3.8% appreciation + 3.0% rent growth), your $20k cash investment doubles in ~2 years — after that, you're playing with house money.
- By year 10, paydown + projected appreciation supports a ~$31k cash-out refi (75% LTV) — recoverable capital for the next deal without selling this one.
Negotiation context
- Only 13 days on market — expect competitive offers; lowballing is unlikely to land.
- 2 sale attempts since 3y ago with the ask held roughly flat each time — persistent listings suggest the price (not the market) is what's stuck; bring a comps-based counter.
Risks & watch-outs
- Watch-outs: built in 1928 — expect roof / HVAC / electrical / plumbing capex.
- Climate carrying-cost: major wind risk, 78% chance of damaging wind over 30y; extreme-heat days projected 7→22/yr by 2055 (HVAC capex compounding) — expect insurance premiums to compound above CPI over the hold.
Questions for the listing agent
- Built in 1928 — when were the roof, HVAC, electrical panel, plumbing, and water heater last replaced?
- Is there a deadline driving the sale (1031 exchange, divorce, estate, relocation)? That informs how much negotiation room exists.
- Crime grade is F in this area — have there been break-ins, vandalism, or insurance claims at this property in the last 3 years? What carrier currently insures it and at what premium?
- What's the average days-on-market for RENTAL listings here right now (not sales)? A rising rental-DOM trend means longer vacancies and softer asking-rent achievability than the comps imply.
- What's the recent tenant-quality profile in this submarket — average credit score on applications, eviction rate, late-payment / NSF rate, and stable-employment percentage? A property-management company in the area should have these aggregated.
- How much new for-sale + rental construction is in the pipeline within 1–3 miles? Heavy new supply typically softens prices + rents 12–24 months out; constrained supply supports both.
Investment metrics
- 1% rule
- 2.12% ✓
- Cap rate
- 18.11%
- Cash-on-cash
- 42.22%
- DSCR
- 2.88
- GRM
- 3.9
CMA / ARV
- ARV (on-the-fly)
- $204,152
- Comps found
- 12
Show comp detail 12 sales within ~0.75 mi
| Address | Dist | Beds/Ba | Sqft | Sold | Price | $/sf | Match |
|---|---|---|---|---|---|---|---|
| 307 Jennings | 0.30mi | 3/1.0 | 1,236 (-9%) | 4mo | $129,000 | $104 | 68 |
| 138 c | 0.43mi | 3/2.0 | 1,350 (-0%) | 9mo | $228,000 | $169 | 68 |
| 342 Kirk | 0.32mi | 4/2.0 (+1) | 1,392 (+3%) | 8mo | $159,000 | $114 | 64 |
| 1314 W Theo Ave | 0.47mi | 4/2.0 (+1) | 1,404 (+4%) | 3mo | $299,999 | $214 | 60 |
| 253 Carroll | 0.30mi | 3/2.0 | 1,523 (+13%) | 1mo | $165,000 | $108 | 60 |
| 343 Hearne | 0.32mi | 3/1.5 | 1,156 (-14%) | 7mo | $174,000 | $151 | 53 |
| 3123 Neptune St | 0.75mi | 3/2.0 | 1,296 (-4%) | 5mo | $239,000 | $184 | 50 |
| 822 Glenn | 0.70mi | 3/1.0 | 1,220 (-10%) | 5mo | $52,000 | $43 | 47 |
| 119 Carroll | 0.52mi | 3/2.0 | 1,184 (-12%) | 5mo | $228,900 | $193 | 47 |
| 751 Royston Ave | 0.75mi | 3/1.0 | 1,468 (+9%) | 7mo | $111,999 | $76 | 45 |
| 112 Barrett Pl | 0.61mi | 3/1.0 | 1,504 (+11%) | 9mo | $170,000 | $113 | 45 |
| 319 Roslyn | 0.57mi | 3/2.0 | 1,150 (-15%) | 3mo | $199,000 | $173 | 42 |
Match score weights: distance 35% · size 25% · config 20% · recency 20%. Top-matched comps best support the ARV.
Projected returns pro-forma
3.81% appreciation · 3.0% rent growth · sell at horizon
- IRR
- 48.7%
- Equity multiple
- 3.83×
- Total profit
- $55,412
- Equity at exit
- $34,706
- IRR
- 47.7%
- Equity multiple
- 7.74×
- Total profit
- $132,122
- Equity at exit
- $56,147
Cash invested: $19,600 (down + closing). Projections, not guarantees.
Landlord ↔ Tenant lean methodology
- Overall (STATE)
- 87 Strongly Landlord-Friendly
- State Texas
- 87 Strongly Landlord-Friendly · R+5
- County
- — inherits STATE
- City
- — inherits STATE
ZIP-level market 78225
- Home prices YoY
- 1.5%
- Active inventory
- 36
- Price-to-rent
- 3.9×
Monthly cashflow live
- Estimated rent
- $1,485 high interval (Pro) →
- Mortgage (P&I)
- −$367
- Tax est. 1.5%
- −$88 /mo · $1,050/yr
- Insurance
- −$29
- HOA
- −$0
- Vacancy / Maint / Mgmt
- −$312
- Net cashflow
- $690
Break-even live
UW: 25.0% down · 7.5% · 30yr · 1.5% tax · 5.0% vac · 8.0% maint · 8.0% mgmt
Financing live
Cash to close
- Down payment
- $17,500
- Closing costs
- $2,100
- Reserves months
- —
- Total cash needed
- —
Loan-product check · same deal, 3 products live
Conventional
25% down · 7.5% · 30yr
- Down + closing
- —
- Monthly P&I
- —
- Monthly cashflow
- —
- DSCR
- —
- Eligible?
- —
Personal DTI + credit; lowest rate.
DSCR
20% down · 8.5% · 30yr
- Down + closing
- —
- Monthly P&I
- —
- Monthly cashflow
- —
- DSCR
- —
- Eligible?
- —
No personal income docs; deal must DSCR.
Hard money
10% down · 12.0% · 12mo
- Down + closing
- —
- Monthly P&I
- —
- Monthly cashflow
- —
- DSCR
- —
- Eligible?
- —
Short-term bridge; refi at stabilization.
Rent comps 33 comps
| Address | Beds | Baths | Sqft | Rent | $/sqft | DOM | Units | Dist |
|---|---|---|---|---|---|---|---|---|
| 450 Taft Blvd San Antonio, TX | 3.0 | 1.0 | 883 | $1,295 | $1.47 | 44d | 1 | 0.13mi |
| 626 Kirk Pl San Antonio, TX | 2.0 | 1.0 | 912 | $1,100 | $1.21 | 20d | 1 | 0.16mi |
| 323 Thompson Pl San Antonio, TX | 4.0 | 2.0 | 1600 | $1,800 | $1.12 | 44d | 1 | 0.34mi |
| 463 Linares St San Antonio, TX | 3.0 | 1.0 | 1220 | $1,400 | $1.15 | 24d | 1 | 0.43mi |
| 150 Hearne San Antonio, TX | 2.0 | 1.0 | 1044 | $1,400 | $1.34 | 24d | 1 | 0.47mi |
| 542 Drake Ave San Antonio, TX | 3.0 | 2.0 | 1368 | $1,875 | $1.37 | 44d | 1 | 0.48mi |
| 410 N Park Blvd San Antonio, TX | 3.0 | 2.0 | 1326 | $1,650 | $1.24 | 44d | 1 | 0.63mi |
| 3103 Neptune St San Antonio, TX | 3.0 | 2.0 | 1008 | $1,350 | $1.34 | 44d | 1 | 0.71mi |
| 2003 S Zarzamora St San Antonio, TX | 1.0–4.0 | 1.0–2.0 | 1028 | $1,257 | $1.22 | 24d | 1 | 0.73mi |
| 1938 S Zarzamora St Unit 710 San Antonio, TX | 2.0 | 2.0 | 955 | $1,102 | $1.15 | 3d | 1 | 0.75mi |
| 2114 Jupiter St San Antonio, TX | 3.0 | 3.0 | 1233 | $1,457 | $1.18 | 22d | 1 | 0.75mi |
| 1130 Sims Ave San Antonio, TX | 3.0 | 2.0 | 1206 | $1,300 | $1.08 | 24d | 1 | 0.76mi |
| 319 Noria St San Antonio, TX | 3.0 | 1.0 | 1002 | $1,100 | $1.10 | 24d | 1 | 0.77mi |
| 242 Drake Ave Unit 242 San Antonio, TX | 3.0 | 2.0 | 1472 | $1,700 | $1.15 | 44d | 1 | 0.78mi |
| 909 Sims Ave San Antonio, TX | 4.0 | 2.0 | 1400 | $1,750 | $1.25 | 24d | 1 | 0.81mi |
| 333 Frio City Rd Unit 1 San Antonio, TX | 2.0 | 1.0 | 1350 | $1,350 | $1.00 | 11d | 1 | 0.85mi |
| 231 Ceralvo St Unit Na San Antonio, TX | 3.0 | 2.0 | 1160 | $1,695 | $1.46 | 44d | 1 | 0.92mi |
| 616 Sims Ave San Antonio, TX | 3.0 | 1.0 | 1148 | $875 | $0.76 | 44d | 1 | 0.93mi |
| 118 Carthage Ct San Antonio, TX | 3.0 | 2.0 | 1368 | $1,450 | $1.06 | 18d | 1 | 1.12mi |
| 439 W Lubbock St San Antonio, TX | 4.0 | 2.0 | 1288 | $1,635 | $1.27 | 24d | 1 | 1.15mi |
| 439 W Lubbock St San Antonio, TX | 4.0 | 2.0 | 1288 | $1,620 | $1.26 | 3d | 1 | 1.15mi |
| 438 Pruitt Ave #1 San Antonio, TX | 2.0 | 1.0 | 980 | $1,245 | $1.27 | 44d | 1 | 1.17mi |
| 1135 Ceralvo St San Antonio, TX | 3.0 | 2.0 | 1164 | $1,450 | $1.25 | 4d | 1 | 1.18mi |
| 1135 Ceralvo St San Antonio, TX | 3.0 | 2.0 | 1164 | $1,450 | $1.25 | 22d | 1 | 1.18mi |
| 1901 S San Marcos Unit 710 San Antonio, TX | 2.0 | 2.0 | 985 | $1,147 | $1.16 | 3d | 1 | 1.21mi |
| 834 Division Ave Unit 2 San Antonio, TX | 2.0 | 1.0 | 936 | $950 | $1.01 | 4d | 1 | 1.23mi |
| 2406 S Laredo St San Antonio, TX | 3.0 | 1.0 | 944 | $1,200 | $1.27 | 15d | 1 | 1.28mi |
| 222 Glass Ave San Antonio, TX | 2.0 | 2.0 | 1007 | $2,400 | $2.38 | 44d | 1 | 1.30mi |
| 415 Furnish Ave San Antonio, TX | 3.0 | 2.0 | 1670 | $1,995 | $1.19 | 18d | 1 | 1.39mi |
| 575 Division Ave San Antonio, TX | 3.0 | 1.5 | 1362 | $1,950 | $1.43 | 18d | 1 | 1.44mi |
| 131 Elsie Unit 301 San Antonio, TX | 2.0 | 1.0 | 950 | $795 | $0.84 | 4d | 1 | 1.46mi |
| 328 Elks Dr San Antonio, TX | 4.0 | 1.0 | 1600 | $1,500 | $0.94 | 24d | 1 | 1.46mi |
| 503 W Hart Ave San Antonio, TX | 3.0 | 1.0 | 1232 | $1,750 | $1.42 | 11d | 1 | 1.49mi |
Listing history 10 events
-
2026-01-20status Pending
-
2026-01-14historical Active Option
-
2026-01-07$70,000 New
-
2023-12-31historical
-
2023-11-18price $179,999
-
2023-10-17price $189,999
-
2023-08-30price $209,900
-
2023-08-04$215,000 New
-
2022-10-21soldstatus
-
2022-10-21soldstatus
ⓘ Source: listings_history table (triggers on properties + properties_extension) + one-shot
backfill from property_details.listing_events for pre-trigger history.
Climate risk First Street
- Flood 1/10 Low FEMA zone X (unshaded) · 0% chance over 30 yrs
- Wildfire 1/10 Low
- Heat 8/10 Severe 7 d/yr ≥108°F today · 22 d/yr by 30 yrs out
- Wind 7/10 Severe 78% chance of damaging wind over 30 yrs
- Air quality 2/10 Low 1 unhealthy d/yr today · 2 by 30 yrs out
Nearby sold comps map
Loading sold comps map…
Walkable amenities ~0.75 mi
Loading nearby amenities…
Taxation est. · year 1
- Rental income
- $17,823
- − Mortgage interest
- −$3,921
- − Property taxes
- −$1,050
- − Insurance
- −$350
- − Repairs & maintenance
- −$1,426
- − Management
- −$1,426
- − Depreciation
- −$2,036
- Taxable income
- $7,614
- Est. tax owed @ 24.0%
- −$1,827
- After-tax cash flow
- $6,448/yr
For passive investors: Depreciation is non-cash, so a rental often shows a tax loss while cash-flowing — sheltering income. Rental losses are passive: they offset passive income freely, and up to $25,000/yr can offset ordinary (W-2) income if you actively participate and your MAGI is under $100k (phasing out to $0 by $150k); unused losses carry forward. On sale, claimed depreciation is recaptured at up to 25%, and gains may owe capital-gains tax (a 1031 exchange can defer both). Figures are a year-1 estimate at your 24.0% rate — not tax advice; consult a CPA.
Schools (NCES district)
- District
- San Antonio ISD
- NCES district ID
- 4838730
- Math proficiency
- 12% ▼ -21.00%
- Reading proficiency
- 22% ▼ -7.00%
- Median HH income
- $30,952
- Composite
- 13.57/100
- National rank
- #9512
- State rank
- #805 of 826 in TX
Livability — San Antonio
- Score
- 80/100
- State rank
- #31
- US rank
- #1616
Category grades
Schools grade is shown separately in the Schools card above.
Census & demographics
- Census place
- San Antonio, TX
- County
- Bexar County · 1,990,555 people
- City population
- 1,806,925
- Metro
- San Antonio-New Braunfels, TX
- Population (ZIP)
- 13,104
- Household income
- $46,955
- Rent vs Own
- Severe rent burden
- 381.0
Population outlook (Bexar County) Hauer SSP2
- Today (2025)
- 2,336,851 people
- By 2030
- 2,560,728 · +9.6%
- By 2040
- 3,020,569 · +29.3%
- By 2050
- 3,493,522 · +49.5%
- By 2075
- 4,668,459 · +99.8%
- By 2100
- 5,533,242 · +136.8%
Race, ethnicity, and origin ACS 2023
- Neighborhood character
- Predominantly Hispanic (91%)
- Race & ethnicity
- Hispanic / Latino 91% Two or more races 41% White 5% Black 4% Native American 3%
- Hispanic origin (detail)
- Mexican 85%
- Foreign-born
- 13% · Canada
- Languages at home
- 35% English-only · Spanish 65%
Political lean MEDSL · Bexar
- 2024 margin
- Lean D (+9.8) · D 54.3% · R 44.6% · Other 1.1%
- 2008→2024 swing
- +4.2pp toward D · 2008: 5.6pp · 2024: 9.8pp
- All cycles
- 2024: D+9.8 2020: D+18.2 2016: D+13.5 2012: D+4.6 2008: D+5.6
Not yet ingested
- Civics
- —
Market trends
- HPI YoY
- ▲ 3.81%
- Current HPI
- 264.2018
- Rent YoY
- —
- Metro
- San Antonio-New Braunfels, TX
- State GDP YoY
- ▲ 3.95%
- F500 in state
- 110
Industry mix (Fortune 500 HQ in TX)
| Industry | F500 HQs | Revenue |
|---|---|---|
| Energy | 16 | $1,198B |
|
||
| Technology | 5 | $198B |
|
||
| Engineering / Construction | 4 | $72B |
|
||
| Energy Services | 3 | $60B |
|
||
| Utilities | 3 | $41B |
|
||
| Healthcare | 2 | $330B |
|
||
Price history
-67.4% since first listed10 events — show timeline
- 2026-01-20 Pending — LERA
- 2026-01-14 Contingent — LERA
- 2026-01-07 Listed $70,000 LERA
- 2023-12-31 Listing Removed — LERA
- 2023-11-18 Price Changed $179,999 LERA
- 2023-10-17 Price Changed $189,999 LERA
- 2023-08-30 Price Changed $209,900 LERA
- 2023-08-04 Listed $215,000 LERA
- 2022-10-21 Sold (Public Records) — Public Records
- 2022-10-21 Sold (Public Records) — Public Records
Property tax history
+7.0%/yrLatest (2025): $4,354 · +0.4% YoY. Source: county tax records.
Cash-flow waterfall
monthlySold comps — $/sqft
last 12 mo · ≤1 miLoading sold comps…