 Duplex
8639 Peachtree St St · Houston, TX
Flood risk No data
- FEMA flood zone
- —
- Chance of flooding over 30 yrs
- —
- Est. flood insurance / yr
- —
Fire risk No data
- Est. fire insurance / yr
- —
Heat risk No data
- Hot days now (above threshold)
- —
- Hot days in 30 yrs
- —
Wind risk No data
- Chance of severe wind over 30 yrs
- —
Air-quality risk No data
- Unhealthy air days now
- —
- Unhealthy air days in 30 yrs
- —
Risk factors via First Street. Map © Google.
Why this score? — see what drove the D- grade
The composite is a weighted blend of 9 inputs, each scored 0–100. Each bar is that input's sub-score; the figure is the points it added to the 100-point composite (weight × sub-score).
- Appreciation +9.3/10.0
- Cash flow +8.2/30.0
- Condition / age +4.0/5.0
- ARV discount +3.8/15.0
- Livability +3.7/5.0
- 1% rule +3.2/10.0
- Schools +2.7/10.0
- Rent growth +2.6/5.0
- DSCR +2.2/10.0
$405,000
🖨 Deal sheet (PDF) 📄 Offer letter ✓ Due diligence
Multi-family units
County records classify this as Multi-Family (2-4 Unit). Listing-text estimate: 2 units. confirmed
Listing remarks
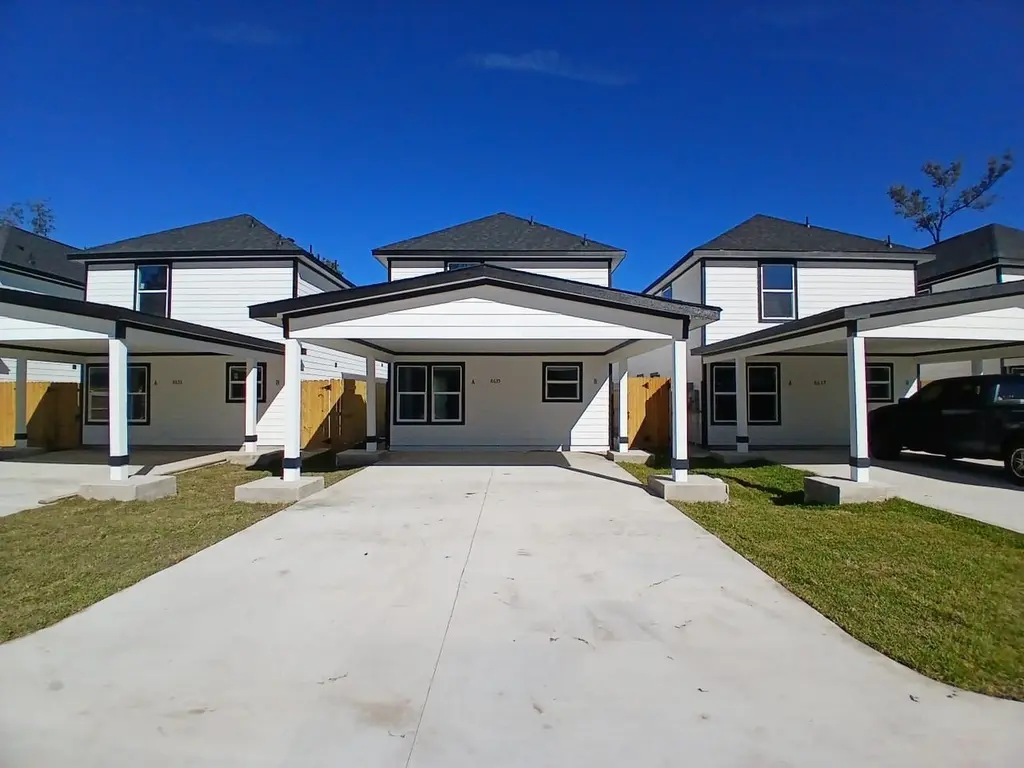
Check out this two-story tenant-occupied built in 2024 duplex ! making it an excellent income-producing investment from day one. Built by a quality builder, this property offers a well-designed and durable product with two identical units, each featuring 3 bedrooms, 2.5 bathrooms, and approximately 1,150 SF of living space. Each unit boasts laminate flooring throughout, modern kitchens with granite countertops, stylish backsplash, and ample cabinetry, plus washer and dryer connections. The spacious bedrooms include closets, and the bathrooms feature comfortable tubs designed for everyday living. Located in a quiet residential neighborhood in northeast Houston, the property offers easy acces
Key facts
- Modern kitchens
- Two story duplex
- Granite countertops
Tags
Property features AI
Exterior
- Utilities: Electric heating and cooling
- Home design: Residential income property; Built in 2024; Total building area approximately 2,300
- Exterior features: Lot with other/unspecified features
Interior
- Bathrooms: 2 full bathrooms
- Heating & cooling: Central heating (electric); Central air conditioning (electric)
- Interior features: Two total units (duplex/residential income)
Neighborhood map
What this means for you Summary
Snapshot
- This is a 2 × 3.0-bed/2.5-bath units multifamily listed at $405k. Condition is rated good.
Deal economics
- At list price, monthly cash flow is $-383 ($-5k/yr) — negative. Per door: $-192/mo.
- To cash-flow at today's rent, offer at most $337k (16.7% below list).
- To meet the 1% rule (rent ≥ 1% of price), the offer needs to be $330k (18.4% below list).
- Recommended offer: $330k (18.4% below list) — sets the bar for 1% rule.
- Cap rate 5.2% vs local median 3.2% in Houston — top-decile yield for the area; either an underpriced asset or a hidden risk that comps aren't pricing in. Stress-test before assuming the spread holds.
Location & tenants
- Location reads 74/100 on livability (#184 in TX, #4,771 nationally) — a middle-class / working-renter tenant base. Strengths: amenities A+, cost of living A+, housing A+; Watch: crime F.
- Houston ISD (urban): math 27% / reading 35% proficiency, ranked #593 of 826 in TX (top 72%) — families likely to look elsewhere, expect single-tenant / working-renter base with shorter leases; 71% free/reduced lunch — lower-income household profile, screen leases tightly.
- Zoned schools: Key Middle (math 10% / reading 20%, grade F, #1,569 of 1,662 statewide, top 95%, 615 students, 100% FRL); Kashmere H S (math 14% / reading 22%, grade F, #1,445 of 1,632 statewide, top 89%, 725 students, 96% FRL) — zoned schools average 98% FRL vs 71% district-wide (27 pts higher); higher-poverty schools than district average — tighter screening recommended.
- Zoned-school proficiency averages 16% at this address vs 31% district-wide (-14 pts) — the specific schools serving this property underperform the Houston ISD average; the district grade overstates school quality for this exact location.
- Market conditions: Rents flat; 376 active listings in the ZIP; 29,883 units permitted in Harris County in 2024 (8,621 in 5+ unit buildings).
- At $3,303/mo this rent would consume 83% of the median local household income ($48k/yr) (locally 1297% of renters already pay >50% of income on rent) — very limited rent-growth headroom before tenants either downsize or default.
Forward outlook
- In year one you build about $38k of equity ($3k loan paydown + $35k appreciation (8.7% local appreciation)).
- Harris County population projected at +47% by 2050 — long-run rental-demand tailwind backs the buy-and-hold thesis.
- By year 2, paydown + projected appreciation supports a ~$61k cash-out refi (75% LTV) — recoverable capital for the next deal without selling this one.
Negotiation context
- It's been on market 41 days — a 3% lower offer ($393k) is reasonable based on typical stale-listing flexibility.
- 5 sale attempts since 2y ago with the ask held roughly flat each time — persistent listings suggest the price (not the market) is what's stuck; bring a comps-based counter.
Questions for the listing agent
- What do current leases actually rent for vs. the listed asking? Can we see a recent rent roll and the last 12 months of T-12 income?
- It's been on market 41 days. Have you received any prior offers? Is the seller open to a 18% concession, seller financing, or rate buy-down credit?
- Can we see the unit-by-unit rent roll, current vacancy, and any below-market leases? What's the average tenancy length?
- What capital expenditures (roof, boiler, parking lot, exteriors) have been made in the last 5 years, and what's planned in the next 2?
- Is there a deadline driving the sale (1031 exchange, divorce, estate, relocation)? That informs how much negotiation room exists.
- Schools are D-rated, which usually means shorter tenancies and higher turnover. Who's the typical renter profile here, and what's been the actual vacancy rate?
- Crime grade is F in this area — have there been break-ins, vandalism, or insurance claims at this property in the last 3 years? What carrier currently insures it and at what premium?
- The area grade is low — what's the realistic commute time and amenity access for the typical tenant pool here? Any planned neighborhood developments (good or bad) we should know about?
- What's the average days-on-market for RENTAL listings here right now (not sales)? A rising rental-DOM trend means longer vacancies and softer asking-rent achievability than the comps imply.
- What's the recent tenant-quality profile in this submarket — average credit score on applications, eviction rate, late-payment / NSF rate, and stable-employment percentage? A property-management company in the area should have these aggregated.
- How much new apartment / multifamily construction is in the pipeline within 1–3 miles? Heavy new supply (>2% of stock underway) typically softens rents 12–24 months out; light construction supports rent growth.
Investment metrics
- 1% rule
- 0.82% ✗
- Cap rate
- 5.16%
- Cash-on-cash
- -4.05%
- DSCR
- 0.82
- GRM
- 10.2
CMA / ARV
- ARV (median comp)
- $373,910
- List price
- $405,000
- Delta
- 8.31%
- Verdict
- FAIR
- Comps
- 20 within 1.0 mi
Show comp detail 2 sales within ~0.75 mi
| Address | Dist | Beds/Ba | Sqft | Sold | Price | $/sf | Match |
|---|---|---|---|---|---|---|---|
| 4812 Cruse Rd | 0.25mi | 6/1.0 | 2,274 (-2%) | 16mo | $289,000 | $127 | 56 |
| 5003 Jones St | 0.23mi | 6/2.0 | 2,420 (+4%) | 19mo | $430,000 | $178 | 54 |
Match score weights: distance 35% · size 25% · config 20% · recency 20%. Top-matched comps best support the ARV.
Projected returns pro-forma
8.65% appreciation · 0.44% rent growth · sell at horizon
- IRR
- 17.6%
- Equity multiple
- 2.33×
- Total profit
- $151,268
- Equity at exit
- $325,731
- IRR
- 16.0%
- Equity multiple
- 4.91×
- Total profit
- $443,245
- Equity at exit
- $664,583
Cash invested: $113,400 (down + closing). Projections, not guarantees.
Landlord ↔ Tenant lean methodology
- Overall (STATE)
- 87 Strongly Landlord-Friendly
- State Texas
- 87 Strongly Landlord-Friendly · R+5
- County
- — inherits STATE
- City
- — inherits STATE
ZIP-level market 77016
- Home prices YoY
- 2.8%
- Rents YoY
- 0.4%
- Active inventory
- 376
- Price-to-rent
- 20.4×
Monthly cashflow live
- Estimated rent
- $3,303 high interval (Pro) →
- Mortgage (P&I)
- −$2,124
- Tax from tax record
- −$700 /mo · $8,399/yr
- Insurance
- −$169
- HOA
- −$0
- Vacancy / Maint / Mgmt
- −$694
- Net cashflow
- $-383
Break-even live
Sensitivity live
| Price | -10% $-154 | -5% $-268 | +0% $-383 | +5% $-498 | +10% $-612 |
|---|---|---|---|---|---|
| Rent | -10% $-644 | -5% $-514 | +0% $-383 | +5% $-253 | +10% $-122 |
| Rate | -1.0pp $-179 | -0.5pp $-280 | base $-383 | +0.5pp $-488 | +1.0pp $-595 |
2-unit breakdown (identical units grouped — click to expand)
| Units | Beds | Baths | Est. rent |
|---|---|---|---|
| 2× units | 3.0 | 2.5 | $3,304 |
| #1 | 3.0 | 2.5 | $1,652 |
| #2 | 3.0 | 2.5 | $1,652 |
| Total (2 units) | $3,303 | ||
UW: 25.0% down · 7.5% · 30yr · 1.5% tax · 5.0% vac · 8.0% maint · 8.0% mgmt
Financing live
Cash to close
- Down payment
- $101,250
- Closing costs
- $12,150
- Reserves months
- —
- Total cash needed
- —
Loan-product check · same deal, 3 products live
Conventional
25% down · 7.5% · 30yr
- Down + closing
- —
- Monthly P&I
- —
- Monthly cashflow
- —
- DSCR
- —
- Eligible?
- —
Personal DTI + credit; lowest rate.
DSCR
20% down · 8.5% · 30yr
- Down + closing
- —
- Monthly P&I
- —
- Monthly cashflow
- —
- DSCR
- —
- Eligible?
- —
No personal income docs; deal must DSCR.
Hard money
10% down · 12.0% · 12mo
- Down + closing
- —
- Monthly P&I
- —
- Monthly cashflow
- —
- DSCR
- —
- Eligible?
- —
Short-term bridge; refi at stabilization.
Listing history 23 events
-
2026-06-21days on market $405,000 Active 41 DOM
-
2026-06-18days on market $405,000 Active 38 DOM
-
2026-06-17days on market $405,000 Active 37 DOM
-
2026-06-16days on market $405,000 Active 36 DOM
-
2026-06-15days on market $405,000 Active 35 DOM
-
2026-06-13days on market $405,000 Active 33 DOM
-
2026-06-10days on market $405,000 Active 29 DOM
-
2026-06-08days on market $405,000 Active 28 DOM
-
2026-06-07days on market $405,000 Active 27 DOM
-
2026-06-04days on market $405,000 Active 24 DOM
-
2026-06-01days on market $405,000 Active 21 DOM
-
2026-05-31days on market $405,000 Active 20 DOM
-
2026-05-11$405,000 Active 1006-char remark
-
2026-05-11historical
-
2026-03-10$425,000 Active
-
2026-02-28historical
-
2026-02-02$434,999 Active
-
2025-02-03historical $1,750
-
2025-01-17soldstatus Sold
-
2025-01-17soldstatus
-
2024-12-05$1,750
-
2024-11-06status Pending, Continue to Show
-
2024-10-22$425,000 Active
ⓘ Source: listings_history table (triggers on properties + properties_extension) + one-shot
backfill from property_details.listing_events for pre-trigger history.
Tax reassessment forecast TX · Resets to sale price
- Current annual tax
- $8,399 · $700/mo
- Projected year-2 tax
- $8,399 · $700/mo
- Expected delta
- $0/yr ($0/mo · 0.0%)
ⓘ Screening estimate from a state-policy table — verify with the county assessor before closing.
Nearby sold comps map
Loading sold comps map…
Walkable amenities ~0.75 mi
Loading nearby amenities…
Taxation est. · year 1
- Rental income
- $39,636
- − Mortgage interest
- −$22,686
- − Property taxes
- −$8,399
- − Insurance
- −$2,025
- − Repairs & maintenance
- −$3,171
- − Management
- −$3,171
- − Depreciation
- −$11,782
- Taxable loss
- −$11,597
- Est. tax savings @ 24.0%
- +$2,783
- After-tax cash flow
- $-1,814/yr
For passive investors: Depreciation is non-cash, so a rental often shows a tax loss while cash-flowing — sheltering income. Rental losses are passive: they offset passive income freely, and up to $25,000/yr can offset ordinary (W-2) income if you actively participate and your MAGI is under $100k (phasing out to $0 by $150k); unused losses carry forward. On sale, claimed depreciation is recaptured at up to 25%, and gains may owe capital-gains tax (a 1031 exchange can defer both). Figures are a year-1 estimate at your 24.0% rate — not tax advice; consult a CPA.
Condition & rehab AI · 12 photos
This two-story tenant-occupied duplex built in 2024 is in excellent condition with modern amenities and a good location. It's ready for immediate occupancy and can be further enhanced with minor updates.
Value-add opportunities
- Both Painting exterior and interior walls — Fresh paint can enhance curb appeal and interior aesthetics
- Both Add landscaping around the property — Landscaping can improve curb appeal and add value
- Both Install smart home devices — Smart home devices can increase convenience and add value
- Both Upgrade appliances — Upgrading appliances can make the home more appealing to potential buyers/tenants
Renovation cost estimate screening
Value-add ROI direction
- Both Painting exterior and interior walls — Fresh paint can enhance curb appeal and interior aesthetics ↑
- Both Add landscaping around the property — Landscaping can improve curb appeal and add value ↑
- Both Install smart home devices — Smart home devices can increase convenience and add value ↑
- Both Upgrade appliances — Upgrading appliances can make the home more appealing to potential buyers/tenants ↑
ⓘ Cost ranges are severity-bucket heuristics (US national rule-of-thumb). Get contractor quotes + a written scope before underwriting a rehab budget.
Schools (NCES district)
- District
- Houston ISD
- NCES district ID
- 4823640
- Math proficiency
- 27% ▼ -18.00%
- Reading proficiency
- 35% ▼ -6.00%
- Median HH income
- $46,054
- Composite
- 26.63/100
- National rank
- #7173
- State rank
- #593 of 826 in TX
Livability — Houston
- Score
- 74/100
- State rank
- #184
- US rank
- #4771
Category grades
Schools grade is shown separately in the Schools card above.
Census & demographics
- Census place
- Houston, TX
- County
- Harris County · 4,702,590 people
- City population
- 3,226,434
- Metro
- Houston-The Woodlands-Sugar Land, TX
- Population (ZIP)
- 29,841
- Household income
- $47,677
- Rent vs Own
- Severe rent burden
- 1297.0
Population outlook (Harris County) Hauer SSP2
- Today (2025)
- 5,571,493 people
- By 2030
- 6,089,821 · +9.3%
- By 2040
- 7,142,806 · +28.2%
- By 2050
- 8,185,864 · +46.9%
- By 2075
- 10,574,329 · +89.8%
- By 2100
- 12,109,958 · +117.4%
Race, ethnicity, and origin ACS 2023
- Neighborhood character
- Majority Black (56%)
- Race & ethnicity
- Black 56% Hispanic / Latino 42% Two or more races 28%
- Hispanic origin (detail)
- Mexican 34%
- Foreign-born
- 18% · Canada
- Languages at home
- 61% English-only · Spanish 37%
Political lean MEDSL · Harris
- 2024 margin
- Lean D (+5.5) · D 52.0% · R 46.4% · Other 1.6%
- 2008→2024 swing
- +3.9pp toward D · 2008: 1.6pp · 2024: 5.5pp
- All cycles
- 2024: D+5.5 2020: D+13.3 2016: D+12.4 2012: D+0.1 2008: D+1.6
Not yet ingested
- Civics
- —
Market trends
- HPI YoY
- ▲ 8.65%
- Current HPI
- 315.6765
- Rent YoY
- ▲ 0.44%
- Metro
- Houston-The Woodlands-Sugar Land, TX
- State GDP YoY
- ▲ 3.95%
- F500 in state
- 110
Industry mix (Fortune 500 HQ in TX)
| Industry | F500 HQs | Revenue |
|---|---|---|
| Energy | 16 | $1,198B |
|
||
| Technology | 5 | $198B |
|
||
| Engineering / Construction | 4 | $72B |
|
||
| Energy Services | 3 | $60B |
|
||
| Utilities | 3 | $41B |
|
||
| Healthcare | 2 | $330B |
|
||
Price history
-4.7% since first listed11 events — show timeline
- 2026-05-11 Listing Removed — HARMLS
- 2026-05-11 Listed $405,000 HARMLS
- 2026-03-10 Listed $425,000 HARMLS
- 2026-02-28 Listing Removed — HARMLS
- 2026-02-02 Listed $434,999 HARMLS
- 2025-02-03 Rental Removed $1,750 APPFOLIO
- 2025-01-17 Sold (Public Records) — Public Records
- 2025-01-17 Sold (MLS) — HARMLS
- 2024-12-05 Listed for Rent $1,750 APPFOLIO
- 2024-11-06 Pending — HARMLS
- 2024-10-22 Listed $425,000 HARMLS
Cash-flow waterfall
monthlySold comps — $/sqft
last 12 mo · ≤1 miLoading sold comps…