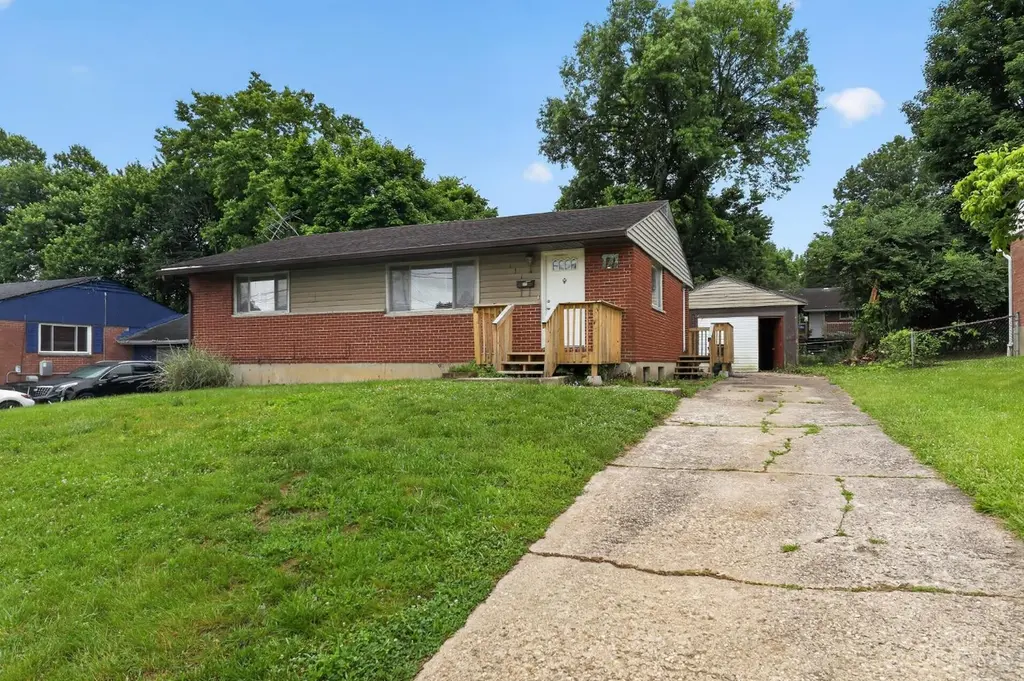
171 Brookhaven Ave · Woodlawn, OH
Flood risk 1/10 · Minimal
- FEMA flood zone
- X (unshaded)
- Chance of flooding over 30 yrs
- 0.0%
- Est. flood insurance / yr
- $473 – $860
Fire risk 1/10 · Minimal
- Est. fire insurance / yr
- $713 – $1,323
Heat risk 5/10 · Moderate
- Hot days now (above 103°F)
- 7 days/yr
- Hot days in 30 yrs
- 19 days/yr
Wind risk 2/10 · Minimal
- Chance of severe wind over 30 yrs
- 1.0%
Air-quality risk 4/10 · Minor
- Unhealthy air days now
- 4 days/yr
- Unhealthy air days in 30 yrs
- 7 days/yr
Risk factors via First Street. Map © Google.
Why this score? — see what drove the C grade
The composite is a weighted blend of 9 inputs, each scored 0–100. Each bar is that input's sub-score; the figure is the points it added to the 100-point composite (weight × sub-score).
- Cash flow +19.3/30.0
- ARV discount +15.0/15.0
- DSCR +6.1/10.0
- 1% rule +4.8/10.0
- Rent growth +4.5/5.0
- Livability +3.8/5.0
- Schools +3.4/10.0
- Condition / age +2.5/5.0
- Appreciation +0.0/10.0
$214,900
🖨 Deal sheet 📄 Offer letter ✓ Due diligence
Listing remarks MLS
Very Nice 4 bedroom 2 full bath Brick Ranch located in the Village of Woodlawn. Hardwood flooring, fenced backyard, 1 car detached garage.
Key facts
- Mid-century design
- Single-story layout
- Hardwood flooring
Tags
Property features AI
Finance
- Other: Zoned residential
- Financial info: Lease not considered
- HOA & community: No homeowners association
Exterior
- Parking: Detached garage with 1 garage space
- Security: No security features listed
- Utilities: Public water; Public sewer; Natural gas service available
- Home design: Ranch-style single family home; One story
- Construction: Block foundation
- Exterior features: Shingle roof; Brick exterior; Windows with unspecified/other features
Interior
- Kitchen: Kitchen with additional/custom features
- Bedrooms: Three bedrooms, all on the main level; Primary bedroom on main level
- Flooring: No flooring details provided
- Bathrooms: One full bathroom on the main level; Primary bath described as other (not standard en-suite)
- Heating & cooling: Forced air heating; Central air conditioning; Gas water heating
- Interior features: Five total rooms; Full basement; Basement has additional finished/usable space (850 sq ft reported)
- Laundry & utility: No specific laundry appliances listed
Neighborhood map
What this means for you Summary
Snapshot
- This is a 3-bed/1.0-bath single-family listed at $215k.
Deal economics
- At list price, monthly cash flow is $237 ($3k/yr) — positive.
- The deal already cash-flows at list — no discount required.
- To meet the 1% rule (rent ≥ 1% of price), the offer needs to be $211k (2.0% below list).
- Recommended offer: $211k (2.0% below list) — sets the bar for 1% rule.
Location & tenants
- Location reads 76/100 on livability (#238 in OH, #3,792 nationally) — a middle-class / working-renter tenant base. Strengths: commute A+, cost of living A+, housing A+; Watch: schools C-, crime F, amenities F.
- Princeton City (suburban): math 34% / reading 43% proficiency, ranked #542 of 656 in OH (top 83%) — families likely to look elsewhere, expect single-tenant / working-renter base with shorter leases.
- Market conditions: Rents rising fast (+8.0%/yr); 47 active listings in the ZIP; 4 comparable units currently listed for rent nearby; rentals leasing fast (median 8d on market — plan ~1-2 weeks tenant-placement turnaround); 801 units permitted in Hamilton County in 2024 (190 in 5+ unit buildings).
- This rent runs 36% of the median local income ($69k/yr) — at the standard rent-burdened threshold; future hikes will face affordability resistance.
Forward outlook
- Local home prices are declining (-3.0%/yr); year-one equity from $1k of loan paydown is wiped out by about $6k of value loss. Plan a longer hold.
- At projected returns (-3.0% appreciation + 8.0% rent growth), your $60k cash investment doubles in ~10 years — after that, you're playing with house money.
Negotiation context
- Only 7 days on market — expect competitive offers; lowballing is unlikely to land.
- 5 sale attempts since 24y ago with the ask held roughly flat each time — persistent listings suggest the price (not the market) is what's stuck; bring a comps-based counter.
Risks & watch-outs
- Watch-outs: built in 1957 — expect roof / HVAC / electrical / plumbing capex.
- Climate carrying-cost: extreme-heat days projected 7→19/yr by 2055 (HVAC capex compounding) — expect insurance premiums to compound above CPI over the hold.
Questions for the listing agent
- Built in 1957 — when were the roof, HVAC, electrical panel, plumbing, and water heater last replaced?
- Is there a deadline driving the sale (1031 exchange, divorce, estate, relocation)? That informs how much negotiation room exists.
- Crime grade is F in this area — have there been break-ins, vandalism, or insurance claims at this property in the last 3 years? What carrier currently insures it and at what premium?
- What's the average days-on-market for RENTAL listings here right now (not sales)? A rising rental-DOM trend means longer vacancies and softer asking-rent achievability than the comps imply.
- What's the recent tenant-quality profile in this submarket — average credit score on applications, eviction rate, late-payment / NSF rate, and stable-employment percentage? A property-management company in the area should have these aggregated.
- How much new for-sale + rental construction is in the pipeline within 1–3 miles? Heavy new supply typically softens prices + rents 12–24 months out; constrained supply supports both.
Investment metrics
- 1% rule
- 0.98% ✗
- Cap rate
- 7.62%
- Cash-on-cash
- 4.73%
- DSCR
- 1.21
- GRM
- 8.5
CMA / ARV
- ARV (on-the-fly)
- $360,750
- Comps found
- 6
Show comp detail 6 sales within ~0.75 mi
| Address | Dist | Beds/Ba | Sqft | Sold | Price | $/sf | Match |
|---|---|---|---|---|---|---|---|
| 10110 Woodstock Dr | 0.26mi | 3/2.0 | 1,831 (-6%) | 5mo | $241,000 | $132 | 70 |
| 10166 Arnold Dr | 0.20mi | 3/2.5 | 2,080 (+7%) | 10mo | $384,900 | $185 | 65 |
| 150 Joliet Ave | 0.13mi | 3/2.0 | 1,820 (-7%) | 21mo | $220,000 | $121 | 61 |
| 340 Mayview Forest Dr | 0.48mi | 3/2.0 | 1,900 (-3%) | 20mo | $386,000 | $203 | 53 |
| 10184 Lochcrest Dr | 0.71mi | 4/2.5 (+1) | 2,064 (+6%) | 4mo | $395,000 | $191 | 43 |
| 460 Whitestone Ct | 0.71mi | 4/2.5 (+1) | 2,106 (+8%) | 6mo | $383,000 | $182 | 38 |
Match score weights: distance 35% · size 25% · config 20% · recency 20%. Top-matched comps best support the ARV.
Projected returns pro-forma
-3.0% appreciation · 8.0% rent growth · sell at horizon
- IRR
- -3.6%
- Equity multiple
- 0.86×
- Total profit
- $-8,593
- Equity at exit
- $32,042
- IRR
- 10.9%
- Equity multiple
- 2.04×
- Total profit
- $62,602
- Equity at exit
- $18,581
Cash invested: $60,172 (down + closing). Projections, not guarantees.
Landlord ↔ Tenant lean methodology
- Overall (STATE)
- 73 Landlord-Friendly
- State Ohio
- 73 Landlord-Friendly · R+6
- County
- — inherits STATE
- City
- — inherits STATE
ZIP-level market 45215
- Rents YoY
- 8.0%
- Active inventory
- 47
- Price-to-rent
- 8.5×
Monthly cashflow live
- Estimated rent
- $2,106 medium interval (Pro) →
- Mortgage (P&I)
- −$1,127
- Tax from tax record
- −$210 /mo · $2,520/yr
- Insurance
- −$90
- HOA
- −$0
- Vacancy / Maint / Mgmt
- −$442
- Net cashflow
- $237
Break-even live
UW: 25.0% down · 7.5% · 30yr · 1.5% tax · 5.0% vac · 8.0% maint · 8.0% mgmt
Financing live
Cash to close
- Down payment
- $53,725
- Closing costs
- $6,447
- Reserves months
- —
- Total cash needed
- —
Loan-product check · same deal, 3 products live
Conventional
25% down · 7.5% · 30yr
- Down + closing
- —
- Monthly P&I
- —
- Monthly cashflow
- —
- DSCR
- —
- Eligible?
- —
Personal DTI + credit; lowest rate.
DSCR
20% down · 8.5% · 30yr
- Down + closing
- —
- Monthly P&I
- —
- Monthly cashflow
- —
- DSCR
- —
- Eligible?
- —
No personal income docs; deal must DSCR.
Hard money
10% down · 12.0% · 12mo
- Down + closing
- —
- Monthly P&I
- —
- Monthly cashflow
- —
- DSCR
- —
- Eligible?
- —
Short-term bridge; refi at stabilization.
Rent comps 4 comps
| Address | Beds | Baths | Sqft | Rent | $/sqft | DOM | Units | Dist |
|---|---|---|---|---|---|---|---|---|
| 10637 Springfield Pike Cincinnati, OH | 1.0–3.0 | 1.0–2.0 | 1042 | $2,305 | $2.21 | 2d | 50 | 0.84mi |
| 10562 Toulon Dr Cincinnati, OH | 3.0 | 1.5 | 1390 | $2,300 | $1.65 | 4d | 1 | 1.04mi |
| 911 Prairie Ave Cincinnati, OH | 4.0 | 1.0 | 1243 | $1,995 | $1.60 | 7d | 1 | 1.14mi |
| 552 Waycross Rd Cincinnati, OH | 4.0 | 2.5 | 1764 | $2,306 | $1.31 | 10d | 1 | 1.49mi |
Listing history 7 events
-
2026-06-18days on market $214,900 Active 7 DOM
-
2026-06-17days on market $214,900 Active 6 DOM
-
2026-06-16days on market $214,900 Active 5 DOM
-
2026-06-15days on market $214,900 Active 4 DOM
-
2026-06-13days on market $214,900 Active 2 DOM
-
2026-06-13remarks 699-char remark
-
2026-06-13$214,900 Active 1 DOM
ⓘ Source: listings_history table (triggers on properties + properties_extension) + one-shot
backfill from property_details.listing_events for pre-trigger history.
Tax reassessment forecast OH · Partial reset (capped growth)
- Current annual tax
- $2,520 · $210/mo
- Projected year-2 tax
- $2,936 · $245/mo
- Expected delta
- +$416/yr (+$35/mo · 16.5%)
ⓘ Screening estimate from a state-policy table — verify with the county assessor before closing.
Climate risk First Street
- Flood 1/10 Low FEMA zone X (unshaded) · 0% chance over 30 yrs
- Wildfire 1/10 Low
- Heat 5/10 Major 7 d/yr ≥103°F today · 19 d/yr by 30 yrs out
- Wind 2/10 Low 100% chance of damaging wind over 30 yrs
- Air quality 4/10 Moderate 4 unhealthy d/yr today · 7 by 30 yrs out
Nearby sold comps map
Loading sold comps map…
Walkable amenities ~0.75 mi
Loading nearby amenities…
Taxation est. · year 1
- Rental income
- $25,270
- − Mortgage interest
- −$12,038
- − Property taxes
- −$2,520
- − Insurance
- −$1,074
- − Repairs & maintenance
- −$2,022
- − Management
- −$2,022
- − Depreciation
- −$6,252
- Taxable loss
- −$656
- Est. tax savings @ 24.0%
- +$158
- After-tax cash flow
- $3,003/yr
For passive investors: Depreciation is non-cash, so a rental often shows a tax loss while cash-flowing — sheltering income. Rental losses are passive: they offset passive income freely, and up to $25,000/yr can offset ordinary (W-2) income if you actively participate and your MAGI is under $100k (phasing out to $0 by $150k); unused losses carry forward. On sale, claimed depreciation is recaptured at up to 25%, and gains may owe capital-gains tax (a 1031 exchange can defer both). Figures are a year-1 estimate at your 24.0% rate — not tax advice; consult a CPA.
Schools (NCES district)
- District
- Princeton City
- NCES district ID
- 3904467
- Math proficiency
- 34% ▼ -18.00%
- Reading proficiency
- 43% ▼ -8.00%
- Median HH income
- $53,182
- Composite
- 33.52/100
- National rank
- #5436
- State rank
- #542 of 656 in OH
Livability — Woodlawn
- Score
- 76/100
- State rank
- #238
- US rank
- #3792
Category grades
Schools grade is shown separately in the Schools card above.
Census & demographics
- Census place
- Woodlawn, OH
- County
- Hamilton County · 701,295 people
- Metro
- Cincinnati, OH-KY-IN
- Population (ZIP)
- 30,586
- Household income
- $69,372
- Rent vs Own
- Severe rent burden
- 1529.0
Population outlook (Hamilton County) Hauer SSP2
- Today (2025)
- 826,054 people
- By 2030
- 830,947 · +0.6%
- By 2040
- 832,319 · +0.8%
- By 2050
- 822,428 · -0.4%
- By 2075
- 788,688 · -4.5%
- By 2100
- 710,674 · -14.0%
Race, ethnicity, and origin ACS 2023
- Neighborhood character
- Majority White (63%)
- Race & ethnicity
- White 63% Black 26% Two or more races 6% Hispanic / Latino 3% Asian 2%
- Common ancestry
- Italian 3% Slovak 2% Lithuanian 1%
- Foreign-born
- 4% · Canada
- Languages at home
- 95% English-only · Spanish 2% Other Indo-European 1% French/Haitian/Cajun 1%
Political lean MEDSL · Hamilton
- 2024 margin
- D (+14.9) · D 57.0% · R 42.1%
- 2008→2024 swing
- +7.9pp toward D · 2008: 7.0pp · 2024: 14.9pp
- All cycles
- 2024: D+14.9 2020: D+15.9 2016: D+9.5 2012: D+4.9 2008: D+7.0
Not yet ingested
- Civics
- —
Market trends
- HPI YoY
- ▼ -263.50%
- Current HPI
- 217.3319
- Rent YoY
- ▲ 8.02%
- Metro
- Cincinnati, OH-KY-IN
- State GDP YoY
- ▲ 1.98%
- F500 in state
- 48
Industry mix (Fortune 500 HQ in OH)
| Industry | F500 HQs | Revenue |
|---|---|---|
| Insurance | 3 | $145B |
|
||
| Industrial Machinery | 3 | $49B |
|
||
| Financial Services | 3 | $24B |
|
||
| Consumer Goods | 2 | $93B |
|
||
| Aerospace / Defense | 2 | $47B |
|
||
| Utilities | 2 | $33B |
|
||
Price history
+616.3% since first listed14 events — show timeline
- 2026-06-11 Listed $214,900 Cincy MLS
- 2022-07-29 Sold (Public Records) $490,000 Public Records
- 2013-03-15 Sold (MLS) $28,000 Cincy MLS
- 2012-10-09 Listing Removed — Cincy MLS
- 2012-10-08 Listed $33,300 Cincy MLS
- 2012-03-27 Listed $29,900 Cincy MLS
- 2003-11-14 Sold (Public Records) $98,000 Public Records
- 2003-09-01 Listing Removed — Cincy MLS
- 2003-04-03 Listed $98,000 Cincy MLS
- 2003-04-01 Listing Removed — Cincy MLS
- 2002-08-20 Listed $105,000 Cincy MLS
- 1993-10-01 Sold (Public Records) $59,900 Public Records
- 1991-05-13 Sold (Public Records) $59,000 Public Records
- 1991-04-02 Sold (Public Records) $30,000 Public Records
Property tax history
+14.2%/yrLatest (2025): $2,520 · +10.7% YoY. Source: county tax records.
Cash-flow waterfall
monthlySold comps — $/sqft
last 12 mo · ≤1 miLoading sold comps…