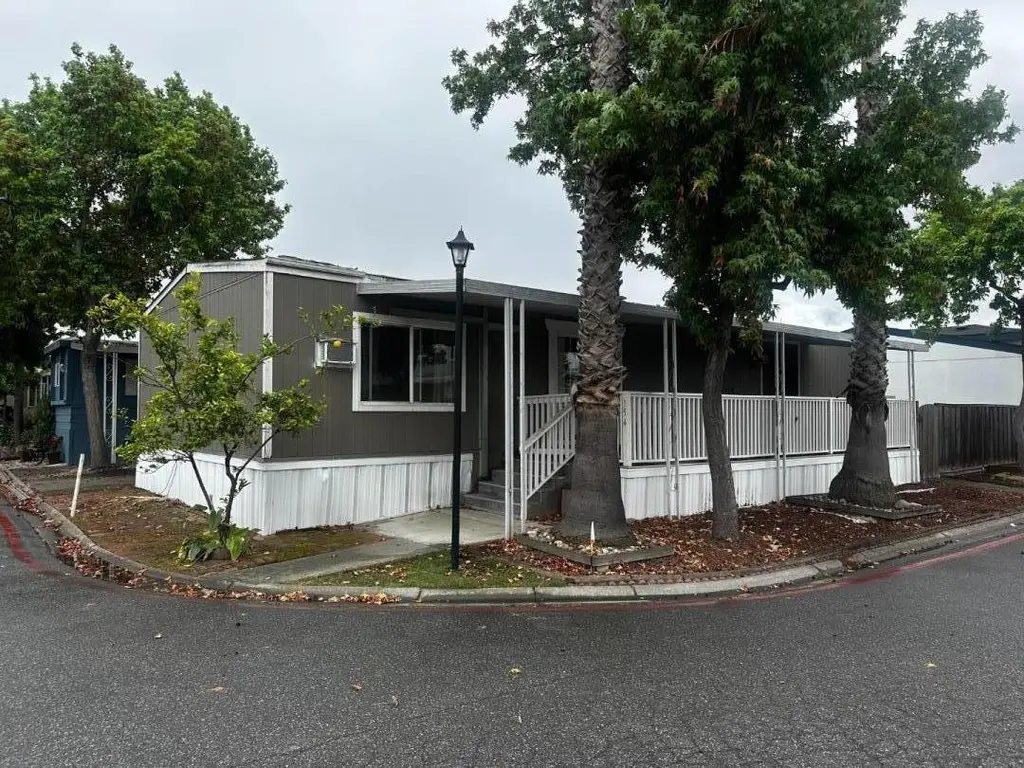
154 El Bosque St #154 · San Jose, CA
Flood risk 5/10 · Moderate
- FEMA flood zone
- X (shaded)
- Chance of flooding over 30 yrs
- 0.24%
- Est. flood insurance / yr
- $507 – $1,088
Fire risk 1/10 · Minimal
- Est. fire insurance / yr
- $659 – $1,223
Heat risk 5/10 · Moderate
- Hot days now (above 91°F)
- 7 days/yr
- Hot days in 30 yrs
- 15 days/yr
Wind risk 1/10 · Minimal
- Chance of severe wind over 30 yrs
- —
Air-quality risk 8/10 · Major
- Unhealthy air days now
- 14 days/yr
- Unhealthy air days in 30 yrs
- 16 days/yr
Risk factors via First Street. Map © Google.
Why this score? — see what drove the A- grade
The composite is a weighted blend of 9 inputs, each scored 0–100. Each bar is that input's sub-score; the figure is the points it added to the 100-point composite (weight × sub-score).
- Cash flow +30.0/30.0
- ARV discount +15.0/15.0
- 1% rule +10.0/10.0
- DSCR +10.0/10.0
- Schools +5.3/10.0
- Rent growth +4.0/5.0
- Appreciation +3.9/10.0
- Livability +3.9/5.0
- Condition / age +2.5/5.0
$229,000
🖨 Deal sheet 📄 Offer letter ✓ Due diligence
Listing remarks MLS
Located in San Jose, this 3-bedroom, 2-bathroom home offers 1,344 square feet of living space. The interior features a combined kitchen and family room area, complemented by a separate dining area. Central heating and central air conditioning provide year-round comfort. Laundry needs are met with an included washer and dryer. This property is part of the Santa Clara Unified elementary school district.
Key facts
- Central heating
- Separate dining area
- Built 1976
Tags
Property features AI
Finance
- Other: Local property tax (LPT) applies
- HOA & community: Community pool; Clubhouse; Indoor half basketball court; Barbecue area; Leased land within a family park (board approval required)
Exterior
- Parking: Carport with space for 3 vehicles; Assigned space number 154; Space rent applicable
- Utilities: Public water; Public sewer; Individual electric meters; Individual gas meters; Public utilities
- Home design: Manufactured home (park model); Living area approximately 1,344
- Construction: Metal roofing
- Exterior features: Metal roof; Leased land (park home site)
Interior
- Kitchen: Kitchen integrated with family room
- Bedrooms: 3 bedrooms
- Bathrooms: 2 full bathrooms
- Heating & cooling: Central forced air heating; Central forced air cooling
- Interior features: Kitchen and family room combined; Dining area; Washer and dryer included
- Laundry & utility: In-unit washer and dryer
Neighborhood map
What this means for you Summary
Snapshot
- This is a 3-bed/2.0-bath manufactured listed at $229k.
Deal economics
- At list price, monthly cash flow is $2k ($25k/yr) — positive.
- The deal already cash-flows at list — no discount required.
- Meets the 1% rule at list price ($5k rent vs $229k).
- Recommended offer: $226k (1.5% below list) — sets the bar for market timing.
- Cap rate 17.1% vs local median 1.6% in San Jose — top-decile yield for the area; either an underpriced asset or a hidden risk that comps aren't pricing in. Stress-test before assuming the spread holds.
Location & tenants
- Location reads 78/100 on livability (#68 in CA, #2,559 nationally) — a middle-class / working-renter tenant base. Strengths: amenities A+, commute A+, employment A+; Watch: crime F, cost of living F.
- Santa Clara Unified (urban): math 49% / reading 66% proficiency, ranked #75 of 517 in CA (top 14%) — acceptable for families but not a draw, mixed tenant base, ~2y average lease.
- Market conditions: Rents rising fast (+5.9%/yr); 19 active listings in the ZIP; 40 comparable units currently listed for rent nearby; rentals leasing fast (median 2d on market — plan ~1-2 weeks tenant-placement turnaround); high-income renter base; 3,838 units permitted in Santa Clara County in 2024 (1,886 in 5+ unit buildings).
Forward outlook
- Local home prices are declining (-2.1%/yr); year-one equity from $2k of loan paydown is wiped out by about $5k of value loss. Plan a longer hold.
- Santa Clara County population projected at +24% by 2050 — long-run rental-demand tailwind backs the buy-and-hold thesis.
- At projected returns (-2.1% appreciation + 5.9% rent growth), your $64k cash investment doubles in ~3 years — after that, you're playing with house money.
Negotiation context
- It's been on market 28 days — a 2% lower offer ($226k) is reasonable based on typical stale-listing flexibility.
- 6 sale attempts since 25y ago with the ask held roughly flat each time — persistent listings suggest the price (not the market) is what's stuck; bring a comps-based counter.
- Current owner paid $170k; 35% above their basis — modest negotiation headroom, anchor on the comps not their cost.
Risks & watch-outs
- Climate carrying-cost: moderate flood risk; extreme-heat days projected 7→15/yr by 2055 (HVAC capex compounding) — expect insurance premiums to compound above CPI over the hold.
Questions for the listing agent
- Built in 1976 — when were the roof, HVAC, electrical panel, plumbing, and water heater last replaced?
- Is there a deadline driving the sale (1031 exchange, divorce, estate, relocation)? That informs how much negotiation room exists.
- Crime grade is F in this area — have there been break-ins, vandalism, or insurance claims at this property in the last 3 years? What carrier currently insures it and at what premium?
- What's the average days-on-market for RENTAL listings here right now (not sales)? A rising rental-DOM trend means longer vacancies and softer asking-rent achievability than the comps imply.
- What's the recent tenant-quality profile in this submarket — average credit score on applications, eviction rate, late-payment / NSF rate, and stable-employment percentage? A property-management company in the area should have these aggregated.
- How much new for-sale + rental construction is in the pipeline within 1–3 miles? Heavy new supply typically softens prices + rents 12–24 months out; constrained supply supports both.
Investment metrics
- 1% rule
- 2.02% ✓
- Cap rate
- 17.10%
- Cash-on-cash
- 38.60%
- DSCR
- 2.72
- GRM
- 4.1
CMA / ARV
- ARV (on-the-fly)
- $294,336
- Comps found
- 12
Show comp detail 12 sales within ~0.75 mi
| Address | Dist | Beds/Ba | Sqft | Sold | Price | $/sf | Match |
|---|---|---|---|---|---|---|---|
| 304 Los Encinos St #304 | 0.12mi | 3/2.0 | 1,440 (+7%) | 2mo | $390,000 | $271 | 81 |
| 626 Hermitage St #626 | 0.30mi | 2/2.0 (-1) | 1,344 (0%) | 5mo | $250,000 | $186 | 76 |
| 673 Hermitage Pl #673 | 0.24mi | 2/2.0 (-1) | 1,296 (-4%) | 3mo | $230,000 | $177 | 76 |
| 462 Los Encinos St #462 | 0.15mi | 3/2.0 | 1,440 (+7%) | 14mo | $290,000 | $201 | 69 |
| 450 Los Encinos St #450 | 0.24mi | 3/2.0 | 1,325 (-1%) | 21mo | $360,000 | $272 | 69 |
| 316 Los Encinos St #316 | 0.22mi | 2/2.0 (-1) | 1,440 (+7%) | 5mo | $315,000 | $219 | 68 |
| 708 Spindrift Dr #708 | 0.22mi | 3/2.0 | 1,500 (+12%) | 4mo | $269,000 | $179 | 67 |
| 270 El Bosque Dr #270 | 0.07mi | 3/2.0 | 1,527 (+14%) | 10mo | $410,000 | $269 | 66 |
| 777 Spindrift Pl #777 | 0.35mi | 4/2.0 (+1) | 1,440 (+7%) | 4mo | $250,000 | $174 | 64 |
| 226 El Bosque St #226 | 0.13mi | 3/2.0 | 1,440 (+7%) | 22mo | $275,000 | $191 | 64 |
| 208 El Bosque Dr #208 | 0.11mi | 2/3.0 (-1) | 1,464 (+9%) | 13mo | $399,000 | $273 | 60 |
| 606 HERMITAGE St #606 | 0.31mi | 3/2.0 | 1,440 (+7%) | 21mo | $346,000 | $240 | 56 |
Match score weights: distance 35% · size 25% · config 20% · recency 20%. Top-matched comps best support the ARV.
Projected returns pro-forma
-2.15% appreciation · 5.94% rent growth · sell at horizon
- IRR
- 39.3%
- Equity multiple
- 2.82×
- Total profit
- $116,607
- Equity at exit
- $42,885
- IRR
- 46.2%
- Equity multiple
- 6.29×
- Total profit
- $339,511
- Equity at exit
- $35,144
Cash invested: $64,120 (down + closing). Projections, not guarantees.
Landlord ↔ Tenant lean methodology
- Overall (CITY)
- 0 Strongly Tenant-Friendly
- State California
- 18 Strongly Tenant-Friendly · D+13
- County
- — inherits STATE
- City San Jose
- 0 Strongly Tenant-Friendly · D+24
ZIP-level market 95134
- Home prices YoY
- -0.8%
- Rents YoY
- 5.9%
- Active inventory
- 19
- Price-to-rent
- 4.1×
Monthly cashflow live
- Estimated rent
- $4,614 high interval (Pro) →
- Mortgage (P&I)
- −$1,201
- Tax est. 1.5%
- −$286 /mo · $3,435/yr
- Insurance
- −$95
- HOA
- −$0
- Vacancy / Maint / Mgmt
- −$969
- Net cashflow
- $2,063
Break-even live
UW: 25.0% down · 7.5% · 30yr · 1.5% tax · 5.0% vac · 8.0% maint · 8.0% mgmt
Financing live
Cash to close
- Down payment
- $57,250
- Closing costs
- $6,870
- Reserves months
- —
- Total cash needed
- —
Loan-product check · same deal, 3 products live
Conventional
25% down · 7.5% · 30yr
- Down + closing
- —
- Monthly P&I
- —
- Monthly cashflow
- —
- DSCR
- —
- Eligible?
- —
Personal DTI + credit; lowest rate.
DSCR
20% down · 8.5% · 30yr
- Down + closing
- —
- Monthly P&I
- —
- Monthly cashflow
- —
- DSCR
- —
- Eligible?
- —
No personal income docs; deal must DSCR.
Hard money
10% down · 12.0% · 12mo
- Down + closing
- —
- Monthly P&I
- —
- Monthly cashflow
- —
- DSCR
- —
- Eligible?
- —
Short-term bridge; refi at stabilization.
Rent comps 40 comps
| Address | Beds | Baths | Sqft | Rent | $/sqft | DOM | Units | Dist |
|---|---|---|---|---|---|---|---|---|
| 175 Baypointe Pkwy San Jose, CA | 2.0 | 1.0–2.0 | 889 | $4,129 | $4.64 | 1d | 8 | 0.11mi |
| 3700 Casa Verde St San Jose, CA | 1.0–3.0 | 1.0–2.0 | 989 | $4,851 | $4.90 | 1d | 18 | 0.30mi |
| 3500 Palmilla Dr San Jose, CA | 3.0 | 1.0–2.0 | 1077 | $7,040 | $6.54 | 1d | 72 | 0.51mi |
| 1 Vista Montana San Jose, CA | 1.0–3.0 | 1.0–2.0 | 1184 | $5,013 | $4.23 | 1d | 7 | 0.63mi |
| 250 Brandon St San Jose, CA | 2.0 | 1.0–2.0 | 936 | $5,310 | $5.67 | 1d | 40 | 0.72mi |
| 99 Vista Montana San Jose, CA | 1.0–3.0 | 1.0–3.0 | 1085 | $4,713 | $4.34 | 1d | 20 | 0.73mi |
| 32 Torregata Loop San Jose, CA | 2.0 | 2.5 | 1130 | $3,800 | $3.36 | 14d | 1 | 0.78mi |
| 4516 Carlyle Ct #582 Santa Clara, CA | 3.0 | 2.0 | 1345 | $6,060 | $4.51 | 14d | 1 | 0.80mi |
| 3401 Iron Point Dr San Jose, CA | 2.0 | 1.0–2.0 | 909 | $5,139 | $5.65 | 1d | 23 | 0.84mi |
| 590 Mill Creek Ln Unit 1973 Santa Clara, CA | 2.0 | 2.0 | 950 | $4,150 | $4.37 | 43d | 1 | 0.87mi |
| 4500 Carlyle Ct Santa Clara, CA | 1.0–2.0 | 1.0–2.0 | 1021 | $4,963 | $4.86 | 1d | 10 | 0.87mi |
| 310 Crescent Village Cir San Jose, CA | 2.0 | 1.0–2.0 | 980 | $5,345 | $5.45 | 1d | 69 | 0.89mi |
| 1529 Coyote Creek Way Unit 1529 Milpitas, CA | 3.0 | 2.5 | 1464 | $4,500 | $3.07 | 1d | 1 | 0.90mi |
| 1600 Nantucket Cir Santa Clara, CA | 1.0–2.0 | 1.0–2.0 | 893 | $4,300 | $4.82 | 3d | 8 | 0.90mi |
| 501 Murphy Ranch Rd Milpitas, CA | 1.0–3.0 | 1.0–2.0 | 1133 | $4,782 | $4.22 | 1d | 17 | 0.91mi |
| 1570 Vista Club Cir #514 Santa Clara, CA | 2.0 | 2.0 | 1012 | $4,180 | $4.13 | 2d | 1 | 0.92mi |
| 1625 Nantucket Cir #515 Santa Clara, CA | 2.0 | 2.0 | 1051 | $4,050 | $3.85 | 12d | 1 | 0.92mi |
| 600 Park View Dr Unit 1977 Santa Clara, CA | 2.0 | 2.0 | 950 | $4,120 | $4.34 | 3d | 1 | 0.93mi |
| 1405 Coyote Creek Way Milpitas, CA | 3.0 | 3.0 | 1370 | $4,700 | $3.43 | 43d | 1 | 0.94mi |
| 1745 Nantucket Cir #577 Santa Clara, CA | 2.0 | 2.0 | 975 | $3,940 | $4.04 | 3d | 1 | 0.94mi |
| 1512 Vista Club Cir #432 Santa Clara, CA | 2.0 | 2.0 | 1012 | $4,120 | $4.07 | 20d | 1 | 0.98mi |
| 502 Mansion Park Dr Santa Clara, CA | 1.0–2.0 | 1.0–2.0 | 959 | $5,369 | $5.60 | 1d | 13 | 1.00mi |
| 4343 Renaissance Dr San Jose, CA | 1.0–2.0 | 1.0–2.0 | 851 | $4,305 | $5.06 | 1d | 12 | 1.01mi |
| 430 Oak Grove Dr #446 Santa Clara, CA | 2.0 | 2.0 | 961 | $4,350 | $4.53 | 3d | 1 | 1.06mi |
| 4028 Fitzpatrick Way Santa Clara, CA | 2.0 | 2.5 | 1437 | $4,100 | $2.85 | 14d | 1 | 1.11mi |
| 2230 Calle Del Mundo Santa Clara, CA | 1.0–2.0 | 1.0–2.0 | 800 | $4,919 | $6.14 | 2d | 9 | 1.11mi |
| 4424 Headen Way Santa Clara, CA | 3.0 | 2.5 | 1716 | $5,400 | $3.15 | 23d | 1 | 1.13mi |
| 1650 Hope Dr Santa Clara, CA | 1.0–3.0 | 1.0–2.0 | 1017 | $4,695 | $4.61 | 1d | 10 | 1.17mi |
| 3901 Lick Mill Blvd #1576 Santa Clara, CA | 1.0–2.0 | 1.0–2.0 | 1024 | $3,720 | $3.63 | 1d | 2 | 1.19mi |
| 5150 Calle del Sol Santa Clara, CA | 3.0 | 1.0–3.0 | 1357 | $13,431 | $9.90 | 2d | 89 | 1.21mi |
| 4142 Tobin Cir Santa Clara, CA | 3.0 | 3.5 | 1657 | $5,400 | $3.26 | 4d | 1 | 1.25mi |
| 373 River Oaks Cir San Jose, CA | 1.0–2.0 | 1.0–2.0 | 937 | $4,147 | $4.42 | 1d | 3 | 1.26mi |
| 415 Camille Cir San Jose, CA | 2.0 | 2.5 | 1561 | $4,009 | $2.57 | 12d | 1 | 1.30mi |
| 2333 Calle del Mundo Santa Clara, CA | 1.0–3.0 | 1.0–2.0 | 991 | $6,214 | $6.27 | 1d | 15 | 1.31mi |
| 1933 Silva Pl Santa Clara, CA | 3.0 | 2.5 | 1726 | $4,695 | $2.72 | 12d | 1 | 1.33mi |
| 700 Agnew Rd #1994 Santa Clara, CA | 1.0–2.0 | 1.0–2.0 | 1010 | $4,200 | $4.16 | 3d | 2 | 1.36mi |
| 730 Agnew Rd Santa Clara, CA | 1.0–2.0 | 1.0–2.0 | 967 | $4,529 | $4.68 | 1d | 21 | 1.37mi |
| 345 Village Center Dr San Jose, CA | 2.0 | 1.0–2.0 | 877 | $4,541 | $5.17 | 1d | 19 | 1.38mi |
| 440 Navaro Pl San Jose, CA | 2.0 | 2.0 | 1254 | $3,924 | $3.13 | 23d | 1 | 1.41mi |
| 1883 Agnew Rd #1587 Santa Clara, CA | 2.0 | 2.0 | 1070 | $3,720 | $3.48 | 20d | 1 | 1.41mi |
Listing history 25 events
-
2026-06-18days on market $229,000 Active 28 DOM
-
2026-06-17days on market $229,000 Active 27 DOM
-
2026-06-16days on market $229,000 Active 26 DOM
-
2026-06-15days on market $229,000 Active 25 DOM
-
2026-06-13days on market $229,000 Active 23 DOM
-
2026-06-13days on market $229,000 Active 22 DOM
-
2026-06-09days on market $229,000 Active 19 DOM
-
2026-06-08days on market $229,000 Active 18 DOM
-
2026-06-07days on market $229,000 Active 17 DOM
-
2026-06-05days on market $229,000 Active 14 DOM
-
2026-06-03days on market $229,000 Active 13 DOM
-
2026-06-02days on market $229,000 Active 12 DOM
-
2026-06-01days on market $229,000 Active 11 DOM
-
2026-05-31days on market $229,000 Active 10 DOM
-
2026-05-21$229,000 Active 404-char remark
Show marketing remark (404 chars)
Located in San Jose, this 3-bedroom, 2-bathroom home offers 1,344 square feet of living space. The interior features a combined kitchen and family room area, complemented by a separate dining area. Central heating and central air conditioning provide year-round comfort. Laundry needs are met with an included washer and dryer. This property is part of the Santa Clara Unified elementary school district.
-
2018-03-16soldstatus $169,900 Sold
-
2018-02-22status Pending (Do Not Show)
-
2018-01-30historical Contingent
-
2018-01-21$159,000 Active
-
2001-04-10historical
-
2001-01-29soldstatus $89,900
-
2001-01-11$89,900
ⓘ Source: listings_history table (triggers on properties + properties_extension) + one-shot
backfill from property_details.listing_events for pre-trigger history.
Climate risk First Street
- Flood 5/10 Major FEMA zone X (shaded) · 24% chance over 30 yrs
- Wildfire 1/10 Low
- Heat 5/10 Major 7 d/yr ≥91°F today · 15 d/yr by 30 yrs out
- Wind 1/10 Low
- Air quality 8/10 Severe 14 unhealthy d/yr today · 16 by 30 yrs out
Nearby sold comps map
Loading sold comps map…
Walkable amenities ~0.75 mi
Loading nearby amenities…
Taxation est. · year 1
- Rental income
- $55,372
- − Mortgage interest
- −$12,828
- − Property taxes
- −$3,435
- − Insurance
- −$1,145
- − Repairs & maintenance
- −$4,430
- − Management
- −$4,430
- − Depreciation
- −$6,662
- Taxable income
- $22,443
- Est. tax owed @ 24.0%
- −$5,386
- After-tax cash flow
- $19,367/yr
For passive investors: Depreciation is non-cash, so a rental often shows a tax loss while cash-flowing — sheltering income. Rental losses are passive: they offset passive income freely, and up to $25,000/yr can offset ordinary (W-2) income if you actively participate and your MAGI is under $100k (phasing out to $0 by $150k); unused losses carry forward. On sale, claimed depreciation is recaptured at up to 25%, and gains may owe capital-gains tax (a 1031 exchange can defer both). Figures are a year-1 estimate at your 24.0% rate — not tax advice; consult a CPA.
Schools (NCES district)
- District
- Santa Clara Unified
- NCES district ID
- 0635430
- Math proficiency
- 49% ▼ -3.00%
- Reading proficiency
- 66% ▲ 4.00%
- Median HH income
- $97,320
- Composite
- 53.46/100
- National rank
- #1459
- State rank
- #75 of 517 in CA
Livability — San Jose
- Score
- 78/100
- State rank
- #68
- US rank
- #2559
Category grades
Schools grade is shown separately in the Schools card above.
Census & demographics
- Census place
- San Jose, CA
- County
- Santa Clara County · 1,806,974 people
- City population
- 954,479
- Metro
- San Jose-Sunnyvale-Santa Clara, CA
- Population (ZIP)
- 30,471
- Household income
- $203,649
- Rent vs Own
- Severe rent burden
- 921.0
Population outlook (Santa Clara County) Hauer SSP2
- Today (2025)
- 2,179,074 people
- By 2030
- 2,301,297 · +5.6%
- By 2040
- 2,528,195 · +16.0%
- By 2050
- 2,712,135 · +24.5%
- By 2075
- 2,998,701 · +37.6%
- By 2100
- 2,931,429 · +34.5%
Race, ethnicity, and origin ACS 2023
- Neighborhood character
- Diverse neighborhood (Simpson 0.56)
- Race & ethnicity
- Asian 63% White 17% Hispanic / Latino 13% Two or more races 5% Black 3%
- Hispanic origin (detail)
- Mexican 8%
- Common ancestry
- Lithuanian 1% Italian 1% Subsaharan African 1%
- Foreign-born
- 65% · China, Canada, South Korea
- Languages at home
- 28% English-only · Other Indo-European 28% Other Asian/Pacific 14% Chinese 11%
Political lean MEDSL · Santa Clara
- 2024 margin
- Solid D (+40.0) · D 68.1% · R 28.1% · Other 3.8%
- 2008→2024 swing
- -0.9pp no change · 2008: 40.9pp · 2024: 40.0pp
- All cycles
- 2024: D+40.0 2020: D+47.4 2016: D+52.5 2012: D+42.1 2008: D+40.9
Not yet ingested
- Civics
- —
Market trends
- HPI YoY
- ▼ -2.15%
- Current HPI
- 276.0008
- Rent YoY
- ▲ 5.94%
- Metro
- San Jose-Sunnyvale-Santa Clara, CA
- State GDP YoY
- ▲ 3.21%
- F500 in state
- 116
Industry mix (Fortune 500 HQ in CA)
| Industry | F500 HQs | Revenue |
|---|---|---|
| Technology | 27 | $1,492B |
|
||
| Financial Services | 3 | $174B |
|
||
| Retail | 3 | $44B |
|
||
| Insurance | 3 | $26B |
|
||
| Media / Entertainment | 2 | $115B |
|
||
| Pharmaceuticals / Biotech | 2 | $62B |
|
||
Price history
+154.7% since first listed11 events — show timeline
- 2026-05-21 Listed $229,000 MLSListings
- 2026-05-21 Listed $229,000 MLSListings
- 2026-05-21 Listed $229,000 bridgeMLS, Bay East AOR, or Contra Costa AOR
- 2026-05-21 Listed $229,000 bridgeMLS, Bay East AOR, or Contra Costa AOR
- 2018-03-16 Sold (MLS) $169,900 MLSListings
- 2018-02-22 Pending — MLSListings
- 2018-01-30 Contingent — MLSListings
- 2018-01-21 Listed $159,000 MLSListings
- 2001-04-10 Listing Removed — MLSListings
- 2001-01-29 Sold (MLS) $89,900 MLSListings
- 2001-01-11 Listed $89,900 MLSListings
Cash-flow waterfall
monthlySold comps — $/sqft
last 12 mo · ≤1 miLoading sold comps…