 19-Plex
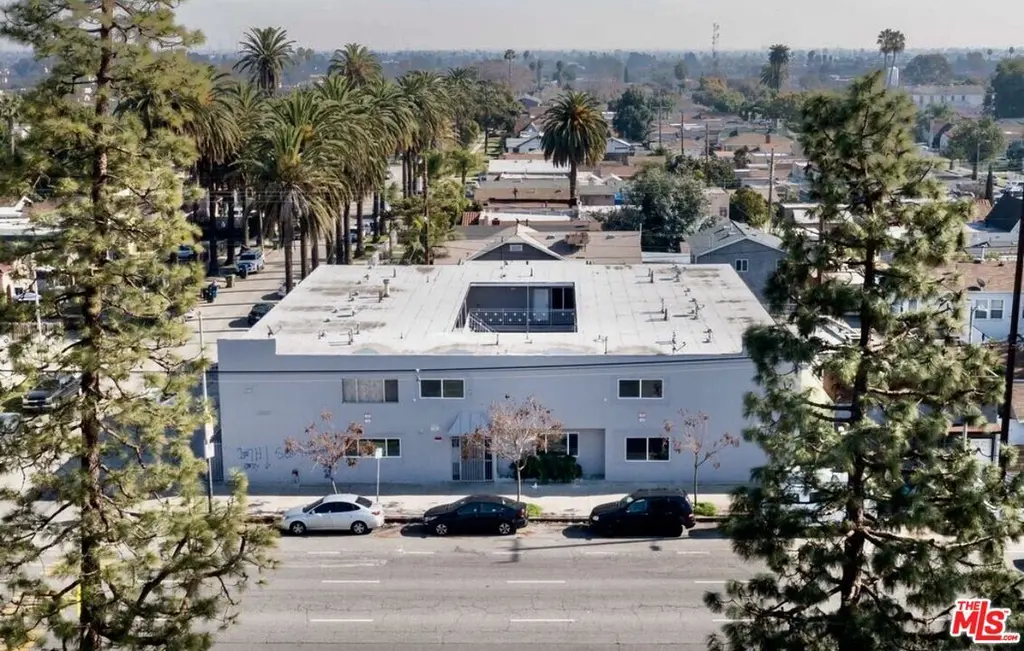
10500 S Vermont Ave · Los Angeles, CA
Flood risk 1/10 · Minimal
- FEMA flood zone
- X (unshaded)
- Chance of flooding over 30 yrs
- 0.0%
- Est. flood insurance / yr
- $507 – $1,088
Fire risk 1/10 · Minimal
- Est. fire insurance / yr
- $659 – $1,223
Heat risk 5/10 · Moderate
- Hot days now (above 87°F)
- 6 days/yr
- Hot days in 30 yrs
- 19 days/yr
Wind risk 1/10 · Minimal
- Chance of severe wind over 30 yrs
- —
Air-quality risk 5/10 · Moderate
- Unhealthy air days now
- 7 days/yr
- Unhealthy air days in 30 yrs
- 7 days/yr
Risk factors via First Street. Map © Google.
Why this score? — see what drove the F grade
The composite is a weighted blend of 9 inputs, each scored 0–100. Each bar is that input's sub-score; the figure is the points it added to the 100-point composite (weight × sub-score).
- Cash flow +8.1/30.0
- ARV discount +7.5/15.0
- Schools +3.6/10.0
- Livability +3.4/5.0
- Condition / age +2.5/5.0
- 1% rule +2.2/10.0
- DSCR +2.1/10.0
- Rent growth +1.9/5.0
- Appreciation +0.0/10.0
$4,999,000
🖨 Deal sheet 📄 Offer letter ✓ Due diligence
Multi-family units
County records classify this as Multi-Family (5+ Unit). Listing-text estimate: 19 units. confirmed
5+ unit building — per-unit beds/baths from public records are typically unavailable; the breakdown below (if shown) is an estimate from the listing text.
Listing remarks MLS
Exceptional 19-unit multifamily investment opportunity in Los Angeles featuring strong in-place income and significant long-term upside potential. Property consists of eighteen 1-bedroom/1-bathroom units and one studio unit with current average rents exceeding $1,800 per unit. Several renovated units feature updated kitchens, bathrooms, flooring, and modern finishes. The property offers approximately $409,080 in gross annual income and is centrally located near major transit corridors, employment centers, shopping, and dining. Ideal opportunity for investors seeking stable cash flow with future rental growth potential in a high-demand rental market. Buyer to independently verify all information including square footage, permits, zoning, and financials.
Key facts
- Renovated units
- Centrally located
- Updated bathrooms
Tags
Neighborhood map
What this means for you Summary
Snapshot
- This is a 19 × 1-bed/1-bath units multifamily listed at $5.00M.
Deal economics
- At list price, monthly cash flow is $-5k ($-59k/yr) — negative. Per door: $-257/mo.
- To cash-flow at today's rent, offer at most $4.14M (17.3% below list).
- To meet the 1% rule (rent ≥ 1% of price), the offer needs to be $3.58M (28.4% below list).
- Recommended offer: $3.58M (28.4% below list) — sets the bar for 1% rule.
- Cap rate 5.1% vs local median 2.1% in Los Angeles — top-decile yield for the area; either an underpriced asset or a hidden risk that comps aren't pricing in. Stress-test before assuming the spread holds.
Location & tenants
- Location reads 68/100 on livability (#273 in CA) — a middle-class / working-renter tenant base. Strengths: amenities A+, commute A+, employment B; Watch: health & safety C-, schools D+, crime F.
- Los Angeles Unified (urban): math 29% / reading 54% proficiency, ranked #223 of 517 in CA (top 43%) — families likely to look elsewhere, expect single-tenant / working-renter base with shorter leases; 67% free/reduced lunch — lower-income household profile, screen leases tightly.
- Market conditions: Rents soft (-2.5%/yr); 172 active listings in the ZIP; 19,697 units permitted in Los Angeles County in 2024 (9,426 in 5+ unit buildings).
- At $35,790/mo this rent would consume 806% of the median local household income ($53k/yr) (locally 7490% of renters already pay >50% of income on rent) — very limited rent-growth headroom before tenants either downsize or default.
Forward outlook
- Local home prices are declining (-3.0%/yr); year-one equity from $35k of loan paydown is wiped out by about $150k of value loss. Plan a longer hold.
- Los Angeles County population projected at +9% by 2050 — modest demand growth; plan on rents tracking national, not racing it.
Negotiation context
- It's been on market 44 days — a 3% lower offer ($4.85M) is reasonable based on typical stale-listing flexibility.
- 2 sale attempts since 4y ago with the ask held roughly flat each time — persistent listings suggest the price (not the market) is what's stuck; bring a comps-based counter.
Risks & watch-outs
- Climate carrying-cost: extreme-heat days projected 6→19/yr by 2055 (HVAC capex compounding) — expect insurance premiums to compound above CPI over the hold.
Questions for the listing agent
- What do current leases actually rent for vs. the listed asking? Can we see a recent rent roll and the last 12 months of T-12 income?
- It's been on market 44 days. Have you received any prior offers? Is the seller open to a 28% concession, seller financing, or rate buy-down credit?
- Can we see the unit-by-unit rent roll, current vacancy, and any below-market leases? What's the average tenancy length?
- What capital expenditures (roof, boiler, parking lot, exteriors) have been made in the last 5 years, and what's planned in the next 2?
- Built in 1964 — when were the roof, HVAC, electrical panel, plumbing, and water heater last replaced?
- Is there a deadline driving the sale (1031 exchange, divorce, estate, relocation)? That informs how much negotiation room exists.
- Schools are D-rated, which usually means shorter tenancies and higher turnover. Who's the typical renter profile here, and what's been the actual vacancy rate?
- Crime grade is F in this area — have there been break-ins, vandalism, or insurance claims at this property in the last 3 years? What carrier currently insures it and at what premium?
- The area grade is low — what's the realistic commute time and amenity access for the typical tenant pool here? Any planned neighborhood developments (good or bad) we should know about?
- What's the average days-on-market for RENTAL listings here right now (not sales)? A rising rental-DOM trend means longer vacancies and softer asking-rent achievability than the comps imply.
- What's the recent tenant-quality profile in this submarket — average credit score on applications, eviction rate, late-payment / NSF rate, and stable-employment percentage? A property-management company in the area should have these aggregated.
- How much new apartment / multifamily construction is in the pipeline within 1–3 miles? Heavy new supply (>2% of stock underway) typically softens rents 12–24 months out; light construction supports rent growth.
Investment metrics
- 1% rule
- 0.72% ✗
- Cap rate
- 5.12%
- Cash-on-cash
- -4.19%
- DSCR
- 0.81
- GRM
- 11.6
CMA / ARV
- ARV (median comp)
- $2,671,178
- List price
- $4,999,000
- Delta
- 87.15%
- Verdict
- OVERPRICED
- Comps
- 6 within 1.0 mi
Projected returns pro-forma
-3.0% appreciation · 0.0% rent growth · sell at horizon
- IRR
- -26.6%
- Equity multiple
- 0.12×
- Total profit
- $-1,226,329
- Equity at exit
- $745,367
- IRR
- -37.7%
- Equity multiple
- -0.34×
- Total profit
- $-1,875,044
- Equity at exit
- $432,222
Cash invested: $1,399,720 (down + closing). Projections, not guarantees.
Landlord ↔ Tenant lean methodology
- Overall (CITY)
- 0 Strongly Tenant-Friendly
- State California
- 18 Strongly Tenant-Friendly · D+13
- County
- — inherits STATE
- City Los Angeles
- 0 Strongly Tenant-Friendly · D+22
ZIP-level market 90044
- Rents YoY
- -2.5%
- Active inventory
- 172
- Price-to-rent
- 221.2×
Monthly cashflow live
- Estimated rent
- $35,790 high interval (Pro) →
- Mortgage (P&I)
- −$26,215
- Tax from tax record
- −$4,860 /mo · $58,321/yr
- Insurance
- −$2,083
- HOA
- −$0
- Vacancy / Maint / Mgmt
- −$7,516
- Net cashflow
- $-4,884
Break-even live
19-unit breakdown (identical units grouped — click to expand)
| Units | Beds | Baths | Est. rent |
|---|---|---|---|
| 19× units | 1 | 1 | $35,796 |
| #1 | 1 | 1 | $1,884 |
| #2 | 1 | 1 | $1,884 |
| #3 | 1 | 1 | $1,884 |
| #4 | 1 | 1 | $1,884 |
| #5 | 1 | 1 | $1,884 |
| #6 | 1 | 1 | $1,884 |
| #7 | 1 | 1 | $1,884 |
| #8 | 1 | 1 | $1,884 |
| #9 | 1 | 1 | $1,884 |
| #10 | 1 | 1 | $1,884 |
| #11 | 1 | 1 | $1,884 |
| #12 | 1 | 1 | $1,884 |
| #13 | 1 | 1 | $1,884 |
| #14 | 1 | 1 | $1,884 |
| #15 | 1 | 1 | $1,884 |
| #16 | 1 | 1 | $1,884 |
| #17 | 1 | 1 | $1,884 |
| #18 | 1 | 1 | $1,884 |
| #19 | 1 | 1 | $1,884 |
| Total (19 units) | $35,790 | ||
UW: 25.0% down · 7.5% · 30yr · 1.5% tax · 5.0% vac · 8.0% maint · 8.0% mgmt
Financing live
Cash to close
- Down payment
- $1,249,750
- Closing costs
- $149,970
- Reserves months
- —
- Total cash needed
- —
Loan-product check · same deal, 3 products live
Conventional
25% down · 7.5% · 30yr
- Down + closing
- —
- Monthly P&I
- —
- Monthly cashflow
- —
- DSCR
- —
- Eligible?
- —
Personal DTI + credit; lowest rate.
DSCR
20% down · 8.5% · 30yr
- Down + closing
- —
- Monthly P&I
- —
- Monthly cashflow
- —
- DSCR
- —
- Eligible?
- —
No personal income docs; deal must DSCR.
Hard money
10% down · 12.0% · 12mo
- Down + closing
- —
- Monthly P&I
- —
- Monthly cashflow
- —
- DSCR
- —
- Eligible?
- —
Short-term bridge; refi at stabilization.
Listing history 20 events
-
2026-06-18days on market $4,999,000 Active 44 DOM
-
2026-06-17days on market $4,999,000 Active 43 DOM
-
2026-06-16days on market $4,999,000 Active 42 DOM
-
2026-06-15days on market $4,999,000 Active 41 DOM
-
2026-06-13days on market $4,999,000 Active 39 DOM
-
2026-06-09days on market $4,999,000 Active 35 DOM
-
2026-06-08days on market $4,999,000 Active 34 DOM
-
2026-06-07days on market $4,999,000 Active 33 DOM
-
2026-06-04days on market $4,999,000 Active 30 DOM
-
2026-06-03days on market $4,999,000 Active 29 DOM
-
2026-06-02days on market $4,999,000 Active 28 DOM
-
2026-06-01days on market $4,999,000 Active 27 DOM
-
2026-05-31days on market $4,999,000 Active 26 DOM
-
2026-05-05$4,999,000 Active 762-char remark
Show marketing remark (762 chars)
Exceptional 19-unit multifamily investment opportunity in Los Angeles featuring strong in-place income and significant long-term upside potential. Property consists of eighteen 1-bedroom/1-bathroom units and one studio unit with current average rents exceeding $1,800 per unit. Several renovated units feature updated kitchens, bathrooms, flooring, and modern finishes. The property offers approximately $409,080 in gross annual income and is centrally located near major transit corridors, employment centers, shopping, and dining. Ideal opportunity for investors seeking stable cash flow with future rental growth potential in a high-demand rental market. Buyer to independently verify all information including square footage, permits, zoning, and financials.
-
2022-10-26soldstatus $4,550,000 1168-char remark
Show marketing remark (1168 chars)
BRC Advisors-BH is proud to present for sale this turn-key 19-unit apartment property located at 10500 South Vermont Avenue, in South Los Angeles. The property has recently undergone an extensive "gut job" renovation to fourteen of the nineteen units, including: copper plumbing, electrical, kitchens, bathrooms, windows, flooring, stucco, and much more. The seller approximates a total capital expenditure cost of approximately $700,000, which also includes the completion of the city-mandated seismic retrofit of the property as well as the addition of an ADU (unit #19). There are approximately eighteen onsite parking spaces. The property consists of eighteen (18) 1-bedroom units and a studio unit (the ADU). Most of the units are occupied by section 8 tenants with a significant portion of the rental income being deposited into the owner's bank account on the first of every month, providing a steady and reliable income stream during these times of eviction moratoriums which allow tenants to not pay. The property is an excellent "cash-flowing" opportunity for any investor looking to add to their portfolio of income-producing properties.
-
2022-08-31soldstatus $4,550,000
-
2022-03-20$4,595,000 1168-char remark
Show marketing remark (1168 chars)
BRC Advisors-BH is proud to present for sale this turn-key 19-unit apartment property located at 10500 South Vermont Avenue, in South Los Angeles. The property has recently undergone an extensive "gut job" renovation to fourteen of the nineteen units, including: copper plumbing, electrical, kitchens, bathrooms, windows, flooring, stucco, and much more. The seller approximates a total capital expenditure cost of approximately $700,000, which also includes the completion of the city-mandated seismic retrofit of the property as well as the addition of an ADU (unit #19). There are approximately eighteen onsite parking spaces. The property consists of eighteen (18) 1-bedroom units and a studio unit (the ADU). Most of the units are occupied by section 8 tenants with a significant portion of the rental income being deposited into the owner's bank account on the first of every month, providing a steady and reliable income stream during these times of eviction moratoriums which allow tenants to not pay. The property is an excellent "cash-flowing" opportunity for any investor looking to add to their portfolio of income-producing properties.
-
2008-10-16soldstatus $1,400,000
-
1989-06-21soldstatus $254,310
-
1989-06-21soldstatus $545,000
ⓘ Source: listings_history table (triggers on properties + properties_extension) + one-shot
backfill from property_details.listing_events for pre-trigger history.
Tax reassessment forecast CA · Resets to sale price
- Current annual tax
- $58,321 · $4,860/mo
- Projected year-2 tax
- $58,321 · $4,860/mo
- Expected delta
- $0/yr ($0/mo · 0.0%)
ⓘ Screening estimate from a state-policy table — verify with the county assessor before closing.
Climate risk First Street
- Flood 1/10 Low FEMA zone X (unshaded) · 0% chance over 30 yrs
- Wildfire 1/10 Low
- Heat 5/10 Major 6 d/yr ≥87°F today · 19 d/yr by 30 yrs out
- Wind 1/10 Low
- Air quality 5/10 Major 7 unhealthy d/yr today · 7 by 30 yrs out
Nearby sold comps map
Loading sold comps map…
Walkable amenities ~0.75 mi
Loading nearby amenities…
Taxation est. · year 1
- Rental income
- $429,480
- − Mortgage interest
- −$280,022
- − Property taxes
- −$58,321
- − Insurance
- −$24,995
- − Repairs & maintenance
- −$34,358
- − Management
- −$34,358
- − Depreciation
- −$145,425
- Taxable loss
- −$148,000
- Est. tax savings @ 24.0%
- +$35,520
- After-tax cash flow
- $-23,090/yr
For passive investors: Depreciation is non-cash, so a rental often shows a tax loss while cash-flowing — sheltering income. Rental losses are passive: they offset passive income freely, and up to $25,000/yr can offset ordinary (W-2) income if you actively participate and your MAGI is under $100k (phasing out to $0 by $150k); unused losses carry forward. On sale, claimed depreciation is recaptured at up to 25%, and gains may owe capital-gains tax (a 1031 exchange can defer both). Figures are a year-1 estimate at your 24.0% rate — not tax advice; consult a CPA.
Schools (NCES district)
- District
- Los Angeles Unified
- NCES district ID
- 0622710
- Math proficiency
- 29% ▼ -4.00%
- Reading proficiency
- 54% ▲ 10.00%
- Median HH income
- $50,403
- Composite
- 35.67/100
- National rank
- #4875
- State rank
- #223 of 517 in CA
Livability — Los Angeles
- Score
- 68/100
- State rank
- #273
- US rank
- #9237
Category grades
Schools grade is shown separately in the Schools card above.
Census & demographics
- Census place
- Los Angeles, CA
- County
- Los Angeles County · 9,444,647 people
- City population
- 3,838,149
- Metro
- Los Angeles-Long Beach-Anaheim, CA
- Population (ZIP)
- 94,830
- Household income
- $53,302
- Rent vs Own
- Severe rent burden
- 7490.0
Population outlook (Los Angeles County) Hauer SSP2
- Today (2025)
- 10,940,515 people
- By 2030
- 11,256,481 · +2.9%
- By 2040
- 11,729,929 · +7.2%
- By 2050
- 11,948,407 · +9.2%
- By 2075
- 11,818,114 · +8.0%
- By 2100
- 10,842,928 · -0.9%
Race, ethnicity, and origin ACS 2023
- Neighborhood character
- Predominantly Hispanic (67%)
- Race & ethnicity
- Hispanic / Latino 67% Black 29% Two or more races 23% White 1% Native American 1%
- Hispanic origin (detail)
- Mexican 39%
- Foreign-born
- 34% · Canada
- Languages at home
- 37% English-only · Spanish 62%
Political lean MEDSL · Los Angeles
- 2024 margin
- Solid D (+32.9) · D 64.8% · R 31.9% · Other 3.3%
- 2008→2024 swing
- -7.4pp toward R · 2008: 40.4pp · 2024: 32.9pp
- All cycles
- 2024: D+32.9 2020: D+44.2 2016: D+48.0 2012: D+40.0 2008: D+40.4
Not yet ingested
- Civics
- —
Market trends
- HPI YoY
- ▼ -691.99%
- Current HPI
- 467.9845
- Rent YoY
- ▼ -2.50%
- Metro
- Los Angeles-Long Beach-Anaheim, CA
- State GDP YoY
- ▲ 3.21%
- F500 in state
- 116
Industry mix (Fortune 500 HQ in CA)
| Industry | F500 HQs | Revenue |
|---|---|---|
| Technology | 27 | $1,492B |
|
||
| Financial Services | 3 | $174B |
|
||
| Retail | 3 | $44B |
|
||
| Insurance | 3 | $26B |
|
||
| Media / Entertainment | 2 | $115B |
|
||
| Pharmaceuticals / Biotech | 2 | $62B |
|
||
Price history
+1865.7% since first listed7 events — show timeline
- 2026-05-05 Listed $4,999,000 TheMLS
- 2022-10-26 Sold (MLS) $4,550,000 SDMLS
- 2022-08-31 Sold (Public Records) $4,550,000 Public Records
- 2022-03-20 Listed $4,595,000 SDMLS
- 2008-10-16 Sold (Public Records) $1,400,000 Public Records
- 1989-06-21 Sold (Public Records) $545,000 Public Records
- 1989-06-21 Sold (Public Records) $254,310 Public Records
Property tax history
+12.3%/yrLatest (2025): $58,321 · +1.2% YoY. Source: county tax records.
Cash-flow waterfall
monthlySold comps — $/sqft
last 12 mo · ≤1 miLoading sold comps…