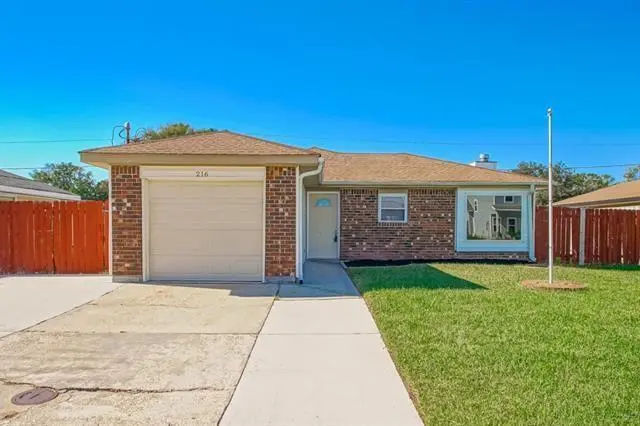
216 Dale Ave · Timberlane, LA
Flood risk 8/10 · Major
- FEMA flood zone
- X
- Chance of flooding over 30 yrs
- 0.6%
- Est. flood insurance / yr
- $507 – $1,088
Fire risk 1/10 · Minimal
- Est. fire insurance / yr
- $1,269 – $2,357
Heat risk 10/10 · Severe
- Hot days now (above 108°F)
- 7 days/yr
- Hot days in 30 yrs
- 22 days/yr
Wind risk 10/10 · Severe
- Chance of severe wind over 30 yrs
- 99.0%
Air-quality risk 2/10 · Minimal
- Unhealthy air days now
- 2 days/yr
- Unhealthy air days in 30 yrs
- 2 days/yr
Risk factors via First Street. Map © Google.
Why this score? — see what drove the D grade
The composite is a weighted blend of 9 inputs, each scored 0–100. Each bar is that input's sub-score; the figure is the points it added to the 100-point composite (weight × sub-score).
- Cash flow +12.7/30.0
- ARV discount +10.7/15.0
- Livability +3.9/5.0
- DSCR +3.8/10.0
- 1% rule +3.3/10.0
- Rent growth +2.5/5.0
- Schools +2.5/10.0
- Condition / age +2.5/5.0
- Appreciation +0.0/10.0
$239,900
🖨 Deal sheet (PDF) 📄 Offer letter ✓ Due diligence
Listing remarks MLS
4-Bedroom Home in the City of Gretna with Easy New Orleans Access Casa de 4 Habitaciones en la Ciudad de Gretna con Facil Acceso a Nueva Orleans This 4-bedroom, 2 full bath home is located in the city of Gretna and offers easy access to downtown New Orleans. The property features a comfortable living room, a small kitchen with everything you need, and a nice backyard--perfect for relaxing on cool days or enjoying a barbecue with family and friends. The home also includes a garage for added convenience. ?? Asking Price / Precio: $239,900 ?? Seller open to short-term Bond for Deed / Vendedor abierto a Bond for Deed a corto plazo ?? Local government programs may allow NO money down / Programas del gobierno local pueden permitir compra SIN pronto pago Call today for more information and to explore your options to own this beautiful home. ? Esta casa de 4 habitaciones y 2 banos completos esta ubicada en la ciudad de Gretna y cuenta con facil acceso al centro de Nueva Orleans. La propiedad ofrece una comoda sala, una cocina pequena pero completa, y un patio trasero agradable, ideal para parrilladas o momentos tranquilos al aire libre. Ademas, incluye garaje. ?? Llame hoy para mas informacion y descubra como puede convertirse en propietario de esta hermosa casa
Key facts
- Nice backyard
- 5,998 sq ft lot
- Garage
Tags
Property features AI
Exterior
- Parking: Garage (1 space)
- Utilities: Public water; Public sewer
- Home design: Single-story; Brick exterior; Slab foundation; Property in excellent condition
- Construction: Brick construction; Built on slab foundation
- Exterior features: City lot; Rectangular lot; Lot dimensions approximately 61 x 100
Interior
- Bathrooms: 2 full bathrooms
- Heating & cooling: Central heating; Central air conditioning
- Interior features: Wood-burning fireplace
- Laundry & utility: Washer hookup; Dryer hookup
Neighborhood map
What this means for you Summary
Snapshot
- This is a 4-bed/2.0-bath single-family listed at $240k.
Deal economics
- At list price, monthly cash flow is $-94 ($-1k/yr) — negative.
- To cash-flow at today's rent, offer at most $223k (6.9% below list).
- To meet the 1% rule (rent ≥ 1% of price), the offer needs to be $199k (17.1% below list).
- Recommended offer: $199k (17.1% below list) — sets the bar for 1% rule.
Location & tenants
- Location reads 78/100 on livability (#10 in LA, #2,662 nationally) — a middle-class / working-renter tenant base. Strengths: cost of living A+, housing A+, health & safety A+; Watch: amenities F, commute F.
- Jefferson Parish (suburban): math 24% / reading 34% proficiency, ranked #44 of 98 in LA (top 45%) — low school quality limits family demand, transient renter base, plan for 1-2y turnover; 70% free/reduced lunch — lower-income household profile, screen leases tightly.
- Zoned schools: Paul J. Solis Elementary School (math 35% / reading 35%, grade F, #280 of 646 statewide, top 44%, 746 students, 73% FRL); Gretna Middle School (math 9% / reading 24%, grade F, #177 of 218 statewide, top 82%, 574 students, 64% FRL); Helen Cox High School (math 6% / reading 22%, grade F, #228 of 265 statewide, top 86%, 904 students, 66% FRL) — zoned schools at 68% FRL track the district average.
- Market conditions: Rents soft (-0.2%/yr); 162 active listings in the ZIP; 23 comparable units currently listed for rent nearby; rentals at typical pace (median 25d on market — plan ~3-4 weeks tenant-placement turnaround); 518 units permitted in Jefferson Parish in 2024 (43 in 5+ unit buildings).
- This rent runs 40% of the median local income ($59k/yr) — at the standard rent-burdened threshold; future hikes will face affordability resistance.
Forward outlook
- Local home prices are declining (-3.0%/yr); year-one equity from $2k of loan paydown is wiped out by about $7k of value loss. Plan a longer hold.
Negotiation context
- It's been on market 15 days — a 2% lower offer ($236k) is reasonable based on typical stale-listing flexibility.
- 14 sale attempts since 9y ago with the ask held roughly flat each time — persistent listings suggest the price (not the market) is what's stuck; bring a comps-based counter.
Risks & watch-outs
- Watch-outs: flood insurance adds $66/mo.
- Climate carrying-cost: severe flood risk; severe wind risk, 99% chance of damaging wind over 30y; extreme-heat days projected 7→22/yr by 2055 (HVAC capex compounding) — expect insurance premiums to compound above CPI over the hold.
Questions for the listing agent
- What do current leases actually rent for vs. the listed asking? Can we see a recent rent roll and the last 12 months of T-12 income?
- What's the actual annual flood-insurance premium (NFIP or private), and is the property in a SFHA with mandatory coverage?
- Is there a deadline driving the sale (1031 exchange, divorce, estate, relocation)? That informs how much negotiation room exists.
- Schools are A-rated — typically a magnet for longer-tenancy family renters. What's the average tenant stay here, and is there a school-zone premium baked into asking?
- The area grade is low — what's the realistic commute time and amenity access for the typical tenant pool here? Any planned neighborhood developments (good or bad) we should know about?
- What's the average days-on-market for RENTAL listings here right now (not sales)? A rising rental-DOM trend means longer vacancies and softer asking-rent achievability than the comps imply.
- What's the recent tenant-quality profile in this submarket — average credit score on applications, eviction rate, late-payment / NSF rate, and stable-employment percentage? A property-management company in the area should have these aggregated.
- How much new for-sale + rental construction is in the pipeline within 1–3 miles? Heavy new supply typically softens prices + rents 12–24 months out; constrained supply supports both.
Investment metrics
- 1% rule
- 0.83% ✗
- Cap rate
- 6.16%
- Cash-on-cash
- -0.49%
- DSCR
- 0.98
- GRM
- 10.1
CMA / ARV
- ARV (median comp)
- $258,512
- List price
- $239,900
- Delta
- -7.16%
- Verdict
- FAIR
- Comps
- 20 within 1.0 mi
Show comp detail 12 sales within ~0.75 mi
| Address | Dist | Beds/Ba | Sqft | Sold | Price | $/sf | Match |
|---|---|---|---|---|---|---|---|
| 216 Dale Ave | 0.00mi | 4/2.0 | 1,330 (0%) | 13mo | $230,000 | $173 | 89 |
| 204 Dale Ave | 0.03mi | 3/2.0 (-1) | 1,311 (-1%) | 6mo | $235,000 | $179 | 86 |
| 248 Louise Ct | 0.07mi | 3/2.0 (-1) | 1,331 (+0%) | 11mo | $230,000 | $173 | 82 |
| 232 Louise Ct | 0.05mi | 3/2.0 (-1) | 1,295 (-3%) | 12mo | $223,400 | $173 | 78 |
| 245 Louise Ct | 0.09mi | 3/2.0 (-1) | 1,402 (+5%) | 11mo | $240,000 | $171 | 72 |
| 109 Warren St | 0.41mi | 3/2.0 (-1) | 1,350 (+2%) | 2mo | $235,000 | $174 | 72 |
| 2920 Surfwood Dr | 0.33mi | 3/2.0 (-1) | 1,368 (+3%) | 7mo | $202,890 | $148 | 69 |
| 356 Firethorn Dr | 0.45mi | 3/2.0 (-1) | 1,242 (-7%) | 4mo | $218,200 | $176 | 60 |
| 428 Bannerwood Dr | 0.43mi | 4/2.0 | 1,450 (+9%) | 7mo | $253,000 | $174 | 59 |
| 303 Planters Canal Rd | 0.63mi | 3/2.0 (-1) | 1,416 (+6%) | 5mo | $299,000 | $211 | 51 |
| 612 Clinebrook Dr | 0.65mi | 4/1.0 | 1,379 (+4%) | 12mo | $175,900 | $128 | 49 |
| 660 Grovewood Dr | 0.71mi | 3/2.0 (-1) | 1,450 (+9%) | 1mo | $212,000 | $146 | 46 |
Match score weights: distance 35% · size 25% · config 20% · recency 20%. Top-matched comps best support the ARV.
Projected returns pro-forma
-3.0% appreciation · 0.0% rent growth · sell at horizon
- IRR
- -22.5%
- Equity multiple
- 0.25×
- Total profit
- $-50,644
- Equity at exit
- $35,770
- IRR
- -26.9%
- Equity multiple
- -0.10×
- Total profit
- $-74,176
- Equity at exit
- $20,742
Cash invested: $67,172 (down + closing). Projections, not guarantees.
Landlord ↔ Tenant lean methodology
- Overall (STATE)
- 90 Strongly Landlord-Friendly
- State Louisiana
- 90 Strongly Landlord-Friendly · R+12
- County
- — inherits STATE
- City
- — inherits STATE
ZIP-level market 70056
- Rents YoY
- -0.2%
- Active inventory
- 162
- Price-to-rent
- 10.1×
Monthly cashflow live
- Estimated rent
- $1,988 high interval (Pro) →
- Mortgage (P&I)
- −$1,258
- Tax from tax record
- −$240 /mo · $2,880/yr
- Insurance
- −$100
- Flood insurance flood zone
- −$66 /mo · $798/yr
- HOA
- −$0
- Vacancy / Maint / Mgmt
- −$418
- Net cashflow
- $-94
Break-even live
Sensitivity live
| Price | -10% $42 | -5% $-26 | +0% $-94 | +5% $-162 | +10% $-230 |
|---|---|---|---|---|---|
| Rent | -10% $-251 | -5% $-172 | +0% $-94 | +5% $-15 | +10% $63 |
| Rate | -1.0pp $27 | -0.5pp $-33 | base $-94 | +0.5pp $-156 | +1.0pp $-219 |
UW: 25.0% down · 7.5% · 30yr · 1.5% tax · 5.0% vac · 8.0% maint · 8.0% mgmt
Financing live
Cash to close
- Down payment
- $59,975
- Closing costs
- $7,197
- Reserves months
- —
- Total cash needed
- —
Loan-product check · same deal, 3 products live
Conventional
25% down · 7.5% · 30yr
- Down + closing
- —
- Monthly P&I
- —
- Monthly cashflow
- —
- DSCR
- —
- Eligible?
- —
Personal DTI + credit; lowest rate.
DSCR
20% down · 8.5% · 30yr
- Down + closing
- —
- Monthly P&I
- —
- Monthly cashflow
- —
- DSCR
- —
- Eligible?
- —
No personal income docs; deal must DSCR.
Hard money
10% down · 12.0% · 12mo
- Down + closing
- —
- Monthly P&I
- —
- Monthly cashflow
- —
- DSCR
- —
- Eligible?
- —
Short-term bridge; refi at stabilization.
Rent comps 23 comps
| Address | Beds | Baths | Sqft | Rent | $/sqft | DOM | Units | Dist |
|---|---|---|---|---|---|---|---|---|
| 528 Grovewood Dr Gretna, LA | 4.0 | 2.0 | 1525 | $2,200 | $1.44 | 25d | 1 | 0.47mi |
| 119 Planters Canal Rd Belle Chasse, LA | 4.0 | 3.0 | 1840 | $2,195 | $1.19 | 45d | 1 | 0.50mi |
| 119 Planters Canal Rd Belle Chasse, LA | 4.0 | 3.0 | 1840 | $2,195 | $1.19 | 25d | 1 | 0.50mi |
| 520 Wall Blvd Gretna, LA | 1.0–3.0 | 1.0–2.0 | 1000 | $1,545 | $1.54 | 45d | 9 | 0.76mi |
| 2727 Ridgefield Rd Gretna, LA | 3.0 | 2.0 | 1700 | $1,950 | $1.15 | 16d | 1 | 0.91mi |
| 937 E Monterey Ct Apt D Terrytown, LA | 4.0 | 2.0 | 1500 | $1,500 | $1.00 | 25d | 1 | 0.98mi |
| 937 E Monterey Ct Apt B Terrytown, LA | 3.0 | 2.0 | 1500 | $1,300 | $0.87 | 25d | 1 | 0.98mi |
| 917 Monterey Ct S Unit b Gretna, LA | 3.0 | 2.0 | 1500 | $1,500 | $1.00 | 45d | 1 | 1.00mi |
| 110 P St Unit B Belle Chasse, LA | 3.0 | 2.0 | 1467 | $2,800 | $1.91 | 3d | 1 | 1.01mi |
| 916 E Monterey Ct Unit A Terrytown, LA | 3.0 | 2.0 | 1400 | $1,600 | $1.14 | 45d | 1 | 1.04mi |
| 1401 Drake Ln Gretna, LA | 3.0 | 2.0 | 1296 | $2,150 | $1.66 | 25d | 1 | 1.07mi |
| 3251 Wall Blvd Gretna, LA | 1.0–3.0 | 1.0–2.0 | 1174 | $2,500 | $2.13 | 3d | 1 | 1.08mi |
| 829 Bellemeade Blvd Gretna, LA | 4.0 | 2.0 | 1805 | $2,400 | $1.33 | 45d | 1 | 1.11mi |
| 2350 Park Place Dr Gretna, LA | 1.0–3.0 | 1.0–2.0 | 1000 | $1,525 | $1.52 | 45d | 5 | 1.24mi |
| 2424 Park Place Dr Gretna, LA | 3.0 | 2.0 | 1550 | $2,200 | $1.42 | 23d | 1 | 1.26mi |
| 2337 Park Place Dr Gretna, LA | 3.0 | 2.5 | 1800 | $1,650 | $0.92 | 45d | 1 | 1.27mi |
| 2448 Oxford Pl Gretna, LA | 3.0 | 2.5 | 1514 | $1,600 | $1.06 | 25d | 1 | 1.33mi |
| 110 Vista Dr Belle Chasse, LA | 3.0 | 1.5 | 1217 | $1,800 | $1.48 | 5d | 1 | 1.38mi |
| 805 Terry Pkwy Terrytown, LA | 3.0 | 2.0 | 1782 | $2,050 | $1.15 | 6d | 1 | 1.39mi |
| 805 Terry Pkwy Terrytown, LA | 3.0 | 2.0 | 1782 | $2,050 | $1.15 | 4d | 1 | 1.39mi |
| 109 Vista Dr Belle Chasse, LA | 3.0 | 1.5 | 910 | $1,900 | $2.09 | 25d | 1 | 1.41mi |
| 740 Oakwood Dr Gretna, LA | 4.0 | 2.0 | 1290 | $2,200 | $1.71 | 45d | 1 | 1.41mi |
| 113 J St Unit A Belle Chasse, LA | 3.0 | 2.0 | 1090 | $1,400 | $1.28 | 45d | 1 | 1.44mi |
Listing history 44 events
-
2026-06-21days on market $239,900 Active 15 DOM
-
2026-06-18days on market $239,900 Active 12 DOM
-
2026-06-17days on market $239,900 Active 11 DOM
-
2026-06-16days on market $239,900 Active 10 DOM
-
2026-06-15days on market $239,900 Active 9 DOM
-
2026-06-13days on market $239,900 Active 7 DOM
-
2026-06-10days on market $239,900 Active 4 DOM
-
2026-06-09days on market $239,900 Active 3 DOM
-
2026-06-08days on market $239,900 Active 2 DOM
-
2026-06-07pricedays on market $239,900 Active 1 DOM
-
2026-06-01days on market $239,999 Active 146 DOM
-
2026-05-31days on market $239,999 Active 145 DOM
-
2026-01-01$239,999 Active 1349-char remark
-
2026-01-01$239,999 Active 1274-char remark
-
2025-05-28soldstatus $230,000 Closed
-
2025-05-13historical Active Under Contract
-
2025-03-25price $229,000
-
2025-03-25price $229,000
-
2025-02-28price $239,000
-
2025-02-28price $239,000
-
2025-01-01price $244,000
-
2025-01-01price $244,000
-
2024-12-11status Active
-
2024-12-04status Pending
-
2024-11-21$245,000 Active
-
2024-11-21$245,000 Active
-
2023-10-24historical $2,000
-
2023-10-22$2,000
-
2023-10-05historical $2,000
-
2023-09-22$2,000
-
2023-08-09soldstatus $227,900
-
2023-08-07soldstatus $227,900 Closed
-
2023-07-05historical Active Under Contract
-
2023-06-23$239,900 Active
-
2023-06-23$239,900
-
2021-01-25soldstatus $186,000
-
2021-01-22soldstatus $186,000 Closed
-
2020-12-21status Pending
-
2020-12-18$179,000
-
2020-12-18$179,000 Active
-
2017-11-01soldstatus $48,000 Sold
-
2017-07-31status Under Contract
-
2017-07-21$51,940 Active
-
2017-07-20$51,940
ⓘ Source: listings_history table (triggers on properties + properties_extension) + one-shot
backfill from property_details.listing_events for pre-trigger history.
Tax reassessment forecast LA · Resets to sale price
- Current annual tax
- $2,880 · $240/mo
- Projected year-2 tax
- $2,880 · $240/mo
- Expected delta
- $0/yr ($0/mo · 0.0%)
ⓘ Screening estimate from a state-policy table — verify with the county assessor before closing.
Climate risk First Street
- Flood 8/10 Severe FEMA zone X · 60% chance over 30 yrs
- Wildfire 1/10 Low
- Heat 10/10 Extreme 7 d/yr ≥108°F today · 22 d/yr by 30 yrs out
- Wind 10/10 Extreme 99% chance of damaging wind over 30 yrs
- Air quality 2/10 Low 2 unhealthy d/yr today · 2 by 30 yrs out
Nearby sold comps map
Loading sold comps map…
Walkable amenities ~0.75 mi
Loading nearby amenities…
Taxation est. · year 1
- Rental income
- $23,858
- − Mortgage interest
- −$13,438
- − Property taxes
- −$2,880
- − Insurance
- −$1,997
- − Repairs & maintenance
- −$1,909
- − Management
- −$1,909
- − Depreciation
- −$6,979
- Taxable loss
- −$5,254
- Est. tax savings @ 24.0%
- +$1,261
- After-tax cash flow
- $135/yr
For passive investors: Depreciation is non-cash, so a rental often shows a tax loss while cash-flowing — sheltering income. Rental losses are passive: they offset passive income freely, and up to $25,000/yr can offset ordinary (W-2) income if you actively participate and your MAGI is under $100k (phasing out to $0 by $150k); unused losses carry forward. On sale, claimed depreciation is recaptured at up to 25%, and gains may owe capital-gains tax (a 1031 exchange can defer both). Figures are a year-1 estimate at your 24.0% rate — not tax advice; consult a CPA.
Schools (NCES district)
- District
- Jefferson Parish
- NCES district ID
- 2200840
- Math proficiency
- 24% ▼ -36.00%
- Reading proficiency
- 34% ▼ -30.00%
- Median HH income
- $48,421
- Composite
- 25.19/100
- National rank
- #7511
- State rank
- #44 of 98 in LA
Livability — Timberlane
- Score
- 78/100
- State rank
- #10
- US rank
- #2662
Category grades
Schools grade is shown separately in the Schools card above.
Census & demographics
- Census place
- Timberlane, LA
- County
- Jefferson Parish · 426,999 people
- Metro
- New Orleans-Metairie, LA
- Population (ZIP)
- 40,348
- Household income
- $59,027
- Rent vs Own
- Severe rent burden
- 1623.0
Population outlook (Jefferson County) Hauer SSP2
- Today (2025)
- 451,696 people
- By 2030
- 455,451 · +0.8%
- By 2040
- 458,308 · +1.5%
- By 2050
- 461,031 · +2.1%
- By 2075
- 476,351 · +5.5%
- By 2100
- 499,377 · +10.6%
Race, ethnicity, and origin ACS 2023
- Neighborhood character
- Highly diverse neighborhood (Simpson 0.71)
- Race & ethnicity
- Black 34% White 32% Hispanic / Latino 26% Two or more races 9% Asian 4%
- Hispanic origin (detail)
- Mexican 3% Dominican 3%
- Common ancestry
- Lithuanian 5% Italian 2% Hispanic 2%
- Foreign-born
- 20% · Canada, Vietnam
- Languages at home
- 67% English-only · Spanish 22% Arabic 5% French/Haitian/Cajun 2%
Political lean MEDSL · Jefferson
- 2024 margin
- R (+12.9) · D 42.5% · R 55.5% · Other 2.1%
- 2008→2024 swing
- +13.6pp toward D · 2008: -26.6pp · 2024: -12.9pp
- All cycles
- 2024: R+12.9 2020: R+11.1 2016: R+14.8 2012: R+18.4 2008: R+26.6
Not yet ingested
- Civics
- —
Market trends
- HPI YoY
- ▼ -100.20%
- Current HPI
- 165.1579
- Rent YoY
- ▼ -0.16%
- Metro
- New Orleans-Metairie, LA
- State GDP YoY
- ▲ 3.29%
- F500 in state
- 10
Industry mix (Fortune 500 HQ in LA)
| Industry | F500 HQs | Revenue |
|---|---|---|
| Telecommunications | 2 | $23B |
|
||
| Utilities | 1 | $12B |
|
||
| Wholesale / Distribution | 1 | $5B |
|
||
| Advertising | 1 | $2B |
|
||
Price history
+361.9% since first listed33 events — show timeline
- 2026-06-06 Listed $239,900 GSREIN
- 2026-06-06 Listed $239,900 AcadianaMLS
- 2026-01-01 Listed $239,999 AcadianaMLS
- 2025-05-28 Sold (MLS) $230,000 GSREIN
- 2025-05-13 Contingent — GSREIN
- 2025-03-25 Price Changed $229,000 AcadianaMLS
- 2025-03-25 Price Changed $229,000 GSREIN
- 2025-02-28 Price Changed $239,000 AcadianaMLS
- 2025-02-28 Price Changed $239,000 GSREIN
- 2025-01-01 Price Changed $244,000 AcadianaMLS
- 2025-01-01 Price Changed $244,000 GSREIN
- 2024-12-11 Relisted — GSREIN
- 2024-12-04 Pending — GSREIN
- 2024-11-21 Listed $245,000 AcadianaMLS
- 2024-11-21 Listed $245,000 GSREIN
- 2023-10-24 Rental Removed $2,000 LISTANZA
- 2023-10-22 Listed for Rent $2,000 LISTANZA
- 2023-10-05 Rental Removed $2,000 GSREIN
- 2023-09-22 Listed for Rent $2,000 GSREIN
- 2023-08-09 Sold (Public Records) $227,900 Public Records
- 2023-08-07 Sold (MLS) $227,900 GSREIN
- 2023-07-05 Contingent — GSREIN
- 2023-06-23 Listed $239,900 GSREIN
- 2023-06-23 Listed $239,900 AcadianaMLS
- 2021-01-25 Sold (Public Records) $186,000 Public Records
- 2021-01-22 Sold (MLS) $186,000 GSREIN
- 2020-12-21 Pending — GSREIN
- 2020-12-18 Listed $179,000 AcadianaMLS
- 2020-12-18 Listed $179,000 GSREIN
- 2017-11-01 Sold (MLS) $48,000 GSREIN
- 2017-07-31 Pending — GSREIN
- 2017-07-21 Listed $51,940 GSREIN
- 2017-07-20 Listed $51,940 AcadianaMLS
Property tax history
+8.9%/yrLatest (2025): $2,880 · +0.3% YoY. Source: county tax records.
Cash-flow waterfall
monthlySold comps — $/sqft
last 12 mo · ≤1 miLoading sold comps…