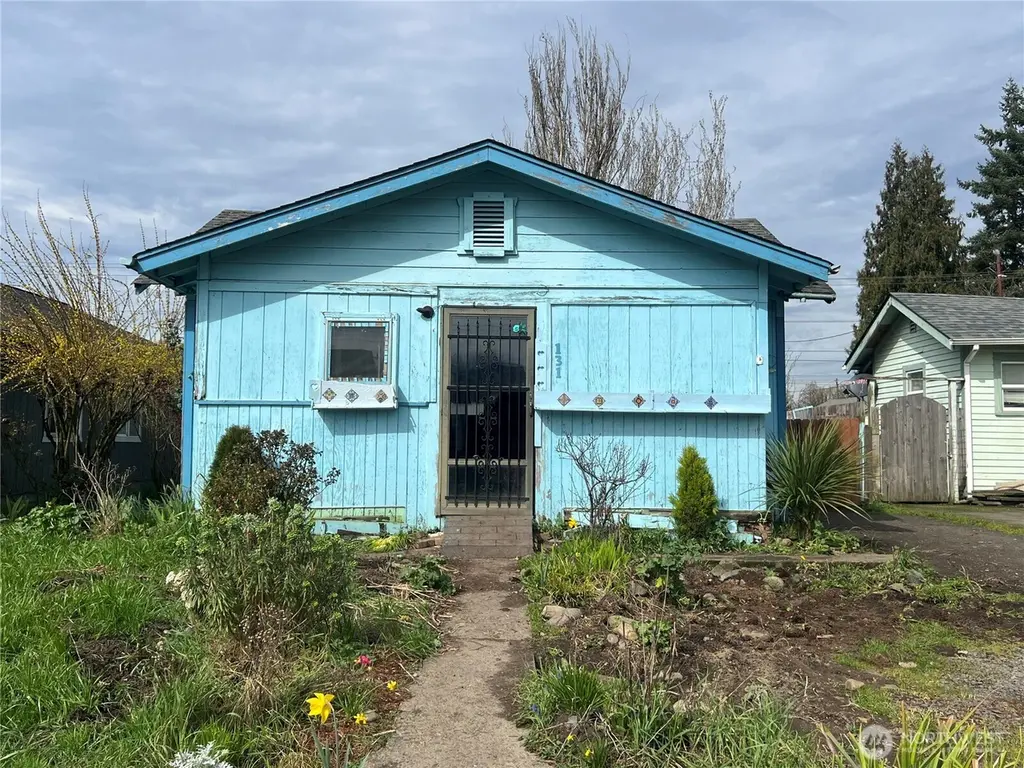
131 17th Ave · Longview, WA
Flood risk 1/10 · Minimal
- FEMA flood zone
- X
- Chance of flooding over 30 yrs
- 0.0%
- Est. flood insurance / yr
- $507 – $1,088
Fire risk 1/10 · Minimal
- Est. fire insurance / yr
- $604 – $1,122
Heat risk 3/10 · Minor
- Hot days now (above 89°F)
- 7 days/yr
- Hot days in 30 yrs
- 14 days/yr
Wind risk 1/10 · Minimal
- Chance of severe wind over 30 yrs
- —
Air-quality risk 7/10 · Major
- Unhealthy air days now
- 8 days/yr
- Unhealthy air days in 30 yrs
- 9 days/yr
Risk factors via First Street. Map © Google.
Why this score? — see what drove the C grade
The composite is a weighted blend of 9 inputs, each scored 0–100. Each bar is that input's sub-score; the figure is the points it added to the 100-point composite (weight × sub-score).
- Cash flow +18.7/30.0
- ARV discount +15.0/15.0
- DSCR +5.9/10.0
- 1% rule +4.7/10.0
- Schools +4.0/10.0
- Livability +3.6/5.0
- Rent growth +3.1/5.0
- Condition / age +2.5/5.0
- Appreciation +0.0/10.0
$135,000
🖨 Deal sheet 📄 Offer letter ✓ Due diligence
Listing remarks
INVESTOR ALERT! 2 Bed 1 Bath 660 Sq Ft Home, ready for a Beautiful Remodel! Most of the Demolition and Clearing of the home has been Completed. This property would make a great "Fix and Flip" or "Long Term Rental Property". The lot is 4800 Sq Ft and is partially fenced. There was a detached garage that has been removed leaving a usable cement pad. In the back yard there is Plenty of Space for RV Parking, a New Garage, Possible ADU, ect. .. .. This property is Zoned "R4" which could allow for Multi-Family structures or potential "ADU". Buyer to verify "Land Use Details". For land use questions call the City of Longview for potential land use
Key facts
- 4,800 sq ft lot
- Garage
- Built 1925
Neighborhood map
What this means for you Summary
Snapshot
- This is a 2-bed/1.0-bath single-family listed at $135k.
Deal economics
- At list price, monthly cash flow is $133 ($2k/yr) — positive.
- The deal already cash-flows at list — no discount required.
- To meet the 1% rule (rent ≥ 1% of price), the offer needs to be $131k (3.2% below list).
- Recommended offer: $123k (9.0% below list) — sets the bar for market timing.
- Cap rate 7.5% vs local median 3.0% in Longview — top-decile yield for the area; either an underpriced asset or a hidden risk that comps aren't pricing in. Stress-test before assuming the spread holds.
Location & tenants
- Location reads 71/100 on livability (#228 in WA) — a middle-class / working-renter tenant base. Strengths: housing A+, health & safety A+, cost of living A-; Watch: crime C-, employment D+, commute F.
- Longview School District (urban): math 40% / reading 51% proficiency, ranked #185 of 291 in WA (top 64%) — families likely to look elsewhere, expect single-tenant / working-renter base with shorter leases.
- Market conditions: Rents rising (+2.6%/yr); 356 active listings in the ZIP; 1 comparable units currently listed for rent nearby; 348 units permitted in Cowlitz County in 2024 (40 in 5+ unit buildings).
Forward outlook
- Local home prices are declining (-3.0%/yr); year-one equity from $933 of loan paydown is wiped out by about $4k of value loss. Plan a longer hold.
- Cowlitz County population projected to shrink 8% by 2050 — rents likely to lag national; underwrite the cash flow, not the appreciation.
Negotiation context
- It's been on market 94 days — a 9% lower offer ($123k) is reasonable based on typical stale-listing flexibility.
- Current owner paid $8k; list at $135k implies a 1588% gain — meaningful room to come down on a strong offer.
Risks & watch-outs
- Watch-outs: built in 1925 — expect roof / HVAC / electrical / plumbing capex.
Questions for the listing agent
- It's been on market 94 days. Have you received any prior offers? Is the seller open to a 9% concession, seller financing, or rate buy-down credit?
- Built in 1925 — when were the roof, HVAC, electrical panel, plumbing, and water heater last replaced?
- Why hasn't it sold? Are there any deal-killer items the seller is aware of (foundation, flood, title, zoning, code violations)?
- Is there a deadline driving the sale (1031 exchange, divorce, estate, relocation)? That informs how much negotiation room exists.
- What's the average days-on-market for RENTAL listings here right now (not sales)? A rising rental-DOM trend means longer vacancies and softer asking-rent achievability than the comps imply.
- What's the recent tenant-quality profile in this submarket — average credit score on applications, eviction rate, late-payment / NSF rate, and stable-employment percentage? A property-management company in the area should have these aggregated.
- How much new for-sale + rental construction is in the pipeline within 1–3 miles? Heavy new supply typically softens prices + rents 12–24 months out; constrained supply supports both.
Investment metrics
- 1% rule
- 0.97% ✗
- Cap rate
- 7.47%
- Cash-on-cash
- 4.22%
- DSCR
- 1.19
- GRM
- 8.6
CMA / ARV
- ARV (median comp)
- $247,697
- List price
- $135,000
- Delta
- -45.50%
- Verdict
- UNDERPRICED
- Comps
- 20 within 1.0 mi
Show comp detail 12 sales within ~0.75 mi
| Address | Dist | Beds/Ba | Sqft | Sold | Price | $/sf | Match |
|---|---|---|---|---|---|---|---|
| 234 19th Ave | 0.11mi | 2/1.0 | 624 (-6%) | 5mo | $199,900 | $320 | 82 |
| 256 19th Ave | 0.13mi | 2/1.0 | 696 (+6%) | 10mo | $252,000 | $362 | 77 |
| 340 16th Ave | 0.28mi | 2/1.0 | 624 (-6%) | 10mo | $242,000 | $388 | 70 |
| 288 18th Ave | 0.17mi | 2/1.0 | 718 (+9%) | 10mo | $255,000 | $355 | 70 |
| 230 20th Ave | 0.16mi | 2/1.0 | 708 (+7%) | 15mo | $240,000 | $339 | 68 |
| 229 23rd Ave | 0.36mi | 2/1.0 | 692 (+5%) | 9mo | $233,000 | $337 | 68 |
| 263 17th Ave | 0.11mi | 2/1.0 | 572 (-13%) | 13mo | $319,000 | $558 | 62 |
| 217 25th Ave | 0.47mi | 2/1.0 | 724 (+10%) | 10mo | $199,000 | $275 | 54 |
| 336 20th Ave | 0.30mi | 2/1.0 | 738 (+12%) | 16mo | $260,000 | $352 | 53 |
| 264 27th Ave | 0.59mi | 2/1.0 | 720 (+9%) | 13mo | $261,000 | $363 | 46 |
| 249 27th Ave | 0.60mi | 2/1.0 | 744 (+13%) | 9mo | $267,000 | $359 | 43 |
| 262 27th Ave | 0.59mi | 2/1.0 | 744 (+13%) | 15mo | $265,000 | $356 | 39 |
Match score weights: distance 35% · size 25% · config 20% · recency 20%. Top-matched comps best support the ARV.
Projected returns pro-forma
-3.0% appreciation · 2.59% rent growth · sell at horizon
- IRR
- -10.2%
- Equity multiple
- 0.63×
- Total profit
- $-13,945
- Equity at exit
- $20,129
- IRR
- -1.3%
- Equity multiple
- 0.91×
- Total profit
- $-3,428
- Equity at exit
- $11,672
Cash invested: $37,800 (down + closing). Projections, not guarantees.
Landlord ↔ Tenant lean methodology
- Overall (STATE)
- 28 Tenant-Leaning
- State Washington
- 28 Tenant-Leaning · D+8
- County
- — inherits STATE
- City
- — inherits STATE
ZIP-level market 98632
- Rents YoY
- 2.6%
- Active inventory
- 356
- Price-to-rent
- 8.6×
Monthly cashflow live
- Estimated rent
- $1,307 medium interval (Pro) →
- Mortgage (P&I)
- −$708
- Tax from tax record
- −$135 /mo · $1,621/yr
- Insurance
- −$56
- HOA
- −$0
- Vacancy / Maint / Mgmt
- −$274
- Net cashflow
- $133
Break-even live
UW: 25.0% down · 7.5% · 30yr · 1.5% tax · 5.0% vac · 8.0% maint · 8.0% mgmt
Financing live
Cash to close
- Down payment
- $33,750
- Closing costs
- $4,050
- Reserves months
- —
- Total cash needed
- —
Loan-product check · same deal, 3 products live
Conventional
25% down · 7.5% · 30yr
- Down + closing
- —
- Monthly P&I
- —
- Monthly cashflow
- —
- DSCR
- —
- Eligible?
- —
Personal DTI + credit; lowest rate.
DSCR
20% down · 8.5% · 30yr
- Down + closing
- —
- Monthly P&I
- —
- Monthly cashflow
- —
- DSCR
- —
- Eligible?
- —
No personal income docs; deal must DSCR.
Hard money
10% down · 12.0% · 12mo
- Down + closing
- —
- Monthly P&I
- —
- Monthly cashflow
- —
- DSCR
- —
- Eligible?
- —
Short-term bridge; refi at stabilization.
Rent comps 1 comps
| Address | Beds | Baths | Sqft | Rent | $/sqft | DOM | Units | Dist |
|---|---|---|---|---|---|---|---|---|
| 944 33rd Ave Longview, WA | 2.0 | 1.0 | 754 | $1,275 | $1.69 | 24d | 2 | 1.34mi |
Listing history 20 events
-
2026-06-19days on market $135,000 Active 94 DOM
-
2026-06-18days on market $135,000 Active 93 DOM
-
2026-06-17days on market $135,000 Active 92 DOM
-
2026-06-16days on market $135,000 Active 91 DOM
-
2026-06-15days on market $135,000 Active 90 DOM
-
2026-06-14days on market $135,000 Active 88 DOM
-
2026-06-13days on market $135,000 Active 87 DOM
-
2026-06-10days on market $135,000 Active 85 DOM
-
2026-06-09days on market $135,000 Active 84 DOM
-
2026-06-08days on market $135,000 Active 83 DOM
-
2026-06-07days on market $135,000 Active 82 DOM
-
2026-06-05days on market $135,000 Active 79 DOM
-
2026-06-02days on market $135,000 Active 77 DOM
-
2026-06-01days on market $135,000 Active 76 DOM
-
2026-05-31days on market $135,000 Active 75 DOM
-
2026-05-30days on market $135,000 Active 74 DOM
-
2026-05-19price $135,000
-
2026-05-12price $150,000
-
2026-03-17$155,000 Active
-
1996-03-18soldstatus $8,000
ⓘ Source: listings_history table (triggers on properties + properties_extension) + one-shot
backfill from property_details.listing_events for pre-trigger history.
Tax reassessment forecast WA · Resets to sale price
- Current annual tax
- $1,621 · $135/mo
- Projected year-2 tax
- $1,621 · $135/mo
- Expected delta
- $0/yr ($0/mo · 0.0%)
ⓘ Screening estimate from a state-policy table — verify with the county assessor before closing.
Climate risk First Street
- Flood 1/10 Low FEMA zone X · 0% chance over 30 yrs
- Wildfire 1/10 Low
- Heat 3/10 Moderate 7 d/yr ≥89°F today · 14 d/yr by 30 yrs out
- Wind 1/10 Low
- Air quality 7/10 Severe 8 unhealthy d/yr today · 9 by 30 yrs out
Nearby sold comps map
Loading sold comps map…
Walkable amenities ~0.75 mi
Loading nearby amenities…
Taxation est. · year 1
- Rental income
- $15,680
- − Mortgage interest
- −$7,562
- − Property taxes
- −$1,621
- − Insurance
- −$675
- − Repairs & maintenance
- −$1,254
- − Management
- −$1,254
- − Depreciation
- −$3,927
- Taxable loss
- −$614
- Est. tax savings @ 24.0%
- +$147
- After-tax cash flow
- $1,743/yr
For passive investors: Depreciation is non-cash, so a rental often shows a tax loss while cash-flowing — sheltering income. Rental losses are passive: they offset passive income freely, and up to $25,000/yr can offset ordinary (W-2) income if you actively participate and your MAGI is under $100k (phasing out to $0 by $150k); unused losses carry forward. On sale, claimed depreciation is recaptured at up to 25%, and gains may owe capital-gains tax (a 1031 exchange can defer both). Figures are a year-1 estimate at your 24.0% rate — not tax advice; consult a CPA.
Schools (NCES district)
- District
- Longview School District
- NCES district ID
- 5304470
- Math proficiency
- 40% ▲ 1.00%
- Reading proficiency
- 51% ▲ 3.00%
- Median HH income
- $41,324
- Composite
- 40.41/100
- National rank
- #7732
- State rank
- #185 of 291 in WA
Livability — Longview
- Score
- 71/100
- State rank
- #228
- US rank
- #6972
Category grades
Schools grade is shown separately in the Schools card above.
Census & demographics
- Census place
- Longview, WA
- County
- Cowlitz County · 77,527 people
- City population
- 50,635
- Metro
- Longview, WA
- Population (ZIP)
- 50,635
- Household income
- $66,305
- Rent vs Own
- Severe rent burden
- 2224.0
Population outlook (Cowlitz County) Hauer SSP2
- Today (2025)
- 104,780 people
- By 2030
- 103,980 · -0.8%
- By 2040
- 100,769 · -3.8%
- By 2050
- 96,685 · -7.7%
- By 2075
- 86,454 · -17.5%
- By 2100
- 74,052 · -29.3%
Race, ethnicity, and origin ACS 2023
- Neighborhood character
- Predominantly White (78%)
- Race & ethnicity
- White 78% Hispanic / Latino 12% Two or more races 11% Asian 2% Native American 1%
- Hispanic origin (detail)
- Mexican 10%
- Common ancestry
- Portuguese 5% Lithuanian 3% Italian 3%
- Foreign-born
- 4% · Canada, Vietnam
- Languages at home
- 91% English-only · Spanish 7% Other Asian/Pacific 1%
Political lean MEDSL · Cowlitz
- 2024 margin
- R (+19.9) · D 38.7% · R 58.6% · Other 2.7%
- 2008→2024 swing
- -31.1pp toward R · 2008: 11.2pp · 2024: -19.9pp
- All cycles
- 2024: R+19.9 2020: R+17.4 2016: R+13.7 2012: D+4.4 2008: D+11.2
Not yet ingested
- Civics
- —
Market trends
- HPI YoY
- ▼ -479.09%
- Current HPI
- 230.8501
- Rent YoY
- ▲ 2.59%
- Metro
- Longview, WA
- State GDP YoY
- ▲ 4.65%
- F500 in state
- 22
Industry mix (Fortune 500 HQ in WA)
| Industry | F500 HQs | Revenue |
|---|---|---|
| Retail | 2 | $269B |
|
||
| Technology / Retail | 1 | $638B |
|
||
| Technology | 1 | $245B |
|
||
| Telecommunications | 1 | $38B |
|
||
| Food / Beverage | 1 | $36B |
|
||
| Automotive / Trucks | 1 | $34B |
|
||
Price history
+1587.5% since first listed4 events — show timeline
- 2026-05-19 Price Changed $135,000 NWMLS as Distributed by MLS Grid
- 2026-05-12 Price Changed $150,000 NWMLS as Distributed by MLS Grid
- 2026-03-17 Listed $155,000 NWMLS as Distributed by MLS Grid
- 1996-03-18 Sold (Public Records) $8,000 Public Records
Property tax history
+25.8%/yrLatest (2026): $1,621 · +3.2% YoY. Source: county tax records.
Cash-flow waterfall
monthlySold comps — $/sqft
last 12 mo · ≤1 miLoading sold comps…