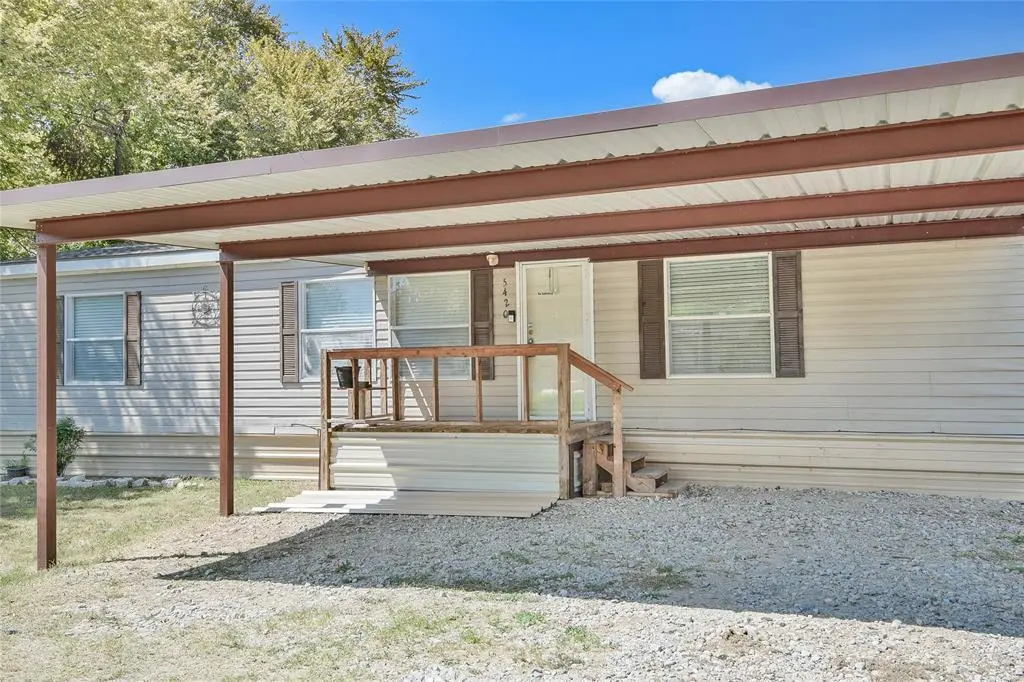
5420 Water View Dr · Oak Trail Shores, TX
Flood risk 7/10 · Major
- FEMA flood zone
- X (shaded)
- Chance of flooding over 30 yrs
- 0.77%
- Est. flood insurance / yr
- $507 – $1,088
Fire risk 5/10 · Moderate
- Est. fire insurance / yr
- $1,222 – $2,270
Heat risk 7/10 · Major
- Hot days now (above 108°F)
- 7 days/yr
- Hot days in 30 yrs
- 23 days/yr
Wind risk 6/10 · Moderate
- Chance of severe wind over 30 yrs
- 27.0%
Air-quality risk 2/10 · Minimal
- Unhealthy air days now
- 1 days/yr
- Unhealthy air days in 30 yrs
- 2 days/yr
Risk factors via First Street. Map © Google.
Why this score? — see what drove the B grade
The composite is a weighted blend of 9 inputs, each scored 0–100. Each bar is that input's sub-score; the figure is the points it added to the 100-point composite (weight × sub-score).
- Cash flow +27.4/30.0
- ARV discount +15.0/15.0
- DSCR +9.6/10.0
- 1% rule +6.7/10.0
- Schools +4.0/10.0
- Livability +2.9/5.0
- Rent growth +2.8/5.0
- Condition / age +2.5/5.0
- Appreciation +0.0/10.0
$135,000
🖨 Deal sheet 📄 Offer letter ✓ Due diligence
Listing remarks MLS
Updated and affordable 3 bedroom 2 bath with lake view and lake access!!! Open Concept!! Light and Bright!! Split Bedrooms!! All bedrooms have walk-in closets!!! Community pool, community playground, community lake access for fishing, and a community boat ramp!!!! Roof replaced 2019. HVAC replaced Fall 2018. Location is convenient to Weatherford and Granbury. This is a must see!!
Key facts
- Large living area
- Open concept
- Roomy kitchen
Tags
Property features AI
Finance
- Other: Deed restrictions; Possession at closing/funding
- Financial info: Listing accepts Cash, Conventional, FHA, and VA financing
- HOA & community: Mandatory association (Arrowhead Shores Owners Assoc); Annual association fee $50; Association fee includes full use of facilities
Exterior
- Parking: Attached carport; 2 carport spaces (covered)
- Security: Smoke detector(s)
- Utilities: Septic system; No municipal utility district
- Home design: Residential mobile home; Single-story; Not attached to another property; Year built 2004
- Construction: Aluminum siding; Composition and other roof types
- Exterior features: Storage; Interior lot; Chain link and wood fencing; Easements for utilities
Interior
- Kitchen: Eat-in kitchen with built-in cabinets and pantry; Dishwasher; Electric range; Microwave; Refrigerator
- Bedrooms: 3 bedrooms (all on the main level); Primary bedroom with ensuite bath, garden tub, separate shower, dual sinks, and walk-in closet; Other bedrooms feature split-bedroom layout and walk-in closets
- Flooring: Carpet
- Bathrooms: 2 full bathrooms
- Heating & cooling: Central heating (electric); Central air conditioning (electric); Ceiling fan(s)
- Interior features: High-speed internet available; 7 total rooms; One living area; One dining area; One level (single story)
- Laundry & utility: Electric water heater
Neighborhood map
What this means for you Summary
Snapshot
- This is a 3-bed/2.0-bath manufactured listed at $135k.
Deal economics
- At list price, monthly cash flow is $328 ($4k/yr) — positive.
- The deal already cash-flows at list — no discount required.
- Meets the 1% rule at list price ($2k rent vs $135k).
- Recommended offer: $133k (1.5% below list) — sets the bar for market timing.
- Cap rate 9.8% vs local median 5.9% in Oak Trail Shores — top-decile yield for the area; either an underpriced asset or a hidden risk that comps aren't pricing in. Stress-test before assuming the spread holds.
Location & tenants
- Location reads 58/100 on livability (#1,187 in TX) — a working-class tenant base; expect higher turnover. Strengths: cost of living A+, housing A+, crime B+; Watch: health & safety D+, amenities F, commute F.
- Granbury ISD (town): math 46% / reading 46% proficiency, ranked #237 of 826 in TX (top 29%) — families likely to look elsewhere, expect single-tenant / working-renter base with shorter leases.
- Zoned schools: Mambrino School (math 53% / reading 48%, grade D+, #833 of 4,322 statewide, top 20%, 886 students, 53% FRL).
- Market conditions: Rents rising (+1.1%/yr); 929 active listings in the ZIP; 4 comparable units currently listed for rent nearby; rentals lingering (median 44d on market — plan ~5-8 weeks vacancy on turnover, expect pricing pressure); 50% of comp listings sitting > 30 days — soft ceiling on asking rent; 125 units permitted in Hood County in 2024 (0 in 5+ unit buildings).
Forward outlook
- Local home prices are declining (-3.0%/yr); year-one equity from $933 of loan paydown is wiped out by about $4k of value loss. Plan a longer hold.
- Hood County population projected at +29% by 2050 — long-run rental-demand tailwind backs the buy-and-hold thesis.
Negotiation context
- It's been on market 18 days — a 2% lower offer ($133k) is reasonable based on typical stale-listing flexibility.
- 7 sale attempts since 9y ago with the ask held roughly flat each time — persistent listings suggest the price (not the market) is what's stuck; bring a comps-based counter.
Risks & watch-outs
- Watch-outs: flood insurance adds $66/mo.
- Climate carrying-cost: major flood risk; major wind risk, 27% chance of damaging wind over 30y; moderate wildfire risk; extreme-heat days projected 7→23/yr by 2055 (HVAC capex compounding) — expect insurance premiums to compound above CPI over the hold.
Questions for the listing agent
- What's the actual annual flood-insurance premium (NFIP or private), and is the property in a SFHA with mandatory coverage?
- What does the HOA fee cover, when was the last increase, and are there any pending special assessments or reserve-fund shortfalls?
- Is there a deadline driving the sale (1031 exchange, divorce, estate, relocation)? That informs how much negotiation room exists.
- Schools are F-rated, which usually means shorter tenancies and higher turnover. Who's the typical renter profile here, and what's been the actual vacancy rate?
- What's the average days-on-market for RENTAL listings here right now (not sales)? A rising rental-DOM trend means longer vacancies and softer asking-rent achievability than the comps imply.
- What's the recent tenant-quality profile in this submarket — average credit score on applications, eviction rate, late-payment / NSF rate, and stable-employment percentage? A property-management company in the area should have these aggregated.
- How much new for-sale + rental construction is in the pipeline within 1–3 miles? Heavy new supply typically softens prices + rents 12–24 months out; constrained supply supports both.
Investment metrics
- 1% rule
- 1.17% ✓
- Cap rate
- 9.80%
- Cash-on-cash
- 12.53%
- DSCR
- 1.56
- GRM
- 7.1
CMA / ARV
- ARV (on-the-fly)
- $162,192
- Comps found
- 7
Show comp detail 7 sales within ~0.75 mi
| Address | Dist | Beds/Ba | Sqft | Sold | Price | $/sf | Match |
|---|---|---|---|---|---|---|---|
| 5505 Highview | 0.15mi | 3/2.0 | 1,488 (0%) | 21mo | $160,000 | $108 | 76 |
| 5528 Lake View Dr | 0.21mi | 3/2.0 | 1,310 (-12%) | 2mo | $154,900 | $118 | 69 |
| 5714 Arkansas Trl | 0.46mi | 3/2.0 | 1,568 (+5%) | 11mo | $125,000 | $80 | 60 |
| 5821 Arrowhead Dr | 0.62mi | 3/2.0 | 1,456 (-2%) | 10mo | $170,000 | $117 | 59 |
| 5904 Flint Dr | 0.69mi | 4/2.0 (+1) | 1,474 (-1%) | 9mo | $205,000 | $139 | 54 |
| 5730 Arrowhead Dr | 0.50mi | 3/2.0 | 1,568 (+5%) | 18mo | $164,500 | $105 | 53 |
| 5823 Arrowhead Dr | 0.62mi | 3/2.0 | 1,278 (-14%) | 22mo | $139,500 | $109 | 29 |
Match score weights: distance 35% · size 25% · config 20% · recency 20%. Top-matched comps best support the ARV.
Projected returns pro-forma
-3.0% appreciation · 1.1% rent growth · sell at horizon
- IRR
- -2.8%
- Equity multiple
- 0.90×
- Total profit
- $-3,903
- Equity at exit
- $20,129
- IRR
- 4.7%
- Equity multiple
- 1.32×
- Total profit
- $11,918
- Equity at exit
- $11,672
Cash invested: $37,800 (down + closing). Projections, not guarantees.
Landlord ↔ Tenant lean methodology
- Overall (STATE)
- 87 Strongly Landlord-Friendly
- State Texas
- 87 Strongly Landlord-Friendly · R+5
- County
- — inherits STATE
- City
- — inherits STATE
ZIP-level market 76048
- Home prices YoY
- -23.4%
- Rents YoY
- 1.1%
- Active inventory
- 929
- Price-to-rent
- 7.1×
Monthly cashflow live
- Estimated rent
- $1,574 medium interval (Pro) →
- Mortgage (P&I)
- −$708
- Tax from tax record
- −$80 /mo · $964/yr
- Insurance
- −$56
- Flood insurance flood zone
- −$66 /mo · $798/yr
- HOA
- −$4
- Vacancy / Maint / Mgmt
- −$331
- Net cashflow
- $328
Break-even live
UW: 25.0% down · 7.5% · 30yr · 1.5% tax · 5.0% vac · 8.0% maint · 8.0% mgmt
Financing live
Cash to close
- Down payment
- $33,750
- Closing costs
- $4,050
- Reserves months
- —
- Total cash needed
- —
Loan-product check · same deal, 3 products live
Conventional
25% down · 7.5% · 30yr
- Down + closing
- —
- Monthly P&I
- —
- Monthly cashflow
- —
- DSCR
- —
- Eligible?
- —
Personal DTI + credit; lowest rate.
DSCR
20% down · 8.5% · 30yr
- Down + closing
- —
- Monthly P&I
- —
- Monthly cashflow
- —
- DSCR
- —
- Eligible?
- —
No personal income docs; deal must DSCR.
Hard money
10% down · 12.0% · 12mo
- Down + closing
- —
- Monthly P&I
- —
- Monthly cashflow
- —
- DSCR
- —
- Eligible?
- —
Short-term bridge; refi at stabilization.
Rent comps 4 comps
| Address | Beds | Baths | Sqft | Rent | $/sqft | DOM | Units | Dist |
|---|---|---|---|---|---|---|---|---|
| 5418 Lake View Dr Granbury, TX | 3.0 | 2.0 | 1284 | $1,300 | $1.01 | 44d | 1 | 0.06mi |
| 3225 Evergreen Dr Granbury, TX | 3.0 | 1.0 | 916 | $1,425 | $1.56 | 1d | 1 | 1.02mi |
| 4321 Terri Lee Ln Granbury, TX | 4.0 | 2.0 | 1387 | $2,075 | $1.50 | 1d | 1 | 1.30mi |
| 4214 W Virginia Dr Granbury, TX | 3.0 | 2.0 | 1064 | $1,595 | $1.50 | 44d | 1 | 1.48mi |
HOA detail
- Monthly dues
- $4 · $48/yr
- Likely covers
- pool
Listing history 13 events
-
2026-06-18days on market $135,000 Active 18 DOM
-
2026-06-17days on market $135,000 Active 17 DOM
-
2026-06-16days on market $135,000 Active 16 DOM
-
2026-06-15days on market $135,000 Active 15 DOM
-
2026-06-13days on market $135,000 Active 13 DOM
-
2026-06-09days on market $135,000 Active 9 DOM
-
2026-06-08days on market $135,000 Active 8 DOM
-
2026-06-07days on market $135,000 Active 7 DOM
-
2026-06-04days on market $135,000 Active 4 DOM
-
2026-06-03days on market $135,000 Active 3 DOM
-
2026-06-02days on market $135,000 Active 2 DOM
-
2026-06-01remarks 699-char remark
-
2026-06-01$135,000 Active 1 DOM
ⓘ Source: listings_history table (triggers on properties + properties_extension) + one-shot
backfill from property_details.listing_events for pre-trigger history.
Tax reassessment forecast TX · Resets to sale price
- Current annual tax
- $964 · $80/mo
- Projected year-2 tax
- $2,470 · $206/mo
- Expected delta
- +$1,506/yr (+$126/mo · 156.2%)
ⓘ Screening estimate from a state-policy table — verify with the county assessor before closing.
Climate risk First Street
- Flood 7/10 Severe FEMA zone X (shaded) · 77% chance over 30 yrs
- Wildfire 5/10 Major
- Heat 7/10 Severe 7 d/yr ≥108°F today · 23 d/yr by 30 yrs out
- Wind 6/10 Major 27% chance of damaging wind over 30 yrs
- Air quality 2/10 Low 1 unhealthy d/yr today · 2 by 30 yrs out
Nearby sold comps map
Loading sold comps map…
Walkable amenities ~0.75 mi
Loading nearby amenities…
Taxation est. · year 1
- Rental income
- $18,886
- − Mortgage interest
- −$7,562
- − Property taxes
- −$964
- − Insurance
- −$1,472
- − Repairs & maintenance
- −$1,511
- − Management
- −$1,511
- − HOA
- −$48
- − Depreciation
- −$3,927
- Taxable income
- $1,891
- Est. tax owed @ 24.0%
- −$454
- After-tax cash flow
- $3,486/yr
For passive investors: Depreciation is non-cash, so a rental often shows a tax loss while cash-flowing — sheltering income. Rental losses are passive: they offset passive income freely, and up to $25,000/yr can offset ordinary (W-2) income if you actively participate and your MAGI is under $100k (phasing out to $0 by $150k); unused losses carry forward. On sale, claimed depreciation is recaptured at up to 25%, and gains may owe capital-gains tax (a 1031 exchange can defer both). Figures are a year-1 estimate at your 24.0% rate — not tax advice; consult a CPA.
Schools (NCES district)
- District
- Granbury ISD
- NCES district ID
- 4821390
- Math proficiency
- 46% ▬ 0.00%
- Reading proficiency
- 46% ▲ 4.00%
- Median HH income
- $55,856
- Composite
- 40.04/100
- National rank
- #3820
- State rank
- #237 of 826 in TX
Livability — Oak Trail Shores
- Score
- 58/100
- State rank
- #1187
- US rank
- #20758
Category grades
Schools grade is shown separately in the Schools card above.
Census & demographics
- County
- Hood County · 58,506 people
- Metro
- Granbury, TX
- Population (ZIP)
- 27,000
- Household income
- $70,346
- Rent vs Own
- Severe rent burden
- 612.0
Population outlook (Hood County) Hauer SSP2
- Today (2025)
- 63,502 people
- By 2030
- 67,459 · +6.2%
- By 2040
- 74,958 · +18.0%
- By 2050
- 81,922 · +29.0%
- By 2075
- 98,872 · +55.7%
- By 2100
- 107,796 · +69.8%
Race, ethnicity, and origin ACS 2023
- Neighborhood character
- Predominantly White (80%)
- Race & ethnicity
- White 80% Hispanic / Latino 14% Two or more races 11% Black 1%
- Hispanic origin (detail)
- Mexican 13%
- Common ancestry
- Italian 2% Slovak 2% Portuguese 1%
- Foreign-born
- 4% · Canada
- Languages at home
- 89% English-only · Spanish 10%
Political lean MEDSL · Hood
- 2024 margin
- Solid R (+66.0) · D 16.6% · R 82.6%
- 2008→2024 swing
- -11.9pp toward R · 2008: -54.0pp · 2024: -66.0pp
- All cycles
- 2024: R+66.0 2020: R+64.1 2016: R+66.5 2012: R+64.7 2008: R+54.0
Not yet ingested
- Civics
- —
Market trends
- HPI YoY
- ▼ -83.25%
- Current HPI
- 272.2126
- Rent YoY
- ▲ 1.10%
- Metro
- Granbury, TX
- State GDP YoY
- ▲ 3.95%
- F500 in state
- 110
Industry mix (Fortune 500 HQ in TX)
| Industry | F500 HQs | Revenue |
|---|---|---|
| Energy | 16 | $1,198B |
|
||
| Technology | 5 | $198B |
|
||
| Engineering / Construction | 4 | $72B |
|
||
| Energy Services | 3 | $60B |
|
||
| Utilities | 3 | $41B |
|
||
| Healthcare | 2 | $330B |
|
||
Price history
+321.9% since first listed26 events — show timeline
- 2026-05-29 Listed $135,000 NTREIS
- 2026-04-27 Listing Removed — NTREIS
- 2026-04-03 Relisted — NTREIS
- 2026-02-19 Pending — NTREIS
- 2026-02-09 Contingent — NTREIS
- 2025-10-20 Price Changed $133,000 NTREIS
- 2025-09-11 Listed $135,000 NTREIS
- 2020-04-02 Sold (Public Records) — Public Records
- 2020-03-31 Sold (MLS) — NTREIS
- 2020-03-12 Pending — NTREIS
- 2020-03-04 Contingent — NTREIS
- 2020-02-12 Price Changed $87,500 NTREIS
- 2019-12-06 Listed $89,900 NTREIS
- 2018-03-23 Sold (Public Records) — Public Records
- 2018-03-23 Sold (MLS) — NTREIS
- 2018-02-27 Pending — NTREIS
- 2018-02-22 Listed $46,900 NTREIS
- 2018-02-17 Listing Removed — NTREIS
- 2018-01-18 Price Changed $46,900 NTREIS
- 2017-12-07 Price Changed $49,900 NTREIS
- 2017-10-27 Listed $52,900 NTREIS
- 2017-09-13 Sold (Public Records) — Public Records
- 2017-06-13 Sold (MLS) — NTREIS
- 2017-03-03 Pending — NTREIS
- 2017-03-03 Listed $32,000 NTREIS
- 2002-03-15 Sold (Public Records) — Public Records
Property tax history
+4.1%/yrLatest (2025): $964 · +10.9% YoY. Source: county tax records.
Cash-flow waterfall
monthlySold comps — $/sqft
last 12 mo · ≤1 miLoading sold comps…