 🏷️ Likely Rental
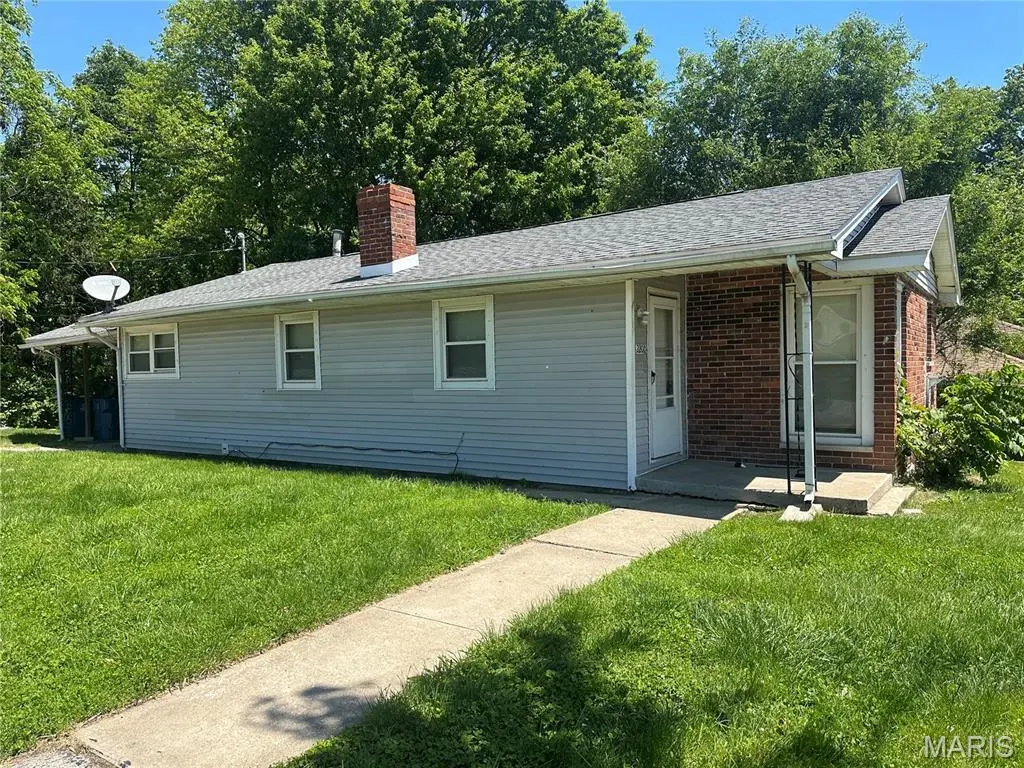
2200 Judson Ave · Alton, IL
Flood risk 6/10 · Moderate
- FEMA flood zone
- X
- Chance of flooding over 30 yrs
- 0.74%
- Est. flood insurance / yr
- $473 – $860
Fire risk 1/10 · Minimal
- Est. fire insurance / yr
- $804 – $1,492
Heat risk 5/10 · Moderate
- Hot days now (above 106°F)
- 7 days/yr
- Hot days in 30 yrs
- 20 days/yr
Wind risk 2/10 · Minimal
- Chance of severe wind over 30 yrs
- 1.0%
Air-quality risk 3/10 · Minor
- Unhealthy air days now
- 2 days/yr
- Unhealthy air days in 30 yrs
- 4 days/yr
Risk factors via First Street. Map © Google.
Why this score? — see what drove the B+ grade
The composite is a weighted blend of 9 inputs, each scored 0–100. Each bar is that input's sub-score; the figure is the points it added to the 100-point composite (weight × sub-score).
- Cash flow +30.0/30.0
- ARV discount +15.0/15.0
- 1% rule +10.0/10.0
- DSCR +10.0/10.0
- Rent growth +4.6/5.0
- Livability +3.2/5.0
- Condition / age +2.5/5.0
- Schools +1.1/10.0
- Appreciation +0.0/10.0
$69,900
🖨 Deal sheet (PDF) 📄 Offer letter ✓ Due diligence
Listing remarks
Great property for a rehab or a buy and hold! Rent estimate fixed up $12500-1350 per month depending on condition. Don't miss this! So much opportuntiy here. Property is located right next to the middle school. Features large rooms, large kitchen, walk out basement and so much more! Make your appointment today! Seller is selling in "as is" condition and will not make any repairs/will not pay for occupancy inspection or provide a permit.
Key facts
- Large kitchen
- Walk out basement
- 6,381 sq ft lot
Tags
Property features AI
Finance
- Other: Living area reported as 1,122 (above grade) with additional 561 finished below grade; Lot dimensions approximately 50 x 127.6
- Financial info: No second mortgage reported
Exterior
- Parking: Carport (1 space)
- Utilities: Public water; Public sewer; Electric service by Ameren; Electricity, sewer, and water connected
- Home design: Single-family residential; One level
- Construction: Brick construction; Below-grade finished area present
- Exterior features: Front yard; Back yard
Interior
- Kitchen: Kitchen (11 x 10)
- Bedrooms: 3 bedrooms on the main level (sizes: 11 x 13; 12 x 9; 13 x 10)
- Bathrooms: 1 full bathroom (main level)
- Heating & cooling: Forced air heating (natural gas); Central air conditioning
- Interior features: Walk-out basement
Neighborhood map
What this means for you Summary
Snapshot
- This is a 3-bed/1.0-bath single-family listed at $70k.
Deal economics
- At list price, monthly cash flow is $304 ($4k/yr) — positive.
- The deal already cash-flows at list — no discount required.
- Meets the 1% rule at list price ($1k rent vs $70k).
- Recommended offer: $68k (3.0% below list) — sets the bar for market timing.
- Cap rate 11.5% vs local median 6.4% in Alton — top-decile yield for the area; either an underpriced asset or a hidden risk that comps aren't pricing in. Stress-test before assuming the spread holds.
Location & tenants
- Location reads 64/100 on livability (#701 in IL) — a middle-class / working-renter tenant base. Strengths: cost of living A+, housing A; Watch: health & safety C-, crime F, amenities D-.
- Alton CUSD 11 (suburban): math 12% / reading 13% proficiency, ranked #544 of 620 in IL (top 88%) — low school quality limits family demand, transient renter base, plan for 1-2y turnover; 60% free/reduced lunch — lower-income household profile, screen leases tightly.
- Zoned schools: Eunice Smith Elem School (288 students, 0% FRL); Alton Middle School (math 10% / reading 11%, grade F, #580 of 665 statewide, top 88%, 1,241 students, 0% FRL); Alton High School (math 20% / reading 25%, grade F, #317 of 693 statewide, top 46%, 1,990 students, 0% FRL) — zoned schools average 0% FRL vs 60% district-wide (60 pts lower); this property's tenant base skews higher-income than the district average.
- Market conditions: Rents rising fast (+8.2%/yr); 169 active listings in the ZIP; 8 comparable units currently listed for rent nearby; rentals at typical pace (median 22d on market — plan ~3-4 weeks tenant-placement turnaround); 336 units permitted in Madison County in 2024 (0 in 5+ unit buildings).
Forward outlook
- Local home prices are declining (-3.0%/yr); year-one equity from $483 of loan paydown is wiped out by about $2k of value loss. Plan a longer hold.
- Madison County population projected at -18% by 2050 — secular population decline; favor cash flow + early exit over multi-decade hold.
- At projected returns (-3.0% appreciation + 8.0% rent growth), your $20k cash investment doubles in ~5 years — after that, you're playing with house money.
Negotiation context
- It's been on market 38 days — a 3% lower offer ($68k) is reasonable based on typical stale-listing flexibility.
Risks & watch-outs
- Watch-outs: property tax is 3.0% of price.
- Climate carrying-cost: major flood risk; extreme-heat days projected 7→20/yr by 2055 (HVAC capex compounding) — expect insurance premiums to compound above CPI over the hold.
Questions for the listing agent
- It's been on market 38 days. Have you received any prior offers? Is the seller open to a 3% concession, seller financing, or rate buy-down credit?
- Built in 1962 — when were the roof, HVAC, electrical panel, plumbing, and water heater last replaced?
- Property tax is high relative to price — has the assessment been appealed recently, and will the sale trigger a re-assessment?
- Is there a deadline driving the sale (1031 exchange, divorce, estate, relocation)? That informs how much negotiation room exists.
- Schools are F-rated, which usually means shorter tenancies and higher turnover. Who's the typical renter profile here, and what's been the actual vacancy rate?
- Crime grade is F in this area — have there been break-ins, vandalism, or insurance claims at this property in the last 3 years? What carrier currently insures it and at what premium?
- What's the average days-on-market for RENTAL listings here right now (not sales)? A rising rental-DOM trend means longer vacancies and softer asking-rent achievability than the comps imply.
- What's the recent tenant-quality profile in this submarket — average credit score on applications, eviction rate, late-payment / NSF rate, and stable-employment percentage? A property-management company in the area should have these aggregated.
- How much new for-sale + rental construction is in the pipeline within 1–3 miles? Heavy new supply typically softens prices + rents 12–24 months out; constrained supply supports both.
Investment metrics
- 1% rule
- 1.59% ✓
- Cap rate
- 11.52%
- Cash-on-cash
- 18.66%
- DSCR
- 1.83
- GRM
- 5.3
CMA / ARV
- ARV (median comp)
- $88,081
- List price
- $69,900
- Delta
- -20.64%
- Verdict
- UNDERPRICED
- Comps
- 20 within 1.0 mi
Show comp detail 12 sales within ~0.75 mi
| Address | Dist | Beds/Ba | Sqft | Sold | Price | $/sf | Match |
|---|---|---|---|---|---|---|---|
| 1915 Jersey St | 0.10mi | 2/1.0 (-1) | 1,125 (+0%) | 10mo | $85,000 | $76 | 82 |
| 1638 Jersey St | 0.21mi | 3/2.0 | 1,111 (-1%) | 5mo | $120,000 | $108 | 80 |
| 1915 Clawson St | 0.35mi | 2/2.0 (-1) | 1,163 (+4%) | 0mo | $139,900 | $120 | 68 |
| 1215 Clawson St | 0.69mi | 2/1.0 (-1) | 1,125 (+0%) | 4mo | $52,000 | $46 | 59 |
| 1050 Tremont St | 0.71mi | 3/1.0 | 1,134 (+1%) | 8mo | $84,000 | $74 | 58 |
| 1235 Fairway Dr | 0.55mi | 2/1.0 (-1) | 1,076 (-4%) | 5mo | $60,000 | $56 | 58 |
| 1149 Vernie Ave | 0.65mi | 3/1.0 | 1,152 (+3%) | 13mo | $64,900 | $56 | 55 |
| 2213 Johnson St | 0.70mi | 3/1.5 | 1,100 (-2%) | 10mo | $59,900 | $54 | 54 |
| 1516 Spaulding St | 0.62mi | 3/1.5 | 1,218 (+9%) | 6mo | $115,000 | $94 | 50 |
| 2713 Edwards St | 0.52mi | 2/1.0 (-1) | 1,228 (+9%) | 11mo | $94,500 | $77 | 46 |
| 1102 Sheehan Ln | 0.72mi | 2/2.0 (-1) | 1,268 (+13%) | 3mo | $139,900 | $110 | 33 |
| 1600 Annex St | 0.66mi | 2/2.0 (-1) | 1,255 (+12%) | 10mo | $135,000 | $108 | 32 |
Match score weights: distance 35% · size 25% · config 20% · recency 20%. Top-matched comps best support the ARV.
Projected returns pro-forma
-3.0% appreciation · 8.0% rent growth · sell at horizon
- IRR
- 16.6%
- Equity multiple
- 1.71×
- Total profit
- $13,985
- Equity at exit
- $10,422
- IRR
- 28.9%
- Equity multiple
- 4.28×
- Total profit
- $64,099
- Equity at exit
- $6,044
Cash invested: $19,572 (down + closing). Projections, not guarantees.
Landlord ↔ Tenant lean methodology
- Overall (STATE)
- 43 Moderately Tenant-Leaning
- State Illinois
- 43 Moderately Tenant-Leaning · D+7
- County
- — inherits STATE
- City
- — inherits STATE
ZIP-level market 62002
- Home prices YoY
- -33.6%
- Rents YoY
- 8.2%
- Active inventory
- 169
- Price-to-rent
- 5.3×
Monthly cashflow live
- Estimated rent
- $1,109 high interval (Pro) →
- Mortgage (P&I)
- −$367
- Tax from tax record
- −$176 /mo · $2,114/yr
- Insurance
- −$29
- HOA
- −$0
- Vacancy / Maint / Mgmt
- −$233
- Net cashflow
- $304
Break-even live
Sensitivity live
| Price | -10% $344 | -5% $324 | +0% $304 | +5% $284 | +10% $265 |
|---|---|---|---|---|---|
| Rent | -10% $217 | -5% $260 | +0% $304 | +5% $348 | +10% $392 |
| Rate | -1.0pp $339 | -0.5pp $322 | base $304 | +0.5pp $286 | +1.0pp $268 |
UW: 25.0% down · 7.5% · 30yr · 1.5% tax · 5.0% vac · 8.0% maint · 8.0% mgmt
Financing live
Cash to close
- Down payment
- $17,475
- Closing costs
- $2,097
- Reserves months
- —
- Total cash needed
- —
Loan-product check · same deal, 3 products live
Conventional
25% down · 7.5% · 30yr
- Down + closing
- —
- Monthly P&I
- —
- Monthly cashflow
- —
- DSCR
- —
- Eligible?
- —
Personal DTI + credit; lowest rate.
DSCR
20% down · 8.5% · 30yr
- Down + closing
- —
- Monthly P&I
- —
- Monthly cashflow
- —
- DSCR
- —
- Eligible?
- —
No personal income docs; deal must DSCR.
Hard money
10% down · 12.0% · 12mo
- Down + closing
- —
- Monthly P&I
- —
- Monthly cashflow
- —
- DSCR
- —
- Eligible?
- —
Short-term bridge; refi at stabilization.
Rent comps 8 comps
| Address | Beds | Baths | Sqft | Rent | $/sqft | DOM | Units | Dist |
|---|---|---|---|---|---|---|---|---|
| 2016 Salu St Alton, IL | 3.0 | 1.0 | 1073 | $1,100 | $1.03 | 17d | 1 | 0.47mi |
| 2222 Brown St Alton, IL | 4.0 | 2.0 | 1025 | $1,050 | $1.02 | 9d | 1 | 0.48mi |
| 2418 Sanford Ave Alton, IL | 2.0 | 1.0 | 958 | $875 | $0.91 | 22d | 1 | 0.87mi |
| 3303 Jackson St Alton, IL | 2.0 | 1.0 | 1050 | $1,295 | $1.23 | 45d | 1 | 0.94mi |
| 306 Lampert St Alton, IL | 2.0 | 1.0 | 925 | $1,000 | $1.08 | 0d | 1 | 1.16mi |
| 3305 Franor St Alton, IL | 2.0 | 1.0 | 1000 | $549 | $0.55 | 3d | 1 | 1.22mi |
| 602 Sheppard St Alton, IL | 2.0 | 1.0 | 1172 | $875 | $0.75 | 22d | 1 | 1.27mi |
| 504 Cherry St Alton, IL | 2.0 | 1.0 | 1000 | $895 | $0.90 | 45d | 1 | 1.32mi |
Listing history 18 events
-
2026-06-21days on market $69,900 Active 38 DOM
-
2026-06-18days on market $69,900 Active 35 DOM
-
2026-06-17days on market $69,900 Active 34 DOM
-
2026-06-16days on market $69,900 Active 33 DOM
-
2026-06-15days on market $69,900 Active 32 DOM
-
2026-06-13days on market $69,900 Active 30 DOM
-
2026-06-09days on market $69,900 Active 26 DOM
-
2026-06-08days on market $69,900 Active 25 DOM
-
2026-06-07days on market $69,900 Active 24 DOM
-
2026-06-03days on market $69,900 Active 20 DOM
-
2026-06-02days on market $69,900 Active 19 DOM
-
2026-06-01days on market $69,900 Active 18 DOM
-
2026-05-31days on market $69,900 Active 17 DOM
-
2026-05-14$69,900 Active 450-char remark
-
2015-09-01soldstatus $63,500
-
2015-05-12soldstatus $45,000
-
1995-03-10soldstatus $50,000
-
1990-09-06soldstatus $44,000
ⓘ Source: listings_history table (triggers on properties + properties_extension) + one-shot
backfill from property_details.listing_events for pre-trigger history.
Tax reassessment forecast IL · Partial reset (capped growth)
- Current annual tax
- $2,114 · $176/mo
- Projected year-2 tax
- $2,114 · $176/mo
- Expected delta
- $0/yr ($0/mo · 0.0%)
ⓘ Screening estimate from a state-policy table — verify with the county assessor before closing.
Climate risk First Street
- Flood 6/10 Major FEMA zone X · 74% chance over 30 yrs
- Wildfire 1/10 Low
- Heat 5/10 Major 7 d/yr ≥106°F today · 20 d/yr by 30 yrs out
- Wind 2/10 Low 100% chance of damaging wind over 30 yrs
- Air quality 3/10 Moderate 2 unhealthy d/yr today · 4 by 30 yrs out
Nearby sold comps map
Loading sold comps map…
Walkable amenities ~0.75 mi
Loading nearby amenities…
Taxation est. · year 1
- Rental income
- $13,309
- − Mortgage interest
- −$3,915
- − Property taxes
- −$2,114
- − Insurance
- −$350
- − Repairs & maintenance
- −$1,065
- − Management
- −$1,065
- − Depreciation
- −$2,033
- Taxable income
- $2,767
- Est. tax owed @ 24.0%
- −$664
- After-tax cash flow
- $2,987/yr
For passive investors: Depreciation is non-cash, so a rental often shows a tax loss while cash-flowing — sheltering income. Rental losses are passive: they offset passive income freely, and up to $25,000/yr can offset ordinary (W-2) income if you actively participate and your MAGI is under $100k (phasing out to $0 by $150k); unused losses carry forward. On sale, claimed depreciation is recaptured at up to 25%, and gains may owe capital-gains tax (a 1031 exchange can defer both). Figures are a year-1 estimate at your 24.0% rate — not tax advice; consult a CPA.
Schools (NCES district)
- District
- Alton CUSD 11
- NCES district ID
- 1703600
- Math proficiency
- 12% ▼ -10.00%
- Reading proficiency
- 13% ▼ -10.00%
- Median HH income
- $46,257
- Composite
- 11.34/100
- National rank
- #9710
- State rank
- #544 of 620 in IL
Livability — Alton
- Score
- 64/100
- State rank
- #701
- US rank
- #14289
Category grades
Schools grade is shown separately in the Schools card above.
Census & demographics
- Census place
- Alton, IL
- County
- Madison County · 189,064 people
- City population
- 29,543
- Metro
- St. Louis, MO-IL
- Population (ZIP)
- 29,543
- Household income
- $61,414
- Rent vs Own
- Severe rent burden
- 960.0
Population outlook (Madison County) Hauer SSP2
- Today (2025)
- 258,371 people
- By 2030
- 251,523 · -2.7%
- By 2040
- 233,640 · -9.6%
- By 2050
- 213,042 · -17.5%
- By 2075
- 165,255 · -36.0%
- By 2100
- 123,953 · -52.0%
Race, ethnicity, and origin ACS 2023
- Neighborhood character
- Predominantly White (71%)
- Race & ethnicity
- White 71% Black 20% Two or more races 6% Hispanic / Latino 2% Asian 1%
- Common ancestry
- Romanian 2% Lithuanian 2% Slovak 1%
- Foreign-born
- 2% · Canada
- Languages at home
- 97% English-only · Spanish 1% Other Indo-European 1%
Political lean MEDSL · Madison
- 2024 margin
- R (+13.3) · D 42.5% · R 55.8% · Other 1.8%
- 2008→2024 swing
- -22.5pp toward R · 2008: 9.2pp · 2024: -13.3pp
- All cycles
- 2024: R+13.3 2020: R+13.2 2016: R+15.6 2012: R+1.4 2008: D+9.2
Not yet ingested
- Civics
- —
Market trends
- HPI YoY
- ▼ -98.43%
- Current HPI
- 194.7313
- Rent YoY
- ▲ 8.24%
- Metro
- St. Louis, MO-IL
- State GDP YoY
- ▲ 1.59%
- F500 in state
- 60
Industry mix (Fortune 500 HQ in IL)
| Industry | F500 HQs | Revenue |
|---|---|---|
| Insurance | 4 | $201B |
|
||
| Consumer Goods | 4 | $87B |
|
||
| Industrial Machinery | 3 | $64B |
|
||
| Healthcare | 2 | $55B |
|
||
| Retail / Pharmacy | 1 | $148B |
|
||
| Agriculture / Food | 1 | $86B |
|
||
Price history
+58.9% since first listed5 events — show timeline
- 2026-05-14 Listed $69,900 MARIS as Distributed by MLS Grid
- 2015-09-01 Sold (Public Records) $63,500 Public Records
- 2015-05-12 Sold (Public Records) $45,000 Public Records
- 1995-03-10 Sold (Public Records) $50,000 Public Records
- 1990-09-06 Sold (Public Records) $44,000 Public Records
Property tax history
+2.5%/yrLatest (2024): $2,114 · +6.4% YoY. Source: county tax records.
Cash-flow waterfall
monthlySold comps — $/sqft
last 12 mo · ≤1 miLoading sold comps…