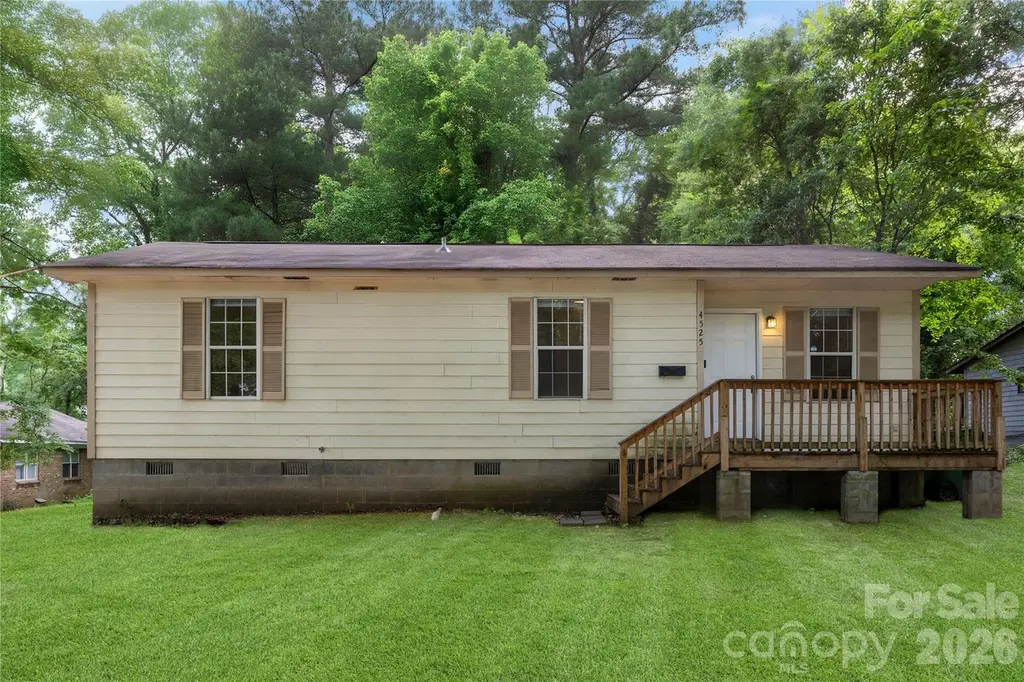
4525 Rolling Hill Dr · Charlotte, NC
Flood risk 1/10 · Minimal
- FEMA flood zone
- X (unshaded)
- Chance of flooding over 30 yrs
- 0.0%
- Est. flood insurance / yr
- $507 – $1,088
Fire risk 1/10 · Minimal
- Est. fire insurance / yr
- $906 – $1,684
Heat risk 6/10 · Moderate
- Hot days now (above 104°F)
- 7 days/yr
- Hot days in 30 yrs
- 16 days/yr
Wind risk 5/10 · Moderate
- Chance of severe wind over 30 yrs
- 26.0%
Air-quality risk 4/10 · Minor
- Unhealthy air days now
- 4 days/yr
- Unhealthy air days in 30 yrs
- 5 days/yr
Risk factors via First Street. Map © Google.
Why this score? — see what drove the C grade
The composite is a weighted blend of 9 inputs, each scored 0–100. Each bar is that input's sub-score; the figure is the points it added to the 100-point composite (weight × sub-score).
- Cash flow +18.3/30.0
- ARV discount +15.0/15.0
- DSCR +5.8/10.0
- 1% rule +4.3/10.0
- Livability +3.9/5.0
- Schools +3.8/10.0
- Rent growth +2.7/5.0
- Condition / age +2.5/5.0
- Appreciation +0.0/10.0
$199,900
🖨 Deal sheet (PDF) 📄 Offer letter ✓ Due diligence
Listing remarks MLS
Single story home with 3 bedrooms, 2 baths, kitchen, living room and dining room. Home features neutral colors throughout, porch and sits on 0.17 acre nice lot. Come and see!
Key facts
- 7,492 sq ft lot
- Built 1997
- Listed 8 days
Property features AI
Finance
- HOA & community: No HOA
Exterior
- Parking: Driveway
- Utilities: City water; Public sewer
- Home design: Single family residence; Residential property; One story
- Construction: Site-built construction; Wood construction materials; Crawl space foundation; Built on one level
- Exterior features: Dirt and paved road access; Publicly maintained road
Interior
- Kitchen: Refrigerator
- Bedrooms: 3 bedrooms on the main level
- Bathrooms: 2 full bathrooms on the main level
- Heating & cooling: Central heating (forced air); Central air conditioning; Ceiling fan(s)
- Interior features: 10 total rooms; Central heating; Forced air heating; Ceiling fans; Central air conditioning; Refrigerator included
- Laundry & utility: Dedicated laundry room
Neighborhood map
What this means for you Summary
Snapshot
- This is a 3-bed/2.0-bath single-family listed at $200k.
Deal economics
- At list price, monthly cash flow is $184 ($2k/yr) — positive.
- The deal already cash-flows at list — no discount required.
- To meet the 1% rule (rent ≥ 1% of price), the offer needs to be $185k (7.4% below list).
- Recommended offer: $185k (7.4% below list) — sets the bar for 1% rule.
- Cap rate 7.4% vs local median 3.1% in Charlotte — top-decile yield for the area; either an underpriced asset or a hidden risk that comps aren't pricing in. Stress-test before assuming the spread holds.
Location & tenants
- Location reads 78/100 on livability (#26 in NC, #2,502 nationally) — a middle-class / working-renter tenant base. Strengths: amenities A+, commute A+, housing A+; Watch: crime F.
- Charlotte-Mecklenburg Schools (urban): math 42% / reading 46% proficiency, ranked #85 of 178 in NC (top 48%) — families likely to look elsewhere, expect single-tenant / working-renter base with shorter leases.
- Zoned schools: Hidden Valley Elementary (math 27% / reading 16%, grade F, #1,218 of 1,410 statewide, top 87%, 943 students, 100% FRL); Martin Luther King Jr Middle (math 11% / reading 20%, grade F, #456 of 475 statewide, top 96%, 931 students, 100% FRL); Julius L. Chambers High School (math 40% / reading 35%, grade F, #411 of 535 statewide, top 77%, 2,224 students, 100% FRL) — zoned schools average 100% FRL vs 49% district-wide (51 pts higher); higher-poverty schools than district average — tighter screening recommended.
- Zoned-school proficiency averages 25% at this address vs 44% district-wide (-19 pts) — the specific schools serving this property underperform the Charlotte-Mecklenburg Schools average; the district grade overstates school quality for this exact location.
- Market conditions: Rents flat; 283 active listings in the ZIP; 40 comparable units currently listed for rent nearby; rentals leasing fast (median 7d on market — plan ~1-2 weeks tenant-placement turnaround); 11,969 units permitted in Mecklenburg County in 2024 (5,377 in 5+ unit buildings).
- This rent runs 38% of the median local income ($58k/yr) — at the standard rent-burdened threshold; future hikes will face affordability resistance.
Forward outlook
- Local home prices are declining (-3.0%/yr); year-one equity from $1k of loan paydown is wiped out by about $6k of value loss. Plan a longer hold.
- Mecklenburg County population projected at +53% by 2050 — long-run rental-demand tailwind backs the buy-and-hold thesis.
Negotiation context
- Only 8 days on market — expect competitive offers; lowballing is unlikely to land.
- 3 sale attempts since 13y ago with the ask held roughly flat each time — persistent listings suggest the price (not the market) is what's stuck; bring a comps-based counter.
Risks & watch-outs
- Climate carrying-cost: moderate wind risk, 26% chance of damaging wind over 30y; extreme-heat days projected 7→16/yr by 2055 (HVAC capex compounding) — expect insurance premiums to compound above CPI over the hold.
Questions for the listing agent
- Is there a deadline driving the sale (1031 exchange, divorce, estate, relocation)? That informs how much negotiation room exists.
- Schools are D-rated, which usually means shorter tenancies and higher turnover. Who's the typical renter profile here, and what's been the actual vacancy rate?
- Crime grade is F in this area — have there been break-ins, vandalism, or insurance claims at this property in the last 3 years? What carrier currently insures it and at what premium?
- What's the average days-on-market for RENTAL listings here right now (not sales)? A rising rental-DOM trend means longer vacancies and softer asking-rent achievability than the comps imply.
- What's the recent tenant-quality profile in this submarket — average credit score on applications, eviction rate, late-payment / NSF rate, and stable-employment percentage? A property-management company in the area should have these aggregated.
- How much new for-sale + rental construction is in the pipeline within 1–3 miles? Heavy new supply typically softens prices + rents 12–24 months out; constrained supply supports both.
Investment metrics
- 1% rule
- 0.93% ✗
- Cap rate
- 7.40%
- Cash-on-cash
- 3.95%
- DSCR
- 1.18
- GRM
- 9.0
CMA / ARV
- ARV (on-the-fly)
- $266,664
- Comps found
- 12
Show comp detail 12 sales within ~0.75 mi
| Address | Dist | Beds/Ba | Sqft | Sold | Price | $/sf | Match |
|---|---|---|---|---|---|---|---|
| 735 Pondella Dr | 0.66mi | 3/1.0 | 985 (+0%) | 1mo | $266,800 | $271 | 64 |
| 631 W Craighead Rd | 0.57mi | 3/2.0 | 1,019 (+4%) | 5mo | $280,000 | $275 | 64 |
| 3801 Sofley Rd | 0.54mi | 3/2.0 | 953 (-3%) | 9mo | $260,000 | $273 | 62 |
| 4101 Cushman St | 0.49mi | 3/2.0 | 1,000 (+2%) | 18mo | $300,000 | $300 | 60 |
| 4823 Springview Rd | 0.46mi | 3/1.0 | 985 (+0%) | 22mo | $194,900 | $198 | 56 |
| 5123 Cinderella Rd | 0.51mi | 3/1.0 | 983 (-0%) | 23mo | $270,000 | $275 | 53 |
| 622 Northcrest Dr | 0.65mi | 3/1.0 | 923 (-6%) | 5mo | $170,000 | $184 | 52 |
| 823 Ridgedale Ct | 0.52mi | 3/1.0 | 972 (-1%) | 22mo | $278,000 | $286 | 51 |
| 4900 Snow White Ln | 0.41mi | 3/1.0 | 1,107 (+12%) | 8mo | $205,000 | $185 | 49 |
| 507 Burroughs St | 0.49mi | 3/1.0 | 1,026 (+4%) | 21mo | $230,000 | $224 | 48 |
| 830 Log Cabin Rd | 0.51mi | 3/1.0 | 1,125 (+14%) | 8mo | $266,000 | $236 | 42 |
| 4907 Springview Rd | 0.48mi | 3/1.5 | 1,115 (+13%) | 24mo | $250,000 | $224 | 34 |
Match score weights: distance 35% · size 25% · config 20% · recency 20%. Top-matched comps best support the ARV.
Projected returns pro-forma
-3.0% appreciation · 0.63% rent growth · sell at horizon
- IRR
- -12.7%
- Equity multiple
- 0.55×
- Total profit
- $-24,998
- Equity at exit
- $29,806
- IRR
- -7.4%
- Equity multiple
- 0.58×
- Total profit
- $-23,668
- Equity at exit
- $17,284
Cash invested: $55,972 (down + closing). Projections, not guarantees.
Landlord ↔ Tenant lean methodology
- Overall (STATE)
- 85 Strongly Landlord-Friendly
- State North Carolina
- 85 Strongly Landlord-Friendly · R+3
- County
- — inherits STATE
- City
- — inherits STATE
ZIP-level market 28213
- Home prices YoY
- -24.9%
- Rents YoY
- 0.6%
- Active inventory
- 283
- Price-to-rent
- 9.0×
Monthly cashflow live
- Estimated rent
- $1,851 high interval (Pro) →
- Mortgage (P&I)
- −$1,048
- Tax from tax record
- −$147 /mo · $1,759/yr
- Insurance
- −$83
- HOA
- −$0
- Vacancy / Maint / Mgmt
- −$389
- Net cashflow
- $184
Break-even live
Sensitivity live
| Price | -10% $298 | -5% $241 | +0% $184 | +5% $128 | +10% $71 |
|---|---|---|---|---|---|
| Rent | -10% $38 | -5% $111 | +0% $184 | +5% $257 | +10% $331 |
| Rate | -1.0pp $285 | -0.5pp $235 | base $184 | +0.5pp $133 | +1.0pp $80 |
UW: 25.0% down · 7.5% · 30yr · 1.5% tax · 5.0% vac · 8.0% maint · 8.0% mgmt
Financing live
Cash to close
- Down payment
- $49,975
- Closing costs
- $5,997
- Reserves months
- —
- Total cash needed
- —
Loan-product check · same deal, 3 products live
Conventional
25% down · 7.5% · 30yr
- Down + closing
- —
- Monthly P&I
- —
- Monthly cashflow
- —
- DSCR
- —
- Eligible?
- —
Personal DTI + credit; lowest rate.
DSCR
20% down · 8.5% · 30yr
- Down + closing
- —
- Monthly P&I
- —
- Monthly cashflow
- —
- DSCR
- —
- Eligible?
- —
No personal income docs; deal must DSCR.
Hard money
10% down · 12.0% · 12mo
- Down + closing
- —
- Monthly P&I
- —
- Monthly cashflow
- —
- DSCR
- —
- Eligible?
- —
Short-term bridge; refi at stabilization.
Rent comps 40 comps
| Address | Beds | Baths | Sqft | Rent | $/sqft | DOM | Units | Dist |
|---|---|---|---|---|---|---|---|---|
| 4333 Cinderella Rd Charlotte, NC | 1.0–2.0 | 1.0–1.5 | 759 | $1,425 | $1.88 | 25d | 1 | 0.13mi |
| 337 Wellingford St Charlotte, NC | 3.0 | 1.0 | 843 | $1,700 | $2.02 | 25d | 1 | 0.20mi |
| 4300 Penny Way Charlotte, NC | 2.0–3.0 | 2.0 | 1014 | $1,400 | $1.38 | 3d | 1 | 0.22mi |
| 601 Kentbrook Dr Charlotte, NC | 3.0 | 1.0 | 1000 | $1,685 | $1.69 | 3d | 1 | 0.42mi |
| 614 Kentbrook Dr Charlotte, NC | 3.0 | 1.5 | 1104 | $1,600 | $1.45 | 6d | 1 | 0.45mi |
| 815 Echo Glen Rd Charlotte, NC | 3.0 | 1.5 | 1125 | $1,495 | $1.33 | 16d | 1 | 0.66mi |
| 411 Lambeth Dr Charlotte, NC | 1.0–3.0 | 1.0–1.5 | 826 | $1,675 | $2.03 | 15d | 1 | 0.66mi |
| 4325 Raleigh St Charlotte, NC | 1.0–2.0 | 1.0–2.0 | 1005 | $1,920 | $1.91 | 6d | 25 | 0.73mi |
| 3934 Raleigh St Charlotte, NC | 3.0 | 1.0–2.0 | 959 | $3,105 | $3.24 | 9d | 103 | 0.77mi |
| 4101 Raleigh St Charlotte, NC | 2.0 | 1.0–2.0 | 910 | $2,356 | $2.59 | 0d | 160 | 0.77mi |
| 2019 Aberdale Farm Ln Charlotte, NC | 2.0–4.0 | 2.0 | 1119 | $1,450 | $1.30 | 6d | 1 | 0.82mi |
| 229 Hilo Dr Charlotte, NC | 1.0–2.0 | 1.0–2.0 | 860 | $1,475 | $1.72 | 25d | 1 | 0.82mi |
| 1030 Stitch Bend Way Charlotte, NC | 2.0 | 1.0–2.0 | 820 | $2,379 | $2.90 | 0d | 30 | 0.91mi |
| 3750 Philemon Ave Charlotte, NC | 3.0 | 1.0–2.0 | 909 | $2,577 | $2.83 | 0d | 24 | 0.93mi |
| 629 Raphael Pl Charlotte, NC | 2.0 | 2.0 | 1065 | $1,750 | $1.64 | 25d | 1 | 1.05mi |
| 3537 Warp St Charlotte, NC | 2.0 | 2.0 | 1070 | $1,800 | $1.68 | 25d | 1 | 1.06mi |
| 3531 Warp St Charlotte, NC | 2.0 | 2.0 | 1006 | $1,750 | $1.74 | 6d | 1 | 1.07mi |
| 1841 Prospect Dr Charlotte, NC | 1.0–3.0 | 1.0–2.0 | 915 | $1,604 | $1.75 | 9d | 25 | 1.09mi |
| 4207 Dinglewood Ave Charlotte, NC | 3.0 | 1.0 | 950 | $1,349 | $1.42 | 18d | 1 | 1.10mi |
| 4239 Dinglewood Ave Charlotte, NC | 3.0 | 1.0 | 900 | $1,850 | $2.06 | 25d | 1 | 1.10mi |
| 6126 Amberly Ln Charlotte, NC | 3.0 | 2.0 | 1115 | $2,050 | $1.84 | 18d | 1 | 1.11mi |
| 6126 Amberly Ln Charlotte, NC | 3.0 | 2.0 | 1115 | $2,050 | $1.84 | 22d | 1 | 1.11mi |
| 1240 Merrick St Charlotte, NC | 2.0–4.0 | 2.0 | 1204 | $1,437 | $1.19 | 25d | 1 | 1.13mi |
| 1300 Hunter Oaks Ln Charlotte, NC | 1.0–3.0 | 1.0–2.0 | 910 | $1,500 | $1.65 | 6d | 6 | 1.17mi |
| 3500 Philemon Ave Charlotte, NC | 2.0 | 1.0–2.0 | 781 | $2,359 | $3.02 | 0d | 112 | 1.18mi |
| 110 E 36th St Charlotte, NC | 3.0 | 1.0–2.0 | 883 | $3,195 | $3.62 | 3d | 51 | 1.19mi |
| 1305 Hunter Oaks Ln Charlotte, NC | 2.0 | 2.0 | 996 | $1,300 | $1.31 | 25d | 1 | 1.20mi |
| 1305 Hunter Oaks Ln Unit 1303-01 Charlotte, NC | 3.0 | 2.0 | 1076 | $1,500 | $1.39 | 6d | 1 | 1.20mi |
| 1305 Hunter Oaks Ln Unit 1302-15 Charlotte, NC | 2.0 | 2.0 | 996 | $1,300 | $1.31 | 6d | 1 | 1.20mi |
| 1305 Hunter Oaks Ln Unit 115 Charlotte, NC | 3.0 | 2.0 | 1076 | $1,500 | $1.39 | 25d | 1 | 1.20mi |
| 1400 Ventura Way Dr Charlotte, NC | 3.0 | 1.0–1.5 | 650 | $1,501 | $2.31 | 0d | 17 | 1.25mi |
| 300 E 36th St Charlotte, NC | 3.0 | 1.0–2.5 | 1040 | $3,168 | $3.05 | 3d | 31 | 1.26mi |
| 423 E 36th St Charlotte, NC | 3.0 | 1.0–2.0 | 903 | $3,012 | $3.34 | 0d | 17 | 1.27mi |
| 3310 N Davidson St Charlotte, NC | 3.0 | 1.0–2.0 | 996 | $3,178 | $3.19 | 3d | 18 | 1.29mi |
| 424 E 36th St Charlotte, NC | 2.0 | 1.0–2.0 | 920 | $2,477 | $2.69 | 0d | 32 | 1.30mi |
| 3035 N Tryon St Charlotte, NC | 2.0 | 1.0–2.0 | 968 | $2,661 | $2.75 | 0d | 340 | 1.31mi |
| 5001 Lakecrest Dr Charlotte, NC | 2.0 | 1.0 | 1000 | $1,600 | $1.60 | 18d | 1 | 1.35mi |
| 5003 Lakecrest Dr Charlotte, NC | 2.0 | 1.0 | 1000 | $1,600 | $1.60 | 18d | 1 | 1.35mi |
| 3306 N McDowell St Charlotte, NC | 1.0–2.0 | 1.0 | 740 | $1,555 | $2.10 | 6d | 3 | 1.36mi |
| 4928 Malibu Dr Charlotte, NC | 2.0 | 1.0 | 975 | $1,475 | $1.51 | 22d | 1 | 1.38mi |
Listing history 7 events
-
2026-06-18status $199,900 Pending 8 DOM
-
2026-06-18days on market $199,900 Active 8 DOM
-
2026-06-17days on market $199,900 Active 7 DOM
-
2026-06-16days on market $199,900 Active 6 DOM
-
2026-06-15days on market $199,900 Active 5 DOM
-
2026-06-13remarks 693-char remark
-
2026-06-13$199,900 Active 3 DOM
ⓘ Source: listings_history table (triggers on properties + properties_extension) + one-shot
backfill from property_details.listing_events for pre-trigger history.
Tax reassessment forecast NC · Resets to sale price
- Current annual tax
- $1,759 · $147/mo
- Projected year-2 tax
- $1,759 · $147/mo
- Expected delta
- $0/yr ($0/mo · 0.0%)
ⓘ Screening estimate from a state-policy table — verify with the county assessor before closing.
Climate risk First Street
- Flood 1/10 Low FEMA zone X (unshaded) · 0% chance over 30 yrs
- Wildfire 1/10 Low
- Heat 6/10 Major 7 d/yr ≥104°F today · 16 d/yr by 30 yrs out
- Wind 5/10 Major 26% chance of damaging wind over 30 yrs
- Air quality 4/10 Moderate 4 unhealthy d/yr today · 5 by 30 yrs out
Nearby sold comps map
Loading sold comps map…
Walkable amenities ~0.75 mi
Loading nearby amenities…
Taxation est. · year 1
- Rental income
- $22,216
- − Mortgage interest
- −$11,198
- − Property taxes
- −$1,759
- − Insurance
- −$1,000
- − Repairs & maintenance
- −$1,777
- − Management
- −$1,777
- − Depreciation
- −$5,815
- Taxable loss
- −$1,110
- Est. tax savings @ 24.0%
- +$266
- After-tax cash flow
- $2,479/yr
For passive investors: Depreciation is non-cash, so a rental often shows a tax loss while cash-flowing — sheltering income. Rental losses are passive: they offset passive income freely, and up to $25,000/yr can offset ordinary (W-2) income if you actively participate and your MAGI is under $100k (phasing out to $0 by $150k); unused losses carry forward. On sale, claimed depreciation is recaptured at up to 25%, and gains may owe capital-gains tax (a 1031 exchange can defer both). Figures are a year-1 estimate at your 24.0% rate — not tax advice; consult a CPA.
Schools (NCES district)
- District
- Charlotte-Mecklenburg Schools
- NCES district ID
- 3702970
- Math proficiency
- 42% ▼ -6.00%
- Reading proficiency
- 46% ▲ 1.00%
- Median HH income
- $57,175
- Composite
- 38.49/100
- National rank
- #4183
- State rank
- #85 of 178 in NC
Livability — Charlotte
- Score
- 78/100
- State rank
- #26
- US rank
- #2502
Category grades
Schools grade is shown separately in the Schools card above.
Census & demographics
- Census place
- Charlotte, NC
- County
- Mecklenburg County · 1,167,319 people
- City population
- 920,422
- Metro
- Charlotte-Concord-Gastonia, NC-SC
- Population (ZIP)
- 45,904
- Household income
- $58,146
- Rent vs Own
- Severe rent burden
- 3547.0
Population outlook (Mecklenburg County) Hauer SSP2
- Today (2025)
- 1,305,740 people
- By 2030
- 1,442,752 · +10.5%
- By 2040
- 1,722,441 · +31.9%
- By 2050
- 1,999,450 · +53.1%
- By 2075
- 2,642,495 · +102.4%
- By 2100
- 3,106,755 · +137.9%
Race, ethnicity, and origin ACS 2023
- Neighborhood character
- Diverse neighborhood (Simpson 0.66)
- Race & ethnicity
- Black 48% Hispanic / Latino 27% White 18% Two or more races 9% Asian 4%
- Hispanic origin (detail)
- Mexican 13% Puerto Rican 1% Dominican 2%
- Common ancestry
- Romanian 1% Lithuanian 1% Italian 1%
- Foreign-born
- 22% · Canada, Vietnam, China
- Languages at home
- 70% English-only · Spanish 23% Other Indo-European 1% Arabic 1%
Political lean MEDSL · Mecklenburg
- 2024 margin
- Solid D (+32.9) · D 65.6% · R 32.7% · Other 1.6%
- 2008→2024 swing
- +8.5pp toward D · 2008: 24.4pp · 2024: 32.9pp
- All cycles
- 2024: D+32.9 2020: D+35.1 2016: D+29.9 2012: D+22.5 2008: D+24.4
Not yet ingested
- Civics
- —
Market trends
- HPI YoY
- ▼ -88.12%
- Current HPI
- 265.9966
- Rent YoY
- ▲ 0.63%
- Metro
- Charlotte-Concord-Gastonia, NC-SC
- State GDP YoY
- ▲ 3.28%
- F500 in state
- 26
Industry mix (Fortune 500 HQ in NC)
| Industry | F500 HQs | Revenue |
|---|---|---|
| Financial Services | 2 | $213B |
|
||
| Retail | 2 | $95B |
|
||
| Industrial Conglomerate | 1 | $38B |
|
||
| Metals / Steel | 1 | $35B |
|
||
| Utilities | 1 | $30B |
|
||
| Industrial Machinery | 1 | $19B |
|
||
Price history
+445.7% since first listed9 events — show timeline
- 2026-06-10 Listed $199,900 CANOPYMLS as Distributed by MLS Grid
- 2026-05-29 Rental Removed $1,795 RENTLY
- 2026-05-24 Listed for Rent $1,795 RENTLY
- 2014-04-02 Sold (Public Records) $185,000 Public Records
- 2013-11-21 Sold (MLS) $36,000 CANOPYMLS as Distributed by MLS Grid
- 2013-10-15 Contingent — CANOPYMLS as Distributed by MLS Grid
- 2013-10-15 Delisted — CANOPYMLS as Distributed by MLS Grid
- 2013-10-10 Contingent — CANOPYMLS as Distributed by MLS Grid
- 2013-09-27 Listed $36,630 CANOPYMLS as Distributed by MLS Grid
Property tax history
+4.6%/yrLatest (2025): $1,759 · +2.8% YoY. Source: county tax records.
Cash-flow waterfall
monthlySold comps — $/sqft
last 12 mo · ≤1 miLoading sold comps…