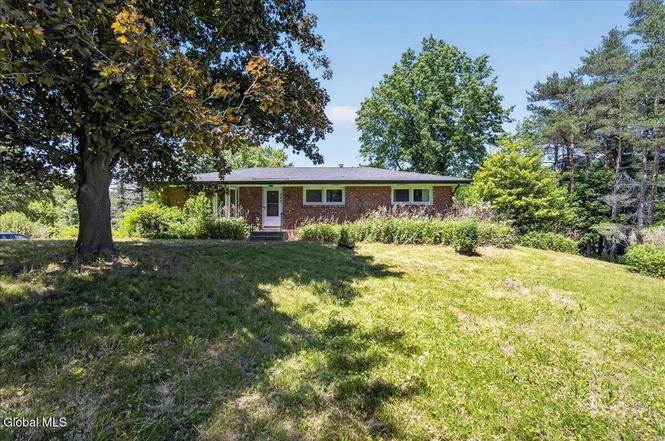
493 Altamont Rd · Voorheesville, NY
Flood risk 1/10 · Minimal
- FEMA flood zone
- X (unshaded)
- Chance of flooding over 30 yrs
- 0.0%
- Est. flood insurance / yr
- $473 – $860
Fire risk 3/10 · Minor
- Est. fire insurance / yr
- $691 – $1,283
Heat risk 3/10 · Minor
- Hot days now (above 96°F)
- 7 days/yr
- Hot days in 30 yrs
- 16 days/yr
Wind risk 2/10 · Minimal
- Chance of severe wind over 30 yrs
- 4.0%
Air-quality risk 1/10 · Minimal
- Unhealthy air days now
- 0 days/yr
- Unhealthy air days in 30 yrs
- 0 days/yr
Risk factors via First Street. Map © Google.
Why this score? — see what drove the C+ grade
The composite is a weighted blend of 9 inputs, each scored 0–100. Each bar is that input's sub-score; the figure is the points it added to the 100-point composite (weight × sub-score).
- ARV discount +15.0/15.0
- Cash flow +14.4/30.0
- Appreciation +10.0/10.0
- Schools +6.5/10.0
- DSCR +4.4/10.0
- 1% rule +3.8/10.0
- Livability +3.6/5.0
- Rent growth +2.5/5.0
- Condition / age +2.5/5.0
$250,000
🖨 Deal sheet 📄 Offer letter ✓ Due diligence
Listing remarks
Highest and best due 7pm Monday 6/15/26. Opportunity awaits with this solidly built 1961 brick ranch set on a spacious 1.8-acre lot offering privacy, mature trees, and endless potential. This home features 3 bedrooms and 1.5 baths across 1,248 square feet of main-level living, plus a full unfinished basement. Inside, you'll find a functional layout with great natural light and classic mid-century character, just waiting for your personal touch. The home is equipped with forced air heat and central air for year-round comfort. Outside, enjoy the peaceful setting with plenty of room for gardening, recreation, or future expansion. Conveniently located while still offering a private, tucked-a
Key facts
- Unfinished basement
- Natural light
- Forced air heat
Tags
Property features AI
Exterior
- Parking: Garage (1 space); Driveway parking; Under-residence parking; Stone parking surface; Total 4 parking spaces
- Utilities: Septic tank
- Home design: Single family residence
- Construction: Brick construction
- Exterior features: Shingle roof; Shed(s); Garage(s); Lot about 1.8 acres
Interior
- Kitchen: Built-in electric oven; Refrigerator
- Bedrooms: Two bedrooms on the first floor; Primary bedroom on the first floor
- Bathrooms: One full bathroom on the first floor; One half bathroom on the first floor
- Heating & cooling: Forced air oil heating; Central air conditioning
- Interior features: 6 total rooms; Full unfinished walk-out basement
Neighborhood map
What this means for you Summary
Snapshot
- This is a 3-bed/1.5-bath single-family listed at $250k.
Deal economics
- At list price, monthly cash flow is $52 ($630/yr) — positive.
- The deal already cash-flows at list — no discount required.
- To meet the 1% rule (rent ≥ 1% of price), the offer needs to be $221k (11.5% below list).
- Recommended offer: $221k (11.5% below list) — sets the bar for 1% rule.
- Cap rate 6.5% vs local median 1.6% in Voorheesville — top-decile yield for the area; either an underpriced asset or a hidden risk that comps aren't pricing in. Stress-test before assuming the spread holds.
Location & tenants
- Location reads 72/100 on livability (#369 in NY) — a middle-class / working-renter tenant base. Strengths: schools A+, crime A+, employment A+; Watch: cost of living D, amenities F, commute F.
- Voorheesville Central School District (rural): math 75% / reading 71% proficiency, ranked #89 of 590 in NY (top 15%) — strong family-tenant draw, lease renewals of 3-5y typical; only 7% free/reduced lunch — higher-income household profile.
- Market conditions: 47 active listings in the ZIP; 675 units permitted in Albany County in 2024 (451 in 5+ unit buildings).
Forward outlook
- In year one you build about $27k of equity ($2k loan paydown + $25k appreciation (10.0% local appreciation)).
- Albany County population projected at +9% by 2050 — modest demand growth; plan on rents tracking national, not racing it.
- At projected returns (10.0% appreciation + 3.0% rent growth), your $70k cash investment doubles in ~3 years — after that, you're playing with house money.
- By year 2, paydown + projected appreciation supports a ~$43k cash-out refi (75% LTV) — recoverable capital for the next deal without selling this one.
Negotiation context
- Only 5 days on market — expect competitive offers; lowballing is unlikely to land.
Questions for the listing agent
- Built in 1961 — when were the roof, HVAC, electrical panel, plumbing, and water heater last replaced?
- Is there a deadline driving the sale (1031 exchange, divorce, estate, relocation)? That informs how much negotiation room exists.
- Schools are A-rated — typically a magnet for longer-tenancy family renters. What's the average tenant stay here, and is there a school-zone premium baked into asking?
- What's the average days-on-market for RENTAL listings here right now (not sales)? A rising rental-DOM trend means longer vacancies and softer asking-rent achievability than the comps imply.
- What's the recent tenant-quality profile in this submarket — average credit score on applications, eviction rate, late-payment / NSF rate, and stable-employment percentage? A property-management company in the area should have these aggregated.
- How much new for-sale + rental construction is in the pipeline within 1–3 miles? Heavy new supply typically softens prices + rents 12–24 months out; constrained supply supports both.
Investment metrics
- 1% rule
- 0.88% ✗
- Cap rate
- 6.54%
- Cash-on-cash
- 0.90%
- DSCR
- 1.04
- GRM
- 9.4
CMA / ARV
- ARV (on-the-fly)
- $314,496
- Comps found
- 1
Show comp detail 1 sale within ~0.75 mi
| Address | Dist | Beds/Ba | Sqft | Sold | Price | $/sf | Match |
|---|---|---|---|---|---|---|---|
| 478 Altamont-voorheesville Rd | 0.09mi | 3/1.0 | 1,292 (+4%) | 19mo | $325,000 | $252 | 72 |
Match score weights: distance 35% · size 25% · config 20% · recency 20%. Top-matched comps best support the ARV.
Projected returns pro-forma
10.0% appreciation · 3.0% rent growth · sell at horizon
- IRR
- 24.9%
- Equity multiple
- 2.99×
- Total profit
- $139,512
- Equity at exit
- $225,220
- IRR
- 22.0%
- Equity multiple
- 6.83×
- Total profit
- $408,239
- Equity at exit
- $485,695
Cash invested: $70,000 (down + closing). Projections, not guarantees.
Landlord ↔ Tenant lean methodology
- Overall (STATE)
- 15 Strongly Tenant-Friendly
- State New York
- 15 Strongly Tenant-Friendly · D+10
- County
- — inherits STATE
- City
- — inherits STATE
ZIP-level market 12009
- Home prices YoY
- 7.0%
- Active inventory
- 47
- Price-to-rent
- 9.4×
Monthly cashflow live
- Estimated rent
- $2,212 medium interval (Pro) →
- Mortgage (P&I)
- −$1,311
- Tax from tax record
- −$280 /mo · $3,356/yr
- Insurance
- −$104
- HOA
- −$0
- Vacancy / Maint / Mgmt
- −$464
- Net cashflow
- $52
Break-even live
UW: 25.0% down · 7.5% · 30yr · 1.5% tax · 5.0% vac · 8.0% maint · 8.0% mgmt
Financing live
Cash to close
- Down payment
- $62,500
- Closing costs
- $7,500
- Reserves months
- —
- Total cash needed
- —
Loan-product check · same deal, 3 products live
Conventional
25% down · 7.5% · 30yr
- Down + closing
- —
- Monthly P&I
- —
- Monthly cashflow
- —
- DSCR
- —
- Eligible?
- —
Personal DTI + credit; lowest rate.
DSCR
20% down · 8.5% · 30yr
- Down + closing
- —
- Monthly P&I
- —
- Monthly cashflow
- —
- DSCR
- —
- Eligible?
- —
No personal income docs; deal must DSCR.
Hard money
10% down · 12.0% · 12mo
- Down + closing
- —
- Monthly P&I
- —
- Monthly cashflow
- —
- DSCR
- —
- Eligible?
- —
Short-term bridge; refi at stabilization.
Listing history 4 events
-
2026-06-16statusdays on market $250,000 Pending 5 DOM
-
2026-06-15days on market $250,000 Active 4 DOM
-
2026-06-14remarks 699-char remark
-
2026-06-14$250,000 Active 2 DOM
ⓘ Source: listings_history table (triggers on properties + properties_extension) + one-shot
backfill from property_details.listing_events for pre-trigger history.
Tax reassessment forecast NY · Partial reset (capped growth)
- Current annual tax
- $3,356 · $280/mo
- Projected year-2 tax
- $3,791 · $316/mo
- Expected delta
- +$434/yr (+$36/mo · 12.9%)
ⓘ Screening estimate from a state-policy table — verify with the county assessor before closing.
Climate risk First Street
- Flood 1/10 Low FEMA zone X (unshaded) · 0% chance over 30 yrs
- Wildfire 3/10 Moderate
- Heat 3/10 Moderate 7 d/yr ≥96°F today · 16 d/yr by 30 yrs out
- Wind 2/10 Low 4% chance of damaging wind over 30 yrs
- Air quality 1/10 Low 0 unhealthy d/yr today · 0 by 30 yrs out
Nearby sold comps map
Loading sold comps map…
Walkable amenities ~0.75 mi
Loading nearby amenities…
Taxation est. · year 1
- Rental income
- $26,542
- − Mortgage interest
- −$14,004
- − Property taxes
- −$3,356
- − Insurance
- −$1,250
- − Repairs & maintenance
- −$2,123
- − Management
- −$2,123
- − Depreciation
- −$7,273
- Taxable loss
- −$3,587
- Est. tax savings @ 24.0%
- +$861
- After-tax cash flow
- $1,491/yr
For passive investors: Depreciation is non-cash, so a rental often shows a tax loss while cash-flowing — sheltering income. Rental losses are passive: they offset passive income freely, and up to $25,000/yr can offset ordinary (W-2) income if you actively participate and your MAGI is under $100k (phasing out to $0 by $150k); unused losses carry forward. On sale, claimed depreciation is recaptured at up to 25%, and gains may owe capital-gains tax (a 1031 exchange can defer both). Figures are a year-1 estimate at your 24.0% rate — not tax advice; consult a CPA.
Schools (NCES district)
- District
- Voorheesville Central School District
- NCES district ID
- 3629670
- Math proficiency
- 75% ▼ -5.00%
- Reading proficiency
- 71% ▲ 1.00%
- Median HH income
- $86,855
- Composite
- 65.4/100
- National rank
- #482
- State rank
- #89 of 590 in NY
Livability — Voorheesville
- Score
- 72/100
- State rank
- #369
- US rank
- #6390
Category grades
Schools grade is shown separately in the Schools card above.
Census & demographics
- Population (ZIP)
- 8,068
Population outlook (Albany County) Hauer SSP2
- Today (2025)
- 320,794 people
- By 2030
- 327,401 · +2.1%
- By 2040
- 338,218 · +5.4%
- By 2050
- 348,467 · +8.6%
- By 2075
- 381,693 · +19.0%
- By 2100
- 393,809 · +22.8%
Race, ethnicity, and origin ACS 2023
- Neighborhood character
- Predominantly White (83%)
- Race & ethnicity
- White 83% Asian 7% Two or more races 5% Hispanic / Latino 3% Black 3%
- Common ancestry
- Romanian 8% Iranian 4% Lithuanian 4%
- Foreign-born
- 7% · Canada, China, South Korea
- Languages at home
- 92% English-only · Spanish 2% Other Asian/Pacific 2% Korean 1%
Political lean MEDSL · Albany
- 2024 margin
- Strong D (+25.8) · D 62.9% · R 37.1%
- 2008→2024 swing
- -3.6pp toward R · 2008: 29.4pp · 2024: 25.8pp
- All cycles
- 2024: D+25.8 2020: D+31.4 2016: D+24.3 2012: D+31.0 2008: D+29.4
Not yet ingested
- Civics
- —
Market trends
- HPI YoY
- ▲ 18.85%
- Current HPI
- 290.1144
- Rent YoY
- —
- Metro
- —
- State GDP YoY
- ▲ 2.60%
- F500 in state
- 92
Industry mix (Fortune 500 HQ in NY)
| Industry | F500 HQs | Revenue |
|---|---|---|
| Financial Services | 10 | $950B |
|
||
| Consumer Goods | 9 | $162B |
|
||
| Insurance | 4 | $225B |
|
||
| Telecommunications | 2 | $144B |
|
||
| Pharmaceuticals | 2 | $112B |
|
||
| Media / Entertainment | 2 | $69B |
|
||
Price history
1 event — show timeline
- 2026-06-11 Listed $250,000 Global MLS
Property tax history
-0.6%/yrLatest (2025): $3,356 · +5.9% YoY. Source: county tax records.
Cash-flow waterfall
monthlySold comps — $/sqft
last 12 mo · ≤1 miLoading sold comps…