901 Woodland St · Carrollton, MO
Flood risk 1/10 · Minimal
- FEMA flood zone
- X (unshaded)
- Chance of flooding over 30 yrs
- 0.0%
- Est. flood insurance / yr
- $507 – $1,088
Fire risk 3/10 · Minor
- Est. fire insurance / yr
- $1,054 – $1,958
Heat risk 4/10 · Minor
- Hot days now (above 108°F)
- 7 days/yr
- Hot days in 30 yrs
- 16 days/yr
Wind risk 2/10 · Minimal
- Chance of severe wind over 30 yrs
- —
Air-quality risk 1/10 · Minimal
- Unhealthy air days now
- 0 days/yr
- Unhealthy air days in 30 yrs
- 0 days/yr
Risk factors via First Street. Map © Google.
Why this score? — see what drove the A grade
The composite is a weighted blend of 9 inputs, each scored 0–100. Each bar is that input's sub-score; the figure is the points it added to the 100-point composite (weight × sub-score).
- Cash flow +30.0/30.0
- ARV discount +15.0/15.0
- DSCR +10.0/10.0
- Appreciation +10.0/10.0
- 1% rule +9.4/10.0
- Livability +3.7/5.0
- Schools +3.2/10.0
- Rent growth +2.5/5.0
- Condition / age +2.5/5.0
$59,000
🖨 Deal sheet 📄 Offer letter ✓ Due diligence
Listing remarks MLS
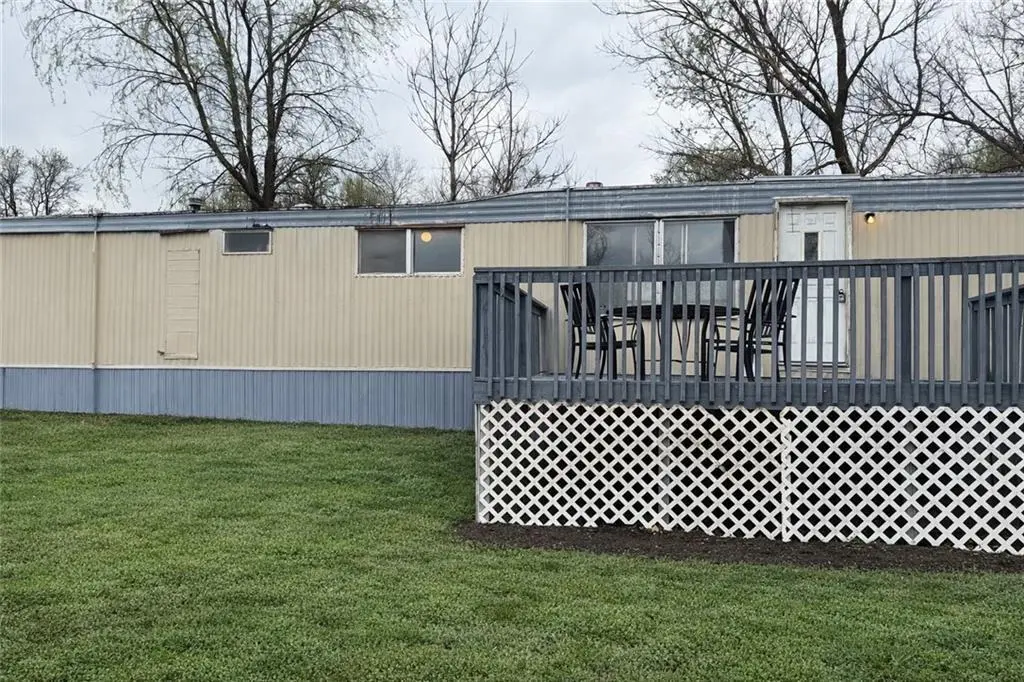
Affordable homeownership opportunity—own for under $60K! This 2 bed, 1 bath mobile home sits on a nice-sized lot and offers a great value for buyers or investors alike. Enjoy the spacious front deck, perfect for relaxing or entertaining, along with convenient gravel parking. Inside, you’ll find good-sized rooms with plenty of potential to make it your own. Whether you’re looking for a budget-friendly place to live or a rental investment, this property checks the boxes. Don’t miss out on this opportunity!
Key facts
- Good-sized rooms
- Nice-sized lot
- Spacious front deck
Tags
Neighborhood map
What this means for you Summary
Snapshot
- This is a 2-bed/1.0-bath other listed at $59k.
Deal economics
- At list price, monthly cash flow is $264 ($3k/yr) — positive.
- The deal already cash-flows at list — no discount required.
- Meets the 1% rule at list price ($850 rent vs $59k).
- Recommended offer: $55k (6.0% below list) — sets the bar for market timing.
- Cap rate 11.7% vs local median 4.6% in Carrollton — top-decile yield for the area; either an underpriced asset or a hidden risk that comps aren't pricing in. Stress-test before assuming the spread holds.
Location & tenants
- Location reads 73/100 on livability (#80 in MO) — a middle-class / working-renter tenant base. Strengths: cost of living A+, housing A+, crime A-; Watch: amenities F, commute F, employment F.
- Carrollton R-VII (town): math 31% / reading 46% proficiency, ranked #178 of 324 in MO (top 55%) — families likely to look elsewhere, expect single-tenant / working-renter base with shorter leases.
- Market conditions: 37 active listings in the ZIP; 1 comparable units currently listed for rent nearby; 24 units permitted in Carroll County in 2024 (0 in 5+ unit buildings).
Forward outlook
- In year one you build about $6k of equity ($408 loan paydown + $6k appreciation (10.0% local appreciation)).
- Carroll County population projected at -25% by 2050 — secular population decline; favor cash flow + early exit over multi-decade hold.
- At projected returns (10.0% appreciation + 3.0% rent growth), your $17k cash investment doubles in ~2 years — after that, you're playing with house money.
- By year 6, paydown + projected appreciation supports a ~$37k cash-out refi (75% LTV) — recoverable capital for the next deal without selling this one.
Negotiation context
- It's been on market 65 days — a 6% lower offer ($55k) is reasonable based on typical stale-listing flexibility.
Questions for the listing agent
- It's been on market 65 days. Have you received any prior offers? Is the seller open to a 6% concession, seller financing, or rate buy-down credit?
- Built in 1970 — when were the roof, HVAC, electrical panel, plumbing, and water heater last replaced?
- Why hasn't it sold? Are there any deal-killer items the seller is aware of (foundation, flood, title, zoning, code violations)?
- Is there a deadline driving the sale (1031 exchange, divorce, estate, relocation)? That informs how much negotiation room exists.
- What's the average days-on-market for RENTAL listings here right now (not sales)? A rising rental-DOM trend means longer vacancies and softer asking-rent achievability than the comps imply.
- What's the recent tenant-quality profile in this submarket — average credit score on applications, eviction rate, late-payment / NSF rate, and stable-employment percentage? A property-management company in the area should have these aggregated.
- How much new for-sale + rental construction is in the pipeline within 1–3 miles? Heavy new supply typically softens prices + rents 12–24 months out; constrained supply supports both.
Investment metrics
- 1% rule
- 1.44% ✓
- Cap rate
- 11.66%
- Cash-on-cash
- 19.16%
- DSCR
- 1.85
- GRM
- 5.8
CMA / ARV
- ARV (median comp)
- $83,799
- List price
- $59,000
- Delta
- -29.59%
- Verdict
- UNDERPRICED
- Comps
- 12 within 1.0 mi
Projected returns pro-forma
10.0% appreciation · 3.0% rent growth · sell at horizon
- IRR
- 38.6%
- Equity multiple
- 3.96×
- Total profit
- $48,945
- Equity at exit
- $53,152
- IRR
- 33.2%
- Equity multiple
- 8.93×
- Total profit
- $130,950
- Equity at exit
- $114,624
Cash invested: $16,520 (down + closing). Projections, not guarantees.
Landlord ↔ Tenant lean methodology
- Overall (STATE)
- 81 Strongly Landlord-Friendly
- State Missouri
- 81 Strongly Landlord-Friendly · R+10
- County
- — inherits STATE
- City
- — inherits STATE
ZIP-level market 64633
- Home prices YoY
- 18.8%
- Active inventory
- 37
- Price-to-rent
- 5.8×
Monthly cashflow live
- Estimated rent
- $850 medium interval (Pro) →
- Mortgage (P&I)
- −$309
- Tax est. 1.5%
- −$74 /mo · $885/yr
- Insurance
- −$25
- HOA
- −$0
- Vacancy / Maint / Mgmt
- −$178
- Net cashflow
- $264
Break-even live
UW: 25.0% down · 7.5% · 30yr · 1.5% tax · 5.0% vac · 8.0% maint · 8.0% mgmt
Financing live
Cash to close
- Down payment
- $14,750
- Closing costs
- $1,770
- Reserves months
- —
- Total cash needed
- —
Loan-product check · same deal, 3 products live
Conventional
25% down · 7.5% · 30yr
- Down + closing
- —
- Monthly P&I
- —
- Monthly cashflow
- —
- DSCR
- —
- Eligible?
- —
Personal DTI + credit; lowest rate.
DSCR
20% down · 8.5% · 30yr
- Down + closing
- —
- Monthly P&I
- —
- Monthly cashflow
- —
- DSCR
- —
- Eligible?
- —
No personal income docs; deal must DSCR.
Hard money
10% down · 12.0% · 12mo
- Down + closing
- —
- Monthly P&I
- —
- Monthly cashflow
- —
- DSCR
- —
- Eligible?
- —
Short-term bridge; refi at stabilization.
Rent comps 1 comps
| Address | Beds | Baths | Sqft | Rent | $/sqft | DOM | Units | Dist |
|---|---|---|---|---|---|---|---|---|
| 1108 E 10th St Unit B10 Carrollton, MO | 2.0 | 1.0 | 750 | $850 | $1.13 | 44d | 1 | 0.77mi |
Listing history 16 events
-
2026-06-18days on market $59,000 Active 65 DOM
-
2026-06-17days on market $59,000 Active 64 DOM
-
2026-06-16days on market $59,000 Active 63 DOM
-
2026-06-15days on market $59,000 Active 62 DOM
-
2026-06-13days on market $59,000 Active 60 DOM
-
2026-06-12days on market $59,000 Active 59 DOM
-
2026-06-09days on market $59,000 Active 56 DOM
-
2026-06-08days on market $59,000 Active 55 DOM
-
2026-06-07days on market $59,000 Active 54 DOM
-
2026-06-05days on market $59,000 Active 52 DOM
-
2026-06-04days on market $59,000 Active 50 DOM
-
2026-06-02days on market $59,000 Active 49 DOM
-
2026-06-01days on market $59,000 Active 48 DOM
-
2026-05-31days on market $59,000 Active 47 DOM
-
2026-04-14$59,000 Active 533-char remark
Show marketing remark (533 chars)
Affordable homeownership opportunity—own for under $60K! This 2 bed, 1 bath mobile home sits on a nice-sized lot and offers a great value for buyers or investors alike. Enjoy the spacious front deck, perfect for relaxing or entertaining, along with convenient gravel parking. Inside, you’ll find good-sized rooms with plenty of potential to make it your own. Whether you’re looking for a budget-friendly place to live or a rental investment, this property checks the boxes. Don’t miss out on this opportunity!
-
1995-03-01soldstatus
ⓘ Source: listings_history table (triggers on properties + properties_extension) + one-shot
backfill from property_details.listing_events for pre-trigger history.
Climate risk First Street
- Flood 1/10 Low FEMA zone X (unshaded) · 0% chance over 30 yrs
- Wildfire 3/10 Moderate
- Heat 4/10 Moderate 7 d/yr ≥108°F today · 16 d/yr by 30 yrs out
- Wind 2/10 Low
- Air quality 1/10 Low 0 unhealthy d/yr today · 0 by 30 yrs out
Nearby sold comps map
Loading sold comps map…
Walkable amenities ~0.75 mi
Loading nearby amenities…
Taxation est. · year 1
- Rental income
- $10,200
- − Mortgage interest
- −$3,305
- − Property taxes
- −$885
- − Insurance
- −$295
- − Repairs & maintenance
- −$816
- − Management
- −$816
- − Depreciation
- −$1,716
- Taxable income
- $2,367
- Est. tax owed @ 24.0%
- −$568
- After-tax cash flow
- $2,597/yr
For passive investors: Depreciation is non-cash, so a rental often shows a tax loss while cash-flowing — sheltering income. Rental losses are passive: they offset passive income freely, and up to $25,000/yr can offset ordinary (W-2) income if you actively participate and your MAGI is under $100k (phasing out to $0 by $150k); unused losses carry forward. On sale, claimed depreciation is recaptured at up to 25%, and gains may owe capital-gains tax (a 1031 exchange can defer both). Figures are a year-1 estimate at your 24.0% rate — not tax advice; consult a CPA.
Schools (NCES district)
- District
- Carrollton R-VII
- NCES district ID
- 2907380
- Math proficiency
- 31% ▼ -10.00%
- Reading proficiency
- 46% ▼ -6.00%
- Median HH income
- $39,568
- Composite
- 32.2/100
- National rank
- #5779
- State rank
- #178 of 324 in MO
Livability — Carrollton
- Score
- 73/100
- State rank
- #80
- US rank
- #5324
Category grades
Schools grade is shown separately in the Schools card above.
Census & demographics
- Census place
- Carrollton, MO
- City population
- 4,504
- Population (ZIP)
- 4,504
Population outlook (Carroll County) Hauer SSP2
- Today (2025)
- 8,269 people
- By 2030
- 7,866 · -4.9%
- By 2040
- 7,021 · -15.1%
- By 2050
- 6,213 · -24.9%
- By 2075
- 4,619 · -44.1%
- By 2100
- 3,249 · -60.7%
Race, ethnicity, and origin ACS 2023
- Neighborhood character
- Predominantly White (92%)
- Race & ethnicity
- White 92% Two or more races 6% Hispanic / Latino 3%
- Common ancestry
- Lithuanian 1% Slovak 1% Romanian 1%
- Foreign-born
- 0%
- Languages at home
- 99% English-only · Spanish 1%
Political lean MEDSL · Carroll
- 2024 margin
- Solid R (+64.5) · D 17.4% · R 81.9%
- 2008→2024 swing
- -33.2pp toward R · 2008: -31.3pp · 2024: -64.5pp
- All cycles
- 2024: R+64.5 2020: R+64.4 2016: R+62.7 2012: R+44.6 2008: R+31.3
Not yet ingested
- Civics
- —
Market trends
- HPI YoY
- ▲ 42.87%
- Current HPI
- 271.4099
- Rent YoY
- —
- Metro
- —
- State GDP YoY
- ▲ 1.84%
- F500 in state
- 20
Industry mix (Fortune 500 HQ in MO)
| Industry | F500 HQs | Revenue |
|---|---|---|
| Healthcare | 1 | $163B |
|
||
| Insurance | 1 | $21B |
|
||
| Industrial Technology | 1 | $17B |
|
||
| Retail | 1 | $16B |
|
||
| Industrial Distribution | 1 | $10B |
|
||
| Utilities | 1 | $9B |
|
||
Price history
2 events — show timeline
- 2026-04-14 Listed $59,000 Heartland MLS as Distributed by MLS Grid
- 1995-03-01 Sold (Public Records) — Public Records
Property tax history
-1.5%/yrLatest (2025): $66 · +0.2% YoY. Source: county tax records.
Cash-flow waterfall
monthlySold comps — $/sqft
last 12 mo · ≤1 miLoading sold comps…