 Fourplex
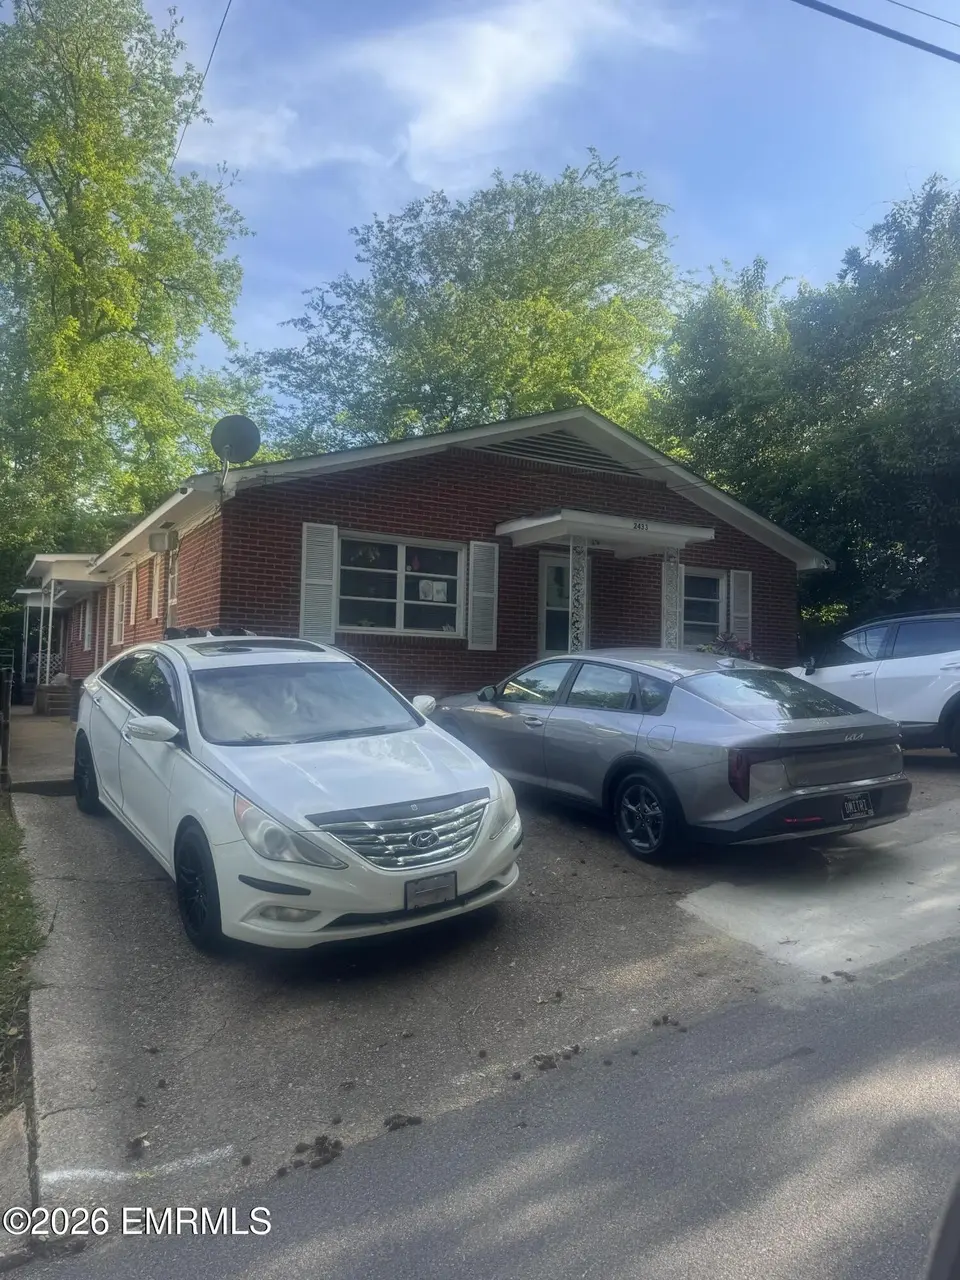
2433 24th Ave · Meridian, MS
Flood risk 6/10 · Moderate
- FEMA flood zone
- X (unshaded)
- Chance of flooding over 30 yrs
- 0.75%
- Est. flood insurance / yr
- $507 – $1,088
Fire risk 1/10 · Minimal
- Est. fire insurance / yr
- $1,241 – $2,305
Heat risk 7/10 · Major
- Hot days now (above 108°F)
- 7 days/yr
- Hot days in 30 yrs
- 21 days/yr
Wind risk 8/10 · Major
- Chance of severe wind over 30 yrs
- 80.0%
Air-quality risk 1/10 · Minimal
- Unhealthy air days now
- 0 days/yr
- Unhealthy air days in 30 yrs
- 0 days/yr
Risk factors via First Street. Map © Google.
Why this score? — see what drove the B- grade
The composite is a weighted blend of 9 inputs, each scored 0–100. Each bar is that input's sub-score; the figure is the points it added to the 100-point composite (weight × sub-score).
- Cash flow +30.0/30.0
- 1% rule +10.0/10.0
- DSCR +10.0/10.0
- ARV discount +7.5/15.0
- Livability +3.2/5.0
- Rent growth +2.5/5.0
- Condition / age +2.2/5.0
- Schools +1.2/10.0
- Appreciation +0.0/10.0
$179,900
🖨 Deal sheet 📄 Offer letter ✓ Due diligence
Multi-family units
County records classify this as Multi-Family (2-4 Unit). Listing-text estimate: 4 units. confirmed
Listing remarks MLS
INVESTMENT OPPORTUNITY - CHARMING 1BR/1BA ALL ELECTRIC FOURPLEX IN A PRIME LOCATION! Welcome to 2433 - 26th Street - a well maintained and income-producing fourplex that blends character, convenience, and strong rental potential. Whether you're expanding your portfolio or stepping into multifamily investing, this property offers a compelling opportunity. Don't miss your chance to own a versatile and dependable multifamily property. Schedule your private showing today and explore the possibilities at 2433 - 26th Street!
Key facts
- Multifamily property
- Income producing
- Well maintained
Tags
Neighborhood map
What this means for you Summary
Snapshot
- This is a 4 × 1.0-bed/1.0-bath units multifamily listed at $180k. Condition is rated fair.
Deal economics
- At list price, monthly cash flow is $2k ($26k/yr) — positive. Per door: $552/mo.
- The deal already cash-flows at list — no discount required.
- Meets the 1% rule at list price ($4k rent vs $180k).
- Recommended offer: $175k (3.0% below list) — sets the bar for market timing.
Location & tenants
- Location reads 64/100 on livability (#141 in MS) — a middle-class / working-renter tenant base. Strengths: cost of living A+, housing A; Watch: schools D, amenities F, commute F.
- Meridian Public Schools (town): math 13% / reading 17% proficiency, ranked #109 of 130 in MS (top 84%) — low school quality limits family demand, transient renter base, plan for 1-2y turnover; 85% free/reduced lunch — lower-income household profile, screen leases tightly.
- Market conditions: 54 active listings in the ZIP; lower-income renter base — watch delinquency; 18 units permitted in Lauderdale County in 2024 (0 in 5+ unit buildings).
- At $4,368/mo this rent would consume 125% of the median local household income ($42k/yr) (locally 566% of renters already pay >50% of income on rent) — very limited rent-growth headroom before tenants either downsize or default.
Forward outlook
- Local home prices are declining (-3.0%/yr); year-one equity from $1k of loan paydown is wiped out by about $5k of value loss. Plan a longer hold.
- Lauderdale County population projected at -18% by 2050 — secular population decline; favor cash flow + early exit over multi-decade hold.
- At projected returns (-3.0% appreciation + 3.0% rent growth), your $50k cash investment doubles in ~3 years — after that, you're playing with house money.
Negotiation context
- It's been on market 60 days — a 3% lower offer ($175k) is reasonable based on typical stale-listing flexibility.
Risks & watch-outs
- Climate carrying-cost: major flood risk; severe wind risk, 80% chance of damaging wind over 30y; extreme-heat days projected 7→21/yr by 2055 (HVAC capex compounding) — expect insurance premiums to compound above CPI over the hold.
Questions for the listing agent
- It's been on market 60 days. Have you received any prior offers? Is the seller open to a 3% concession, seller financing, or rate buy-down credit?
- Can we see the unit-by-unit rent roll, current vacancy, and any below-market leases? What's the average tenancy length?
- What capital expenditures (roof, boiler, parking lot, exteriors) have been made in the last 5 years, and what's planned in the next 2?
- Have any recent inspections been done? Can we get a copy of the seller's disclosures and any deferred-maintenance estimates?
- Built in 1964 — when were the roof, HVAC, electrical panel, plumbing, and water heater last replaced?
- Is there a deadline driving the sale (1031 exchange, divorce, estate, relocation)? That informs how much negotiation room exists.
- Schools are D-rated, which usually means shorter tenancies and higher turnover. Who's the typical renter profile here, and what's been the actual vacancy rate?
- What's the average days-on-market for RENTAL listings here right now (not sales)? A rising rental-DOM trend means longer vacancies and softer asking-rent achievability than the comps imply.
- What's the recent tenant-quality profile in this submarket — average credit score on applications, eviction rate, late-payment / NSF rate, and stable-employment percentage? A property-management company in the area should have these aggregated.
- How much new apartment / multifamily construction is in the pipeline within 1–3 miles? Heavy new supply (>2% of stock underway) typically softens rents 12–24 months out; light construction supports rent growth.
Investment metrics
- 1% rule
- 2.43% ✓
- Cap rate
- 21.02%
- Cash-on-cash
- 52.59%
- DSCR
- 3.34
- GRM
- 3.4
CMA / ARV
- ARV (median comp)
- $379,967
- List price
- $179,900
- Delta
- -52.65%
- Verdict
- UNDERPRICED
- Comps
- 1 within 2.0 mi
Projected returns pro-forma
-3.0% appreciation · 3.0% rent growth · sell at horizon
- IRR
- 50.6%
- Equity multiple
- 3.21×
- Total profit
- $111,509
- Equity at exit
- $26,824
- IRR
- 56.0%
- Equity multiple
- 6.53×
- Total profit
- $278,407
- Equity at exit
- $15,554
Cash invested: $50,372 (down + closing). Projections, not guarantees.
Landlord ↔ Tenant lean methodology
- Overall (STATE)
- 90 Strongly Landlord-Friendly
- State Mississippi
- 90 Strongly Landlord-Friendly · R+11
- County
- — inherits STATE
- City
- — inherits STATE
ZIP-level market 39301
- Active inventory
- 54
- Price-to-rent
- 13.7×
Monthly cashflow live
- Estimated rent
- $4,368 medium interval (Pro) →
- Mortgage (P&I)
- −$943
- Tax est. 1.5%
- −$225 /mo · $2,698/yr
- Insurance
- −$75
- HOA
- −$0
- Vacancy / Maint / Mgmt
- −$917
- Net cashflow
- $2,207
Break-even live
4-unit breakdown (identical units grouped — click to expand)
| Units | Beds | Baths | Est. rent |
|---|---|---|---|
| 4× units | 1.0 | 1 | $4,368 |
| #1 | 1.0 | 1 | $1,092 |
| #2 | 1.0 | 1 | $1,092 |
| #3 | 1.0 | 1 | $1,092 |
| #4 | 1.0 | 1 | $1,092 |
| Total (4 units) | $4,368 | ||
UW: 25.0% down · 7.5% · 30yr · 1.5% tax · 5.0% vac · 8.0% maint · 8.0% mgmt
Financing live
Cash to close
- Down payment
- $44,975
- Closing costs
- $5,397
- Reserves months
- —
- Total cash needed
- —
Loan-product check · same deal, 3 products live
Conventional
25% down · 7.5% · 30yr
- Down + closing
- —
- Monthly P&I
- —
- Monthly cashflow
- —
- DSCR
- —
- Eligible?
- —
Personal DTI + credit; lowest rate.
DSCR
20% down · 8.5% · 30yr
- Down + closing
- —
- Monthly P&I
- —
- Monthly cashflow
- —
- DSCR
- —
- Eligible?
- —
No personal income docs; deal must DSCR.
Hard money
10% down · 12.0% · 12mo
- Down + closing
- —
- Monthly P&I
- —
- Monthly cashflow
- —
- DSCR
- —
- Eligible?
- —
Short-term bridge; refi at stabilization.
Listing history 15 events
-
2026-06-19days on market $179,900 Active 60 DOM
-
2026-06-18days on market $179,900 Active 59 DOM
-
2026-06-17days on market $179,900 Active 58 DOM
-
2026-06-16days on market $179,900 Active 57 DOM
-
2026-06-15days on market $179,900 Active 56 DOM
-
2026-06-14days on market $179,900 Active 54 DOM
-
2026-06-12days on market $179,900 Active 53 DOM
-
2026-06-09days on market $179,900 Active 50 DOM
-
2026-06-08days on market $179,900 Active 49 DOM
-
2026-06-07days on market $179,900 Active 48 DOM
-
2026-06-02days on market $179,900 Active 43 DOM
-
2026-06-01days on market $179,900 Active 42 DOM
-
2026-05-31days on market $179,900 Active 41 DOM
-
2026-05-30days on market $179,900 Active 40 DOM
-
2026-04-20$179,900 Active 525-char remark
Show marketing remark (525 chars)
INVESTMENT OPPORTUNITY - CHARMING 1BR/1BA ALL ELECTRIC FOURPLEX IN A PRIME LOCATION! Welcome to 2433 - 26th Street - a well maintained and income-producing fourplex that blends character, convenience, and strong rental potential. Whether you're expanding your portfolio or stepping into multifamily investing, this property offers a compelling opportunity. Don't miss your chance to own a versatile and dependable multifamily property. Schedule your private showing today and explore the possibilities at 2433 - 26th Street!
ⓘ Source: listings_history table (triggers on properties + properties_extension) + one-shot
backfill from property_details.listing_events for pre-trigger history.
Climate risk First Street
- Flood 6/10 Major FEMA zone X (unshaded) · 75% chance over 30 yrs
- Wildfire 1/10 Low
- Heat 7/10 Severe 7 d/yr ≥108°F today · 21 d/yr by 30 yrs out
- Wind 8/10 Severe 80% chance of damaging wind over 30 yrs
- Air quality 1/10 Low 0 unhealthy d/yr today · 0 by 30 yrs out
Nearby sold comps map
Loading sold comps map…
Walkable amenities ~0.75 mi
Loading nearby amenities…
Taxation est. · year 1
- Rental income
- $52,416
- − Mortgage interest
- −$10,077
- − Property taxes
- −$2,698
- − Insurance
- −$900
- − Repairs & maintenance
- −$4,193
- − Management
- −$4,193
- − Depreciation
- −$5,233
- Taxable income
- $25,121
- Est. tax owed @ 24.0%
- −$6,029
- After-tax cash flow
- $20,461/yr
For passive investors: Depreciation is non-cash, so a rental often shows a tax loss while cash-flowing — sheltering income. Rental losses are passive: they offset passive income freely, and up to $25,000/yr can offset ordinary (W-2) income if you actively participate and your MAGI is under $100k (phasing out to $0 by $150k); unused losses carry forward. On sale, claimed depreciation is recaptured at up to 25%, and gains may owe capital-gains tax (a 1031 exchange can defer both). Figures are a year-1 estimate at your 24.0% rate — not tax advice; consult a CPA.
Condition & rehab AI · 1 photo
This fourplex presents significant opportunities for renovation and improvement, with major repairs and updates needed to enhance its resale and rental value.
Repairs flagged
- Major exterior siding — Significant wear and tear
- Major roof — No visible damage, but age is implied
- Major flooring — No visible flooring, but wear is implied
- Major interior walls/paint — No visible interior, but paint wear is implied
- Major kitchen — No visible kitchen, but wear is implied
- Major bathrooms — No visible bathrooms, but wear is implied
- Major systems — No visible systems, but age is implied
Value-add opportunities
- Both paint exterior — Enhances curb appeal and property value
- Both repair roof — Improves property value and reduces maintenance costs
- Both replace flooring — Enhances interior aesthetics and property value
- Both paint interior — Enhances interior aesthetics and property value
- Both update kitchen — Enhances functionality and property value
- Both update bathrooms — Enhances functionality and property value
- Both update systems — Improves property value and reduces maintenance costs
Renovation cost estimate screening
| Repair item | Severity | Est. cost |
|---|---|---|
| exterior siding · Significant wear and tear | Major | $15,000–50,000 |
| roof · No visible damage, but age is implied | Major | $15,000–50,000 |
| flooring · No visible flooring, but wear is implied | Major | $15,000–50,000 |
| interior walls/paint · No visible interior, but paint wear is implied | Major | $15,000–50,000 |
| kitchen · No visible kitchen, but wear is implied | Major | $15,000–50,000 |
| bathrooms · No visible bathrooms, but wear is implied | Major | $15,000–50,000 |
| systems · No visible systems, but age is implied | Major | $15,000–50,000 |
| Total estimated repair cost · 7 items | $105,000–350,000 |
Value-add ROI direction
- Both paint exterior — Enhances curb appeal and property value ↑
- Both repair roof — Improves property value and reduces maintenance costs ↑
- Both replace flooring — Enhances interior aesthetics and property value ↑
- Both paint interior — Enhances interior aesthetics and property value ↑
- Both update kitchen — Enhances functionality and property value ↑
- Both update bathrooms — Enhances functionality and property value ↑
- Both update systems — Improves property value and reduces maintenance costs ↑
ⓘ Cost ranges are severity-bucket heuristics (US national rule-of-thumb). Get contractor quotes + a written scope before underwriting a rehab budget.
Schools (NCES district)
- District
- Meridian Public Schools
- NCES district ID
- 2802910
- Math proficiency
- 13% ▼ -12.00%
- Reading proficiency
- 17% ▼ -4.00%
- Median HH income
- $30,236
- Composite
- 11.87/100
- National rank
- #9673
- State rank
- #109 of 130 in MS
Livability — Meridian
- Score
- 64/100
- State rank
- #141
- US rank
- #14839
Category grades
Schools grade is shown separately in the Schools card above.
Census & demographics
- Census place
- Meridian, MS
- County
- Lauderdale County · 42,445 people
- City population
- 42,445
- Metro
- Meridian, MS
- Population (ZIP)
- 20,807
- Household income
- $41,766
- Rent vs Own
- Severe rent burden
- 566.0
Population outlook (Lauderdale County) Hauer SSP2
- Today (2025)
- 75,158 people
- By 2030
- 72,770 · -3.2%
- By 2040
- 67,309 · -10.4%
- By 2050
- 61,797 · -17.8%
- By 2075
- 49,790 · -33.8%
- By 2100
- 39,797 · -47.0%
Race, ethnicity, and origin ACS 2023
- Neighborhood character
- Majority White (56%)
- Race & ethnicity
- White 56% Black 40% Two or more races 2% Hispanic / Latino 2%
- Common ancestry
- Slovak 2% Serbian 2% Lithuanian 1%
- Foreign-born
- 1% · Canada
- Languages at home
- 98% English-only · Spanish 2%
Political lean MEDSL · Lauderdale
- 2024 margin
- Strong R (+21.2) · D 39.0% · R 60.2%
- 2008→2024 swing
- -2.3pp toward R · 2008: -18.9pp · 2024: -21.2pp
- All cycles
- 2024: R+21.2 2020: R+16.0 2016: R+23.0 2012: R+15.5 2008: R+18.9
Not yet ingested
- Civics
- —
Market trends
- HPI YoY
- ▼ -64.11%
- Current HPI
- 116.4831
- Rent YoY
- —
- Metro
- Meridian, MS
- State GDP YoY
- —
- F500 in state
- 0
Price history
1 event — show timeline
- 2026-04-20 Listed $179,900 EMR
Cash-flow waterfall
monthlySold comps — $/sqft
last 12 mo · ≤1 miLoading sold comps…