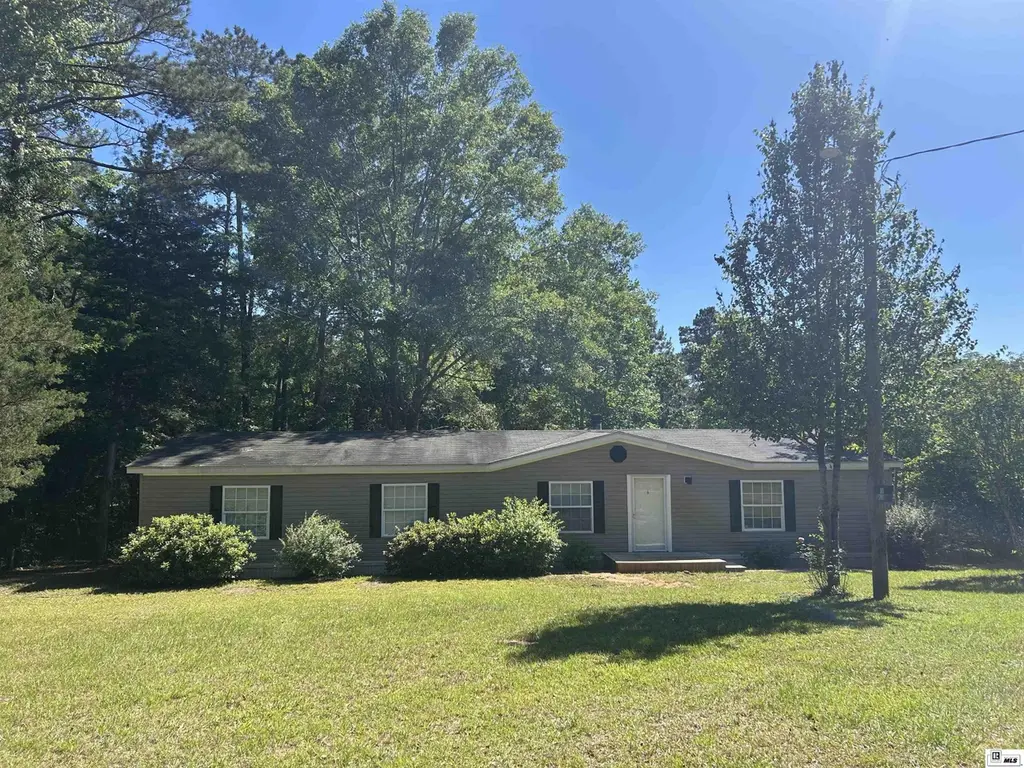
133 Jo Bayles Rd · Farmerville, LA
Flood risk No data
- FEMA flood zone
- —
- Chance of flooding over 30 yrs
- —
- Est. flood insurance / yr
- —
Fire risk No data
- Est. fire insurance / yr
- —
Heat risk No data
- Hot days now (above threshold)
- —
- Hot days in 30 yrs
- —
Wind risk No data
- Chance of severe wind over 30 yrs
- —
Air-quality risk No data
- Unhealthy air days now
- —
- Unhealthy air days in 30 yrs
- —
Risk factors via First Street. Map © Google.
Why this score? — see what drove the C grade
The composite is a weighted blend of 9 inputs, each scored 0–100. Each bar is that input's sub-score; the figure is the points it added to the 100-point composite (weight × sub-score).
- Cash flow +24.3/30.0
- DSCR +7.8/10.0
- ARV discount +7.5/15.0
- 1% rule +5.1/10.0
- Appreciation +4.8/10.0
- Livability +2.9/5.0
- Rent growth +2.5/5.0
- Condition / age +2.5/5.0
- Schools +1.3/10.0
$129,500
🖨 Deal sheet 📄 Offer letter ✓ Due diligence
Listing remarks MLS
Great fixer upper OR would be a great investment property!!! Lots of potential for this 3 bedroom 2 bathroom home in Downsville. .
Key facts
- New water tank
- Fresh finishes
- New hvac system
Tags
Property features AI
Finance
- Other: Directions provided: Hwy 15 to Hwy 552 N; Turn R on Ruggs Bluff Rd; L on Jo Bayles
- HOA & community: No association amenities
Exterior
- Parking: Open parking; Gravel parking area
- Security: Smoke detectors
- Utilities: Public water; Septic tank; Natural gas not available
- Home design: Manufactured home (double wide); One level, entry at level 1; Residential property
- Construction: Vinyl siding; Asphalt roof; Crawl space foundation; Built as manufactured home (double wide)
- Exterior features: Covered patio/porch; Wood fencing; Landscaped, irregular lot; Unimproved road frontage and surface; Storage structure on the property
Interior
- Kitchen: Dishwasher; Refrigerator; Electric range
- Bedrooms: 3 bedrooms on the main level
- Bathrooms: 2 full bathrooms, both on the main level
- Heating & cooling: Central air (electric); Electric heating; Wood heating
- Interior features: Walk-in closets; Double pane windows with blinds; Fireplace in the living room
- Laundry & utility: Electric water heater
Neighborhood map
What this means for you Summary
Snapshot
- This is a 3-bed/2.0-bath manufactured listed at $130k.
Deal economics
- At list price, monthly cash flow is $260 ($3k/yr) — positive.
- The deal already cash-flows at list — no discount required.
- Meets the 1% rule at list price ($1k rent vs $130k).
- Recommended offer: $126k (3.0% below list) — sets the bar for market timing.
- Cap rate 8.7% vs local median 5.6% in Farmerville — top-decile yield for the area; either an underpriced asset or a hidden risk that comps aren't pricing in. Stress-test before assuming the spread holds.
Location & tenants
- Location reads 57/100 on livability (#321 in LA) — a working-class tenant base; expect higher turnover. Strengths: cost of living A+, housing A+; Watch: health & safety D, crime F, amenities F.
- Union Parish (rural): math 12% / reading 20% proficiency, ranked #74 of 98 in LA (top 76%) — low school quality limits family demand, transient renter base, plan for 1-2y turnover; 76% free/reduced lunch — lower-income household profile, screen leases tightly.
- Market conditions: 36 active listings in the ZIP; 2 units permitted in Union Parish in 2024 (0 in 5+ unit buildings).
Forward outlook
- In year one you build about $424 of equity ($895 loan paydown + $-471 appreciation (-0.4% local appreciation)).
- Union County population projected at -14% by 2050 — secular population decline; favor cash flow + early exit over multi-decade hold.
- At projected returns (-0.4% appreciation + 3.0% rent growth), your $36k cash investment doubles in ~8 years — after that, you're playing with house money.
Negotiation context
- It's been on market 37 days — a 3% lower offer ($126k) is reasonable based on typical stale-listing flexibility.
- 3 sale attempts since 5y ago with the ask held roughly flat each time — persistent listings suggest the price (not the market) is what's stuck; bring a comps-based counter.
Questions for the listing agent
- It's been on market 37 days. Have you received any prior offers? Is the seller open to a 3% concession, seller financing, or rate buy-down credit?
- Is there a deadline driving the sale (1031 exchange, divorce, estate, relocation)? That informs how much negotiation room exists.
- Crime grade is F in this area — have there been break-ins, vandalism, or insurance claims at this property in the last 3 years? What carrier currently insures it and at what premium?
- What's the average days-on-market for RENTAL listings here right now (not sales)? A rising rental-DOM trend means longer vacancies and softer asking-rent achievability than the comps imply.
- What's the recent tenant-quality profile in this submarket — average credit score on applications, eviction rate, late-payment / NSF rate, and stable-employment percentage? A property-management company in the area should have these aggregated.
- How much new for-sale + rental construction is in the pipeline within 1–3 miles? Heavy new supply typically softens prices + rents 12–24 months out; constrained supply supports both.
Investment metrics
- 1% rule
- 1.01% ✓
- Cap rate
- 8.70%
- Cash-on-cash
- 8.60%
- DSCR
- 1.38
- GRM
- 8.2
CMA / ARV
No comps found within radius.
Projected returns pro-forma
-0.36% appreciation · 3.0% rent growth · sell at horizon
- IRR
- 6.2%
- Equity multiple
- 1.29×
- Total profit
- $10,513
- Equity at exit
- $35,266
- IRR
- 11.8%
- Equity multiple
- 2.24×
- Total profit
- $44,803
- Equity at exit
- $40,568
Cash invested: $36,260 (down + closing). Projections, not guarantees.
Landlord ↔ Tenant lean methodology
- Overall (STATE)
- 90 Strongly Landlord-Friendly
- State Louisiana
- 90 Strongly Landlord-Friendly · R+12
- County
- — inherits STATE
- City
- — inherits STATE
ZIP-level market 71234
- Home prices YoY
- -0.2%
- Active inventory
- 36
- Price-to-rent
- 8.2×
Monthly cashflow live
- Estimated rent
- $1,314 medium interval (Pro) →
- Mortgage (P&I)
- −$679
- Tax from tax record
- −$45 /mo · $543/yr
- Insurance
- −$54
- HOA
- −$0
- Vacancy / Maint / Mgmt
- −$276
- Net cashflow
- $260
Break-even live
UW: 25.0% down · 7.5% · 30yr · 1.5% tax · 5.0% vac · 8.0% maint · 8.0% mgmt
Financing live
Cash to close
- Down payment
- $32,375
- Closing costs
- $3,885
- Reserves months
- —
- Total cash needed
- —
Loan-product check · same deal, 3 products live
Conventional
25% down · 7.5% · 30yr
- Down + closing
- —
- Monthly P&I
- —
- Monthly cashflow
- —
- DSCR
- —
- Eligible?
- —
Personal DTI + credit; lowest rate.
DSCR
20% down · 8.5% · 30yr
- Down + closing
- —
- Monthly P&I
- —
- Monthly cashflow
- —
- DSCR
- —
- Eligible?
- —
No personal income docs; deal must DSCR.
Hard money
10% down · 12.0% · 12mo
- Down + closing
- —
- Monthly P&I
- —
- Monthly cashflow
- —
- DSCR
- —
- Eligible?
- —
Short-term bridge; refi at stabilization.
Listing history 24 events
-
2026-06-19days on market $129,500 Active 37 DOM
-
2026-06-18days on market $129,500 Active 36 DOM
-
2026-06-18remarks 419-char remark
-
2026-06-17days on market $129,500 Active 35 DOM
-
2026-06-16days on market $129,500 Active 34 DOM
-
2026-06-15days on market $129,500 Active 33 DOM
-
2026-06-14days on market $129,500 Active 31 DOM
-
2026-06-13remarks 411-char remark
-
2026-06-13pricedays on market $129,500 Active 30 DOM
-
2026-06-10days on market $134,500 Active 28 DOM
-
2026-06-09days on market $134,500 Active 27 DOM
-
2026-06-08days on market $134,500 Active 26 DOM
-
2026-06-07days on market $134,500 Active 25 DOM
-
2026-06-05days on market $134,500 Active 22 DOM
-
2026-06-02days on market $134,500 Active 20 DOM
-
2026-06-01days on market $134,500 Active 19 DOM
-
2026-05-31days on market $134,500 Active 18 DOM
-
2026-05-30days on market $134,500 Active 17 DOM
-
2026-05-13$134,500 Active 397-char remark
-
2025-09-11price $150,000
-
2025-07-22$155,000 Active
-
2022-07-25soldstatus Closed
Show marketing remark (130 chars)
Great fixer upper OR would be a great investment property!!! Lots of potential for this 3 bedroom 2 bathroom home in Downsville. .
-
2022-04-12historical
Show marketing remark (130 chars)
Great fixer upper OR would be a great investment property!!! Lots of potential for this 3 bedroom 2 bathroom home in Downsville. .
-
2021-04-08$25,000
Show marketing remark (130 chars)
Great fixer upper OR would be a great investment property!!! Lots of potential for this 3 bedroom 2 bathroom home in Downsville. .
ⓘ Source: listings_history table (triggers on properties + properties_extension) + one-shot
backfill from property_details.listing_events for pre-trigger history.
Tax reassessment forecast LA · Resets to sale price
- Current annual tax
- $543 · $45/mo
- Projected year-2 tax
- $712 · $59/mo
- Expected delta
- +$169/yr (+$14/mo · 31.1%)
ⓘ Screening estimate from a state-policy table — verify with the county assessor before closing.
Nearby sold comps map
Loading sold comps map…
Walkable amenities ~0.75 mi
Loading nearby amenities…
Taxation est. · year 1
- Rental income
- $15,770
- − Mortgage interest
- −$7,254
- − Property taxes
- −$543
- − Insurance
- −$648
- − Repairs & maintenance
- −$1,262
- − Management
- −$1,262
- − Depreciation
- −$3,767
- Taxable income
- $1,035
- Est. tax owed @ 24.0%
- −$248
- After-tax cash flow
- $2,870/yr
For passive investors: Depreciation is non-cash, so a rental often shows a tax loss while cash-flowing — sheltering income. Rental losses are passive: they offset passive income freely, and up to $25,000/yr can offset ordinary (W-2) income if you actively participate and your MAGI is under $100k (phasing out to $0 by $150k); unused losses carry forward. On sale, claimed depreciation is recaptured at up to 25%, and gains may owe capital-gains tax (a 1031 exchange can defer both). Figures are a year-1 estimate at your 24.0% rate — not tax advice; consult a CPA.
Schools (NCES district)
- District
- Union Parish
- NCES district ID
- 2201770
- Math proficiency
- 12% ▼ -37.00%
- Reading proficiency
- 20% ▼ -34.00%
- Median HH income
- $37,279
- Composite
- 13.35/100
- National rank
- #9537
- State rank
- #74 of 98 in LA
Livability — Farmerville
- Score
- 57/100
- State rank
- #321
- US rank
- #21826
Category grades
Schools grade is shown separately in the Schools card above.
Census & demographics
- Population (ZIP)
- 5,237
Population outlook (Union County) Hauer SSP2
- Today (2025)
- 21,722 people
- By 2030
- 21,226 · -2.3%
- By 2040
- 20,026 · -7.8%
- By 2050
- 18,682 · -14.0%
- By 2075
- 15,725 · -27.6%
- By 2100
- 12,509 · -42.4%
Race, ethnicity, and origin ACS 2023
- Neighborhood character
- Predominantly White (86%)
- Race & ethnicity
- White 86% Two or more races 9% Black 5%
- Common ancestry
- Romanian 5% Lithuanian 2% Slovak 1%
- Foreign-born
- 0%
- Languages at home
- 99% English-only · Spanish 1%
Political lean MEDSL · Union
- 2024 margin
- Solid R (+57.0) · D 21.1% · R 78.0%
- 2008→2024 swing
- -15.4pp toward R · 2008: -41.5pp · 2024: -57.0pp
- All cycles
- 2024: R+57.0 2020: R+51.4 2016: R+48.5 2012: R+41.7 2008: R+41.5
Not yet ingested
- Civics
- —
Market trends
- HPI YoY
- ▼ -0.36%
- Current HPI
- 146.452
- Rent YoY
- —
- Metro
- —
- State GDP YoY
- ▲ 3.29%
- F500 in state
- 10
Industry mix (Fortune 500 HQ in LA)
| Industry | F500 HQs | Revenue |
|---|---|---|
| Telecommunications | 2 | $23B |
|
||
| Utilities | 1 | $12B |
|
||
| Wholesale / Distribution | 1 | $5B |
|
||
| Advertising | 1 | $2B |
|
||
Price history
+418.0% since first listed7 events — show timeline
- 2026-06-11 Price Changed $129,500 NELABOR
- 2026-05-13 Listed $134,500 NELABOR
- 2025-09-11 Price Changed $150,000 NELABOR
- 2025-07-22 Listed $155,000 NELABOR
- 2022-07-25 Sold (MLS) — NELABOR
- 2022-04-12 Delisted — NELABOR
- 2021-04-08 Listed $25,000 NELABOR
Property tax history
+2.4%/yrLatest (2025): $543 · +0.0% YoY. Source: county tax records.
Cash-flow waterfall
monthlySold comps — $/sqft
last 12 mo · ≤1 miLoading sold comps…