3920 101st Ter N · Pinellas Park, FL
Flood risk 6/10 · Moderate
- FEMA flood zone
- X (unshaded)
- Chance of flooding over 30 yrs
- 0.56%
- Est. flood insurance / yr
- $507 – $1,088
Fire risk 1/10 · Minimal
- Est. fire insurance / yr
- $947 – $1,759
Heat risk 10/10 · Severe
- Hot days now (above 107°F)
- 6 days/yr
- Hot days in 30 yrs
- 22 days/yr
Wind risk 10/10 · Severe
- Chance of severe wind over 30 yrs
- 99.0%
Air-quality risk 3/10 · Minor
- Unhealthy air days now
- 3 days/yr
- Unhealthy air days in 30 yrs
- 3 days/yr
Risk factors via First Street. Map © Google.
Why this score? — see what drove the D grade
The composite is a weighted blend of 9 inputs, each scored 0–100. Each bar is that input's sub-score; the figure is the points it added to the 100-point composite (weight × sub-score).
- Cash flow +13.1/30.0
- ARV discount +7.5/15.0
- 1% rule +5.9/10.0
- Schools +4.3/10.0
- DSCR +3.9/10.0
- Livability +3.9/5.0
- Condition / age +2.5/5.0
- Rent growth +1.2/5.0
- Appreciation +0.0/10.0
$175,000
🖨 Deal sheet (PDF) 📄 Offer letter ✓ Due diligence
Listing remarks MLS
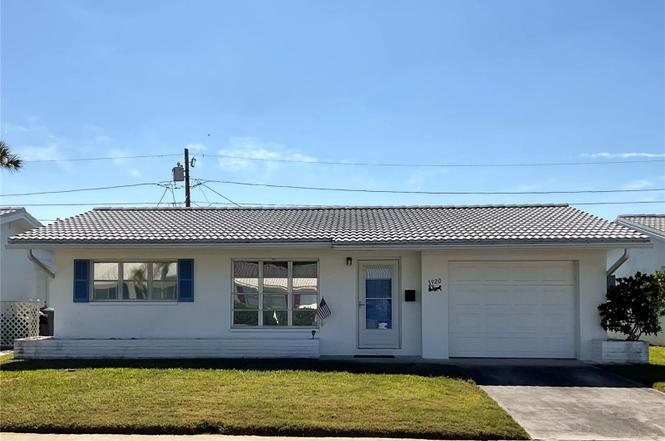
NICE CLEAN HOME 2 BEDROOM. 1 BATH, 1 CAR GARAGE, RANGE, REFRIGERATOR, REPLACED, NEWER C/H/A/ ROOF ABOUT 3YRS OLD. ALL THE WORK HAS BEEN DONE. CLOSE TO CLUBHOUSE AND HEATED POOL, NEAR SHOPPING, AIRPORTS, & I-275, CALL OFFICE FOR APPT. THANK YOU FOR SHOWING THIS LOVEY HOME.
Key facts
- Glass pass through
- Laundry area
- Walk-in closet
Tags
Property features AI
Finance
- Other: Lease restrictions apply
- Financial info: Total annual association fees $5,616
- HOA & community: Monthly condo fee $468; Association amenities include clubhouse, pool, shuffleboard court, cable TV; Association fee covers cable TV, internet, pool, sewer, water, trash, management, maintenance (structure & grounds), common area taxes, escrow reserves; Buyer/association approval required; Community features: clubhouse, pool, sidewalks, street lights, irrigation with reclaimed water, golf carts allowed, association recreation owned; Pets allowed (dogs and cats), max pet weight ~101 lbs
Exterior
- Parking: Attached garage (1 car) with garage door opener; Off-street parking; Common parking available; Garage dimensions approximately 13 x 16
- Utilities: Public water; Public sewer; Electricity connected; Cable connected; Water connected; Sewer connected
- Home design: Single family residence (condo zoning); One story; Faces north
- Construction: Block construction; Tile roof; Slab foundation; Built area about 1,390 square feet
- Exterior features: Patio; Private mailbox; Rain gutters; Sidewalk
Interior
- Kitchen: Range; Microwave; Refrigerator; Electric water heater
- Bedrooms: 2 bedrooms
- Bathrooms: 1 full bathroom
- Heating & cooling: Central heating (electric); Central air conditioning
- Interior features: Thermostat; Walk-in closets; Window treatments; Family room
- Laundry & utility: Washer hookup; Dryer hookup (electric); Laundry area in garage
Neighborhood map
What this means for you Summary
Snapshot
- This is a 2-bed/1.0-bath condo listed at $175k.
Deal economics
- At list price, monthly cash flow is $-5 ($-59/yr) — negative.
- To cash-flow at today's rent, offer at most $174k (0.5% below list).
- Meets the 1% rule at list price ($2k rent vs $175k).
- Recommended offer: $154k (12.0% below list) — sets the bar for market timing.
- Cap rate 6.3% vs local median 4.1% in Pinellas Park — top-decile yield for the area; either an underpriced asset or a hidden risk that comps aren't pricing in. Stress-test before assuming the spread holds.
Location & tenants
- Location reads 78/100 on livability (#170 in FL, #2,546 nationally) — a middle-class / working-renter tenant base. Strengths: commute A+, cost of living A+, housing A+; Watch: employment D+, amenities F.
- Pinellas (suburban): math 51% / reading 51% proficiency, ranked #31 of 73 in FL (top 42%) — acceptable for families but not a draw, mixed tenant base, ~2y average lease.
- Zoned schools: Pinellas Central Elementary School (math 51% / reading 45%, grade D, #1,171 of 2,144 statewide, top 55%, 498 students, 64% FRL); Fitzgerald Middle School (math 50% / reading 47%, grade C-, #274 of 571 statewide, top 50%, 1,033 students, 62% FRL); Pinellas Park High School (math 28% / reading 35%, grade F, #424 of 667 statewide, top 64%, 1,919 students, 57% FRL).
- Market conditions: Rents falling (-5.3%/yr); 203 active listings in the ZIP; 16 comparable units currently listed for rent nearby; rentals leasing fast (median 10d on market — plan ~1-2 weeks tenant-placement turnaround); 2,676 units permitted in Pinellas County in 2024 (1,422 in 5+ unit buildings).
- This rent runs 35% of the median local income ($66k/yr) — at the standard rent-burdened threshold; future hikes will face affordability resistance.
Forward outlook
- Local home prices are declining (-3.0%/yr); year-one equity from $1k of loan paydown is wiped out by about $5k of value loss. Plan a longer hold.
- Pinellas County population projected at +14% by 2050 — modest demand growth; plan on rents tracking national, not racing it.
Negotiation context
- It's been on market 137 days — a 12% lower offer ($154k) is reasonable based on typical stale-listing flexibility.
- 2 sale attempts since 21y ago; this cycle's ask has dropped $45k (20%) from the opening price — seller is motivated, your offer sets the floor, not the list.
- Current owner paid $116k; list at $175k implies a 51% gain — meaningful room to come down on a strong offer.
Risks & watch-outs
- Watch-outs: HOA is 24% of rent.
- Climate carrying-cost: major flood risk; severe wind risk, 99% chance of damaging wind over 30y; extreme-heat days projected 6→22/yr by 2055 (HVAC capex compounding) — expect insurance premiums to compound above CPI over the hold.
Questions for the listing agent
- What do current leases actually rent for vs. the listed asking? Can we see a recent rent roll and the last 12 months of T-12 income?
- It's been on market 137 days. Have you received any prior offers? Is the seller open to a 12% concession, seller financing, or rate buy-down credit?
- Built in 1970 — when were the roof, HVAC, electrical panel, plumbing, and water heater last replaced?
- What does the HOA fee cover, when was the last increase, and are there any pending special assessments or reserve-fund shortfalls?
- Any open or pending special assessments — roof, HVAC, plumbing, elevator, façade? What's the per-unit balance and payoff schedule, and is the seller paying it off at close or rolling it to the buyer?
- Why hasn't it sold? Are there any deal-killer items the seller is aware of (foundation, flood, title, zoning, code violations)?
- Is there a deadline driving the sale (1031 exchange, divorce, estate, relocation)? That informs how much negotiation room exists.
- Schools are D-rated, which usually means shorter tenancies and higher turnover. Who's the typical renter profile here, and what's been the actual vacancy rate?
- The area grade is low — what's the realistic commute time and amenity access for the typical tenant pool here? Any planned neighborhood developments (good or bad) we should know about?
- What's the average days-on-market for RENTAL listings here right now (not sales)? A rising rental-DOM trend means longer vacancies and softer asking-rent achievability than the comps imply.
- What's the recent tenant-quality profile in this submarket — average credit score on applications, eviction rate, late-payment / NSF rate, and stable-employment percentage? A property-management company in the area should have these aggregated.
- How much new apartment / multifamily construction is in the pipeline within 1–3 miles? Heavy new supply (>2% of stock underway) typically softens rents 12–24 months out; light construction supports rent growth.
Investment metrics
- 1% rule
- 1.09% ✓
- Cap rate
- 6.26%
- Cash-on-cash
- -0.12%
- DSCR
- 0.99
- GRM
- 7.6
CMA / ARV
No comps found within radius.
Projected returns pro-forma
-3.0% appreciation · 0.0% rent growth · sell at horizon
- IRR
- -20.7%
- Equity multiple
- 0.31×
- Total profit
- $-34,055
- Equity at exit
- $26,093
- IRR
- -26.0%
- Equity multiple
- -0.04×
- Total profit
- $-50,821
- Equity at exit
- $15,131
Cash invested: $49,000 (down + closing). Projections, not guarantees.
Landlord ↔ Tenant lean methodology
- Overall (STATE)
- 87 Strongly Landlord-Friendly
- State Florida
- 87 Strongly Landlord-Friendly · R+3
- County
- — inherits STATE
- City
- — inherits STATE
ZIP-level market 33782
- Rents YoY
- -5.3%
- Active inventory
- 203
- Price-to-rent
- 7.6×
Monthly cashflow live
- Estimated rent
- $1,911 high interval (Pro) →
- Mortgage (P&I)
- −$918
- Tax from tax record
- −$56 /mo · $671/yr
- Insurance
- −$73
- HOA
- −$468
- Vacancy / Maint / Mgmt
- −$401
- Net cashflow
- $-5
Break-even live
Sensitivity live
| Price | -10% $94 | -5% $45 | +0% $-5 | +5% $-54 | +10% $-104 |
|---|---|---|---|---|---|
| Rent | -10% $-156 | -5% $-80 | +0% $-5 | +5% $71 | +10% $146 |
| Rate | -1.0pp $83 | -0.5pp $40 | base $-5 | +0.5pp $-50 | +1.0pp $-96 |
UW: 25.0% down · 7.5% · 30yr · 1.5% tax · 5.0% vac · 8.0% maint · 8.0% mgmt
Financing live
Cash to close
- Down payment
- $43,750
- Closing costs
- $5,250
- Reserves months
- —
- Total cash needed
- —
Loan-product check · same deal, 3 products live
Conventional
25% down · 7.5% · 30yr
- Down + closing
- —
- Monthly P&I
- —
- Monthly cashflow
- —
- DSCR
- —
- Eligible?
- —
Personal DTI + credit; lowest rate.
DSCR
20% down · 8.5% · 30yr
- Down + closing
- —
- Monthly P&I
- —
- Monthly cashflow
- —
- DSCR
- —
- Eligible?
- —
No personal income docs; deal must DSCR.
Hard money
10% down · 12.0% · 12mo
- Down + closing
- —
- Monthly P&I
- —
- Monthly cashflow
- —
- DSCR
- —
- Eligible?
- —
Short-term bridge; refi at stabilization.
Rent comps 16 comps
| Address | Beds | Baths | Sqft | Rent | $/sqft | DOM | Units | Dist |
|---|---|---|---|---|---|---|---|---|
| 9505 49th St N Pinellas Park, FL | 1.0–3.0 | 1.0–2.0 | 1049 | $2,273 | $2.17 | 0d | 20 | 0.79mi |
| 9911 Dahlia St #38 Pinellas Park, FL | 2.0 | 1.0 | 850 | $1,300 | $1.53 | 9d | 1 | 0.86mi |
| 4701 88th Ave N Pinellas Park, FL | 1.0–2.0 | 1.0–2.0 | 855 | $1,853 | $2.17 | 12d | 20 | 0.92mi |
| 4973 91st Ave Unit C Pinellas Park, FL | 2.0 | 2.0 | 875 | $1,475 | $1.69 | 16d | 1 | 1.04mi |
| 4973 91st Ave Unit 12 (C) Pinellas Park, FL | 2.0 | 2.0 | 875 | $1,475 | $1.69 | 16d | 1 | 1.04mi |
| 5200 Springwood Blvd Pinellas Park, FL | 1.0 | 1.0 | 700 | $1,350 | $1.93 | 0d | 4 | 1.05mi |
| 4355 84th Ave N Pinellas Park, FL | 1.0 | 1.0 | 700 | $1,550 | $2.21 | 4d | 10 | 1.06mi |
| 10321 Larchmont Pl N Pinellas Park, FL | 2.0 | 1.0 | 840 | $1,700 | $2.02 | 26d | 1 | 1.20mi |
| 4940 87th Ave Unit C Pinellas Park, FL | 2.0 | 1.0 | 700 | $2,600 | $3.71 | 26d | 1 | 1.21mi |
| 10770 US Highway 19 N #605 Pinellas Park, FL | 2.0 | 2.0 | 1000 | $1,800 | $1.80 | 26d | 1 | 1.26mi |
| 2901 Gandy Blvd N Pinellas Park, FL | 1.0–2.0 | 1.0–2.0 | 940 | $2,424 | $2.58 | 0d | 12 | 1.27mi |
| 3110 Grand Ave Pinellas Park, FL | 1.0–3.0 | 1.0–2.0 | 1104 | $2,467 | $2.23 | 0d | 35 | 1.31mi |
| 8400 49th St N Pinellas Park, FL | 1.0–2.0 | 1.0–2.0 | 707 | $1,749 | $2.47 | 0d | 21 | 1.32mi |
| 2790 Grand Ave Saint Petersburg, FL | 1.0–3.0 | 1.0–2.0 | 1017 | $2,806 | $2.76 | 0d | 15 | 1.36mi |
| 2903 Gandy Blvd St. Petersburg, FL | 2.0 | 2.0 | 1055 | $2,012 | $1.91 | 0d | 1 | 1.41mi |
| 5641 94th Ter N Pinellas Park, FL | 3.0 | 2.0 | 1066 | $2,200 | $2.06 | 9d | 1 | 1.43mi |
HOA detail condo
- Monthly dues
- $468 · $5,616/yr
- Likely covers
- pool
- Assessments
- None detected in remarks — confirm with the listing agent.
Listing history 28 events
-
2026-06-22days on market $175,000 Active 137 DOM
-
2026-06-18days on market $175,000 Active 134 DOM
-
2026-06-17days on market $175,000 Active 133 DOM
-
2026-06-16days on market $175,000 Active 132 DOM
-
2026-06-15days on market $175,000 Active 131 DOM
-
2026-06-13days on market $175,000 Active 129 DOM
-
2026-06-09days on market $175,000 Active 125 DOM
-
2026-06-08days on market $175,000 Active 124 DOM
-
2026-06-07days on market $175,000 Active 123 DOM
-
2026-06-04days on market $175,000 Active 120 DOM
-
2026-06-03days on market $175,000 Active 119 DOM
-
2026-06-01days on market $175,000 Active 117 DOM
-
2026-05-31days on market $175,000 Active 116 DOM
-
2026-05-22price $175,000
-
2026-05-14price $180,000
-
2026-04-29price $185,000
-
2026-04-24price $190,000
-
2026-04-16price $195,000
-
2026-04-07price $198,500
-
2026-03-26price $199,500
-
2026-03-19price $204,500
-
2026-03-12price $209,500
-
2026-03-05price $219,500
-
2026-02-04$220,000 Active
-
2005-03-01soldstatus $115,900
-
2005-02-25soldstatus $115,900 277-char remark
Show marketing remark (277 chars)
NICE CLEAN HOME 2 BEDROOM. 1 BATH, 1 CAR GARAGE, RANGE, REFRIGERATOR, REPLACED, NEWER C/H/A/ ROOF ABOUT 3YRS OLD. ALL THE WORK HAS BEEN DONE. CLOSE TO CLUBHOUSE AND HEATED POOL, NEAR SHOPPING, AIRPORTS, & I-275, CALL OFFICE FOR APPT. THANK YOU FOR SHOWING THIS LOVEY HOME.
-
2005-01-19$119,000 277-char remark
Show marketing remark (277 chars)
NICE CLEAN HOME 2 BEDROOM. 1 BATH, 1 CAR GARAGE, RANGE, REFRIGERATOR, REPLACED, NEWER C/H/A/ ROOF ABOUT 3YRS OLD. ALL THE WORK HAS BEEN DONE. CLOSE TO CLUBHOUSE AND HEATED POOL, NEAR SHOPPING, AIRPORTS, & I-275, CALL OFFICE FOR APPT. THANK YOU FOR SHOWING THIS LOVEY HOME.
-
2001-08-23soldstatus $58,000
ⓘ Source: listings_history table (triggers on properties + properties_extension) + one-shot
backfill from property_details.listing_events for pre-trigger history.
Tax reassessment forecast FL · Resets to sale price
- Current annual tax
- $671 · $56/mo
- Projected year-2 tax
- $1,452 · $121/mo
- Expected delta
- +$781/yr (+$65/mo · 116.5%)
ⓘ Screening estimate from a state-policy table — verify with the county assessor before closing.
Climate risk First Street
- Flood 6/10 Major FEMA zone X (unshaded) · 56% chance over 30 yrs
- Wildfire 1/10 Low
- Heat 10/10 Extreme 6 d/yr ≥107°F today · 22 d/yr by 30 yrs out
- Wind 10/10 Extreme 99% chance of damaging wind over 30 yrs
- Air quality 3/10 Moderate 3 unhealthy d/yr today · 3 by 30 yrs out
Nearby sold comps map
Loading sold comps map…
Walkable amenities ~0.75 mi
Loading nearby amenities…
Taxation est. · year 1
- Rental income
- $22,931
- − Mortgage interest
- −$9,803
- − Property taxes
- −$671
- − Insurance
- −$875
- − Repairs & maintenance
- −$1,834
- − Management
- −$1,834
- − HOA
- −$5,616
- − Depreciation
- −$5,091
- Taxable loss
- −$2,793
- Est. tax savings @ 24.0%
- +$670
- After-tax cash flow
- $611/yr
For passive investors: Depreciation is non-cash, so a rental often shows a tax loss while cash-flowing — sheltering income. Rental losses are passive: they offset passive income freely, and up to $25,000/yr can offset ordinary (W-2) income if you actively participate and your MAGI is under $100k (phasing out to $0 by $150k); unused losses carry forward. On sale, claimed depreciation is recaptured at up to 25%, and gains may owe capital-gains tax (a 1031 exchange can defer both). Figures are a year-1 estimate at your 24.0% rate — not tax advice; consult a CPA.
Schools (NCES district)
- District
- Pinellas
- NCES district ID
- 1201560
- Math proficiency
- 51% ▼ -5.00%
- Reading proficiency
- 51% ▼ -3.00%
- Median HH income
- $46,270
- Composite
- 43.27/100
- National rank
- #3046
- State rank
- #31 of 73 in FL
Livability — Pinellas Park
- Score
- 78/100
- State rank
- #170
- US rank
- #2546
Category grades
Schools grade is shown separately in the Schools card above.
Census & demographics
- Census place
- Pinellas Park, FL
- County
- Pinellas County · 939,478 people
- City population
- 50,533
- Metro
- Tampa-St. Petersburg-Clearwater, FL
- Population (ZIP)
- 22,461
- Household income
- $66,461
- Rent vs Own
- Severe rent burden
- 486.0
Population outlook (Pinellas County) Hauer SSP2
- Today (2025)
- 1,027,532 people
- By 2030
- 1,063,586 · +3.5%
- By 2040
- 1,125,020 · +9.5%
- By 2050
- 1,168,637 · +13.7%
- By 2075
- 1,265,188 · +23.1%
- By 2100
- 1,260,357 · +22.7%
Race, ethnicity, and origin ACS 2023
- Neighborhood character
- Predominantly White (68%)
- Race & ethnicity
- White 68% Hispanic / Latino 12% Asian 12% Two or more races 8% Black 5%
- Hispanic origin (detail)
- Mexican 3% Puerto Rican 2% Cuban 2%
- Common ancestry
- Lithuanian 3% Italian 3% Romanian 2%
- Foreign-born
- 17% · Canada, Vietnam, China
- Languages at home
- 78% English-only · Spanish 9% Vietnamese 7% Other Indo-European 2%
Political lean MEDSL · Pinellas
- 2024 margin
- Lean R (+5.2) · D 46.9% · R 52.1%
- 2008→2024 swing
- -13.5pp toward R · 2008: 8.3pp · 2024: -5.2pp
- All cycles
- 2024: R+5.2 2020: D+0.2 2016: R+1.1 2012: D+5.6 2008: D+8.3
Not yet ingested
- Civics
- —
Market trends
- HPI YoY
- ▼ -250.17%
- Current HPI
- 314.1689
- Rent YoY
- ▼ -5.28%
- Metro
- Tampa-St. Petersburg-Clearwater, FL
- State GDP YoY
- ▲ 3.28%
- F500 in state
- 36
Industry mix (Fortune 500 HQ in FL)
| Industry | F500 HQs | Revenue |
|---|---|---|
| Industrial Technology | 2 | $29B |
|
||
| Insurance | 2 | $17B |
|
||
| Retail | 1 | $60B |
|
||
| Technology Distribution | 1 | $58B |
|
||
| Homebuilding | 1 | $35B |
|
||
| Technology Manufacturing | 1 | $35B |
|
||
Price history
+201.7% since first listed15 events — show timeline
- 2026-05-22 Price Changed $175,000 Stellar MLS as Distributed by MLS Grid
- 2026-05-14 Price Changed $180,000 Stellar MLS as Distributed by MLS Grid
- 2026-04-29 Price Changed $185,000 Stellar MLS as Distributed by MLS Grid
- 2026-04-24 Price Changed $190,000 Stellar MLS as Distributed by MLS Grid
- 2026-04-16 Price Changed $195,000 Stellar MLS as Distributed by MLS Grid
- 2026-04-07 Price Changed $198,500 Stellar MLS as Distributed by MLS Grid
- 2026-03-26 Price Changed $199,500 Stellar MLS as Distributed by MLS Grid
- 2026-03-19 Price Changed $204,500 Stellar MLS as Distributed by MLS Grid
- 2026-03-12 Price Changed $209,500 Stellar MLS as Distributed by MLS Grid
- 2026-03-05 Price Changed $219,500 Stellar MLS as Distributed by MLS Grid
- 2026-02-04 Listed $220,000 Stellar MLS as Distributed by MLS Grid
- 2005-03-01 Sold (Public Records) $115,900 Public Records
- 2005-02-25 Sold (MLS) $115,900 Stellar MLS as Distributed by MLS Grid
- 2005-01-19 Listed $119,000 Stellar MLS as Distributed by MLS Grid
- 2001-08-23 Sold (Public Records) $58,000 Public Records
Property tax history
-4.1%/yrLatest (2025): $671 · +4.2% YoY. Source: county tax records.
Cash-flow waterfall
monthlySold comps — $/sqft
last 12 mo · ≤1 miLoading sold comps…