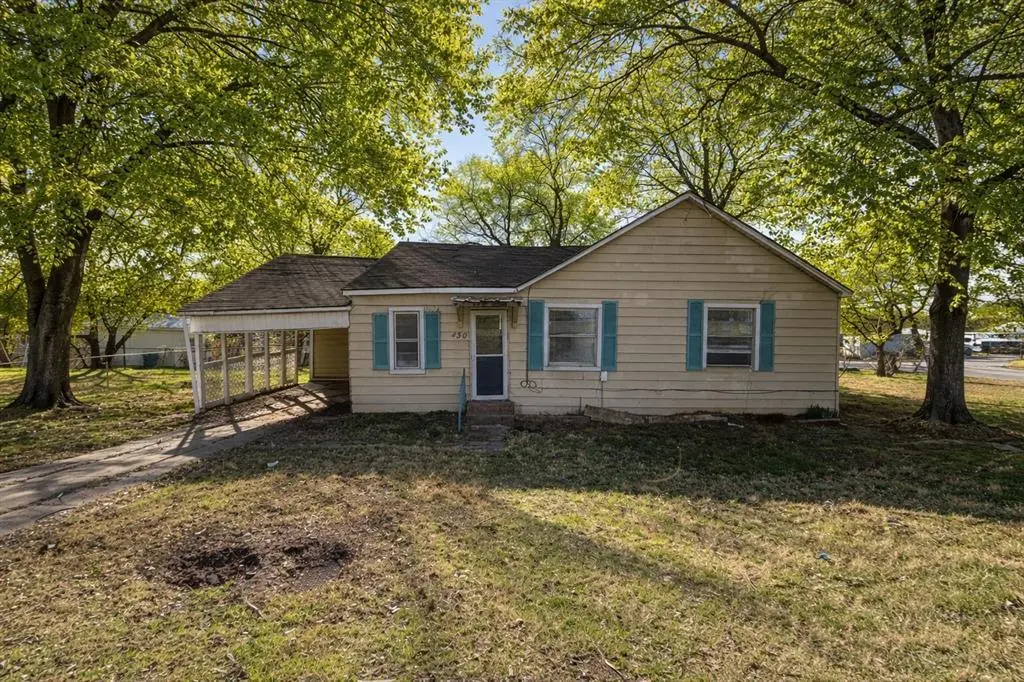
430 E Parnell St · Denison, TX
Flood risk 1/10 · Minimal
- FEMA flood zone
- X (unshaded)
- Chance of flooding over 30 yrs
- 0.0%
- Est. flood insurance / yr
- $507 – $1,088
Fire risk 4/10 · Minor
- Est. fire insurance / yr
- $1,222 – $2,270
Heat risk 6/10 · Moderate
- Hot days now (above 109°F)
- 7 days/yr
- Hot days in 30 yrs
- 21 days/yr
Wind risk 4/10 · Minor
- Chance of severe wind over 30 yrs
- 18.0%
Air-quality risk 3/10 · Minor
- Unhealthy air days now
- 3 days/yr
- Unhealthy air days in 30 yrs
- 3 days/yr
Risk factors via First Street. Map © Google.
Why this score? — see what drove the D grade
The composite is a weighted blend of 9 inputs, each scored 0–100. Each bar is that input's sub-score; the figure is the points it added to the 100-point composite (weight × sub-score).
- ARV discount +14.8/15.0
- Cash flow +10.0/30.0
- Schools +3.7/10.0
- Livability +3.7/5.0
- DSCR +2.8/10.0
- Rent growth +2.5/5.0
- Condition / age +2.5/5.0
- 1% rule +2.3/10.0
- Appreciation +0.0/10.0
$179,000
🖨 Deal sheet 📄 Offer letter ✓ Due diligence
Listing remarks MLS
Charming home for sale in a quiet neighborhood featuring a large, fenced backyard and convenient carport. This versatile floor plan could easily be converted into a three-bedroom home, with the front room serving as a bedroom, den, or home office to fit your needs. Perfect as a starter home or investment property, this home offers brand new paint and flooring throughout, giving it a fresh, move-in-ready feel. Enjoy outdoor space for pets, play, or entertaining, all in a peaceful setting. Affordable, flexible, and freshly updated. A great opportunity you don’t want to miss!
Key facts
- Carport
- Outdoor space
- Fenced backyard
Tags
Neighborhood map
What this means for you Summary
Snapshot
- This is a 3-bed/1.0-bath single-family listed at $179k.
Deal economics
- At list price, monthly cash flow is $-108 ($-1k/yr) — negative.
- To cash-flow at today's rent, offer at most $160k (10.7% below list).
- To meet the 1% rule (rent ≥ 1% of price), the offer needs to be $130k (27.3% below list).
- Recommended offer: $130k (27.3% below list) — sets the bar for 1% rule.
- Cap rate 5.6% vs local median 3.8% in Denison — top-decile yield for the area; either an underpriced asset or a hidden risk that comps aren't pricing in. Stress-test before assuming the spread holds.
Location & tenants
- Location reads 73/100 on livability (#221 in TX) — a middle-class / working-renter tenant base. Strengths: cost of living A+, housing A+, crime A; Watch: health & safety D+, schools D-, amenities F.
- Denison ISD (urban): math 43% / reading 44% proficiency, ranked #315 of 826 in TX (top 38%) — families likely to look elsewhere, expect single-tenant / working-renter base with shorter leases.
- Market conditions: 165 active listings in the ZIP; 13 comparable units currently listed for rent nearby; rentals lingering (median 44d on market — plan ~5-8 weeks vacancy on turnover, expect pricing pressure); 62% of comp listings sitting > 30 days — soft ceiling on asking rent; solid renter incomes; 2,272 units permitted in Grayson County in 2024 (750 in 5+ unit buildings).
Forward outlook
- Local home prices are declining (-3.0%/yr); year-one equity from $1k of loan paydown is wiped out by about $5k of value loss. Plan a longer hold.
- Grayson County population projected at +12% by 2050 — modest demand growth; plan on rents tracking national, not racing it.
Negotiation context
- It's been on market 121 days — a 12% lower offer ($158k) is reasonable based on typical stale-listing flexibility.
Risks & watch-outs
- Watch-outs: built in 1940 — expect roof / HVAC / electrical / plumbing capex.
- Climate carrying-cost: extreme-heat days projected 7→21/yr by 2055 (HVAC capex compounding) — expect insurance premiums to compound above CPI over the hold.
Questions for the listing agent
- What do current leases actually rent for vs. the listed asking? Can we see a recent rent roll and the last 12 months of T-12 income?
- It's been on market 121 days. Have you received any prior offers? Is the seller open to a 27% concession, seller financing, or rate buy-down credit?
- Built in 1940 — when were the roof, HVAC, electrical panel, plumbing, and water heater last replaced?
- Why hasn't it sold? Are there any deal-killer items the seller is aware of (foundation, flood, title, zoning, code violations)?
- Is there a deadline driving the sale (1031 exchange, divorce, estate, relocation)? That informs how much negotiation room exists.
- Schools are D-rated, which usually means shorter tenancies and higher turnover. Who's the typical renter profile here, and what's been the actual vacancy rate?
- The area grade is low — what's the realistic commute time and amenity access for the typical tenant pool here? Any planned neighborhood developments (good or bad) we should know about?
- What's the average days-on-market for RENTAL listings here right now (not sales)? A rising rental-DOM trend means longer vacancies and softer asking-rent achievability than the comps imply.
- What's the recent tenant-quality profile in this submarket — average credit score on applications, eviction rate, late-payment / NSF rate, and stable-employment percentage? A property-management company in the area should have these aggregated.
- How much new for-sale + rental construction is in the pipeline within 1–3 miles? Heavy new supply typically softens prices + rents 12–24 months out; constrained supply supports both.
Investment metrics
- 1% rule
- 0.73% ✗
- Cap rate
- 5.57%
- Cash-on-cash
- -2.59%
- DSCR
- 0.88
- GRM
- 11.5
CMA / ARV
- ARV (median comp)
- $213,400
- List price
- $179,000
- Delta
- -16.12%
- Verdict
- UNDERPRICED
- Comps
- 20 within 1.0 mi
Show comp detail 12 sales within ~0.75 mi
| Address | Dist | Beds/Ba | Sqft | Sold | Price | $/sf | Match |
|---|---|---|---|---|---|---|---|
| 423 E Washington St | 0.05mi | 3/1.5 | 1,024 (+3%) | 15mo | $225,000 | $220 | 79 |
| 724 N Houston Ave | 0.41mi | 3/1.0 | 973 (-2%) | 15mo | $200,000 | $206 | 64 |
| 425 E Elm St | 0.09mi | 3/2.0 | 924 (-7%) | 22mo | $163,000 | $176 | 61 |
| 715 E Maple Row | 0.46mi | 3/1.0 | 1,030 (+3%) | 17mo | $140,000 | $136 | 59 |
| 205 Martin Luther King St | 0.48mi | 3/1.0 | 979 (-2%) | 22mo | $195,000 | $199 | 56 |
| 727 E Maple Row | 0.48mi | 2/1.0 (-1) | 948 (-5%) | 19mo | $74,000 | $78 | 49 |
| 519 E Gandy St | 0.56mi | 3/2.0 | 1,132 (+14%) | 1mo | $135,000 | $119 | 46 |
| 406 Martin Luther King St | 0.66mi | 3/1.0 | 965 (-3%) | 23mo | $200,000 | $207 | 45 |
| 40 Vaughn Dr | 0.61mi | 2/1.0 (-1) | 1,123 (+13%) | 6mo | $149,500 | $133 | 40 |
| 709 E Gandy St | 0.62mi | 2/1.0 (-1) | 884 (-11%) | 10mo | $145,000 | $164 | 39 |
| 1008 N Burnett Ave | 0.62mi | 2/1.0 (-1) | 876 (-12%) | 15mo | $130,450 | $149 | 34 |
| 416 W Johnson St | 0.72mi | 3/2.0 | 1,074 (+8%) | 20mo | $199,996 | $186 | 33 |
Match score weights: distance 35% · size 25% · config 20% · recency 20%. Top-matched comps best support the ARV.
Projected returns pro-forma
-3.0% appreciation · 3.0% rent growth · sell at horizon
- IRR
- -20.6%
- Equity multiple
- 0.28×
- Total profit
- $-35,924
- Equity at exit
- $26,689
- IRR
- -13.9%
- Equity multiple
- 0.20×
- Total profit
- $-40,308
- Equity at exit
- $15,477
Cash invested: $50,120 (down + closing). Projections, not guarantees.
Landlord ↔ Tenant lean methodology
- Overall (STATE)
- 87 Strongly Landlord-Friendly
- State Texas
- 87 Strongly Landlord-Friendly · R+5
- County
- — inherits STATE
- City
- — inherits STATE
ZIP-level market 75021
- Home prices YoY
- -17.3%
- Active inventory
- 165
- Price-to-rent
- 11.5×
Monthly cashflow live
- Estimated rent
- $1,302 high interval (Pro) →
- Mortgage (P&I)
- −$939
- Tax from tax record
- −$123 /mo · $1,481/yr
- Insurance
- −$75
- HOA
- −$0
- Vacancy / Maint / Mgmt
- −$273
- Net cashflow
- $-108
Break-even live
UW: 25.0% down · 7.5% · 30yr · 1.5% tax · 5.0% vac · 8.0% maint · 8.0% mgmt
Financing live
Cash to close
- Down payment
- $44,750
- Closing costs
- $5,370
- Reserves months
- —
- Total cash needed
- —
Loan-product check · same deal, 3 products live
Conventional
25% down · 7.5% · 30yr
- Down + closing
- —
- Monthly P&I
- —
- Monthly cashflow
- —
- DSCR
- —
- Eligible?
- —
Personal DTI + credit; lowest rate.
DSCR
20% down · 8.5% · 30yr
- Down + closing
- —
- Monthly P&I
- —
- Monthly cashflow
- —
- DSCR
- —
- Eligible?
- —
No personal income docs; deal must DSCR.
Hard money
10% down · 12.0% · 12mo
- Down + closing
- —
- Monthly P&I
- —
- Monthly cashflow
- —
- DSCR
- —
- Eligible?
- —
Short-term bridge; refi at stabilization.
Rent comps 13 comps
| Address | Beds | Baths | Sqft | Rent | $/sqft | DOM | Units | Dist |
|---|---|---|---|---|---|---|---|---|
| 105 E Bond St Denison, TX | 2.0 | 1.0 | 825 | $950 | $1.15 | 43d | 1 | 0.48mi |
| 632 E Sears St Denison, TX | 2.0 | 1.0 | 780 | $1,250 | $1.60 | 43d | 1 | 0.52mi |
| 617 W Gandy St Unit 3 Denison, TX | 2.0 | 2.0 | 750 | $1,200 | $1.60 | 43d | 1 | 1.04mi |
| 520 E Day St Denison, TX | 3.0 | 1.0 | 1072 | $1,225 | $1.14 | 20d | 1 | 1.19mi |
| 626 W Crawford St Unit 101 Denison, TX | 2.0 | 2.0 | 950 | $950 | $1.00 | 20d | 1 | 1.23mi |
| 410 S Mirick Ave Denison, TX | 3.0 | 2.0 | 1100 | $1,300 | $1.18 | 43d | 1 | 1.24mi |
| 610 W Owing St Denison, TX | 3.0 | 2.0 | 1108 | $1,395 | $1.26 | 43d | 1 | 1.25mi |
| 820 W Crawford St Denison, TX | 2.0 | 1.0 | 996 | $1,250 | $1.26 | 20d | 1 | 1.36mi |
| 1016 W Gandy St #4 Denison, TX | 2.0 | 1.5 | 1000 | $1,100 | $1.10 | 43d | 1 | 1.36mi |
| 404 W Day St Denison, TX | 3.0 | 2.0 | 1057 | $1,500 | $1.42 | 20d | 1 | 1.37mi |
| 412 W Day St Denison, TX | 2.0 | 1.0 | 900 | $1,200 | $1.33 | 20d | 1 | 1.38mi |
| 224 W Hull St Unit A Denison, TX | 2.0 | 1.0 | 743 | $1,250 | $1.68 | 43d | 1 | 1.44mi |
| 505 E Heron St Denison, TX | 2.0 | 1.0 | 1096 | $1,250 | $1.14 | 43d | 1 | 1.50mi |
Listing history 20 events
-
2026-06-19days on market $179,000 Active 121 DOM
-
2026-06-18days on market $179,000 Active 120 DOM
-
2026-06-17days on market $179,000 Active 119 DOM
-
2026-06-16days on market $179,000 Active 118 DOM
-
2026-06-15days on market $179,000 Active 117 DOM
-
2026-06-14days on market $179,000 Active 115 DOM
-
2026-06-13days on market $179,000 Active 114 DOM
-
2026-06-10days on market $179,000 Active 112 DOM
-
2026-06-09days on market $179,000 Active 111 DOM
-
2026-06-08days on market $179,000 Active 110 DOM
-
2026-06-07days on market $179,000 Active 109 DOM
-
2026-06-05days on market $179,000 Active 106 DOM
-
2026-06-03days on market $179,000 Active 105 DOM
-
2026-06-02days on market $179,000 Active 104 DOM
-
2026-06-01days on market $179,000 Active 103 DOM
-
2026-05-31days on market $179,000 Active 102 DOM
-
2026-05-30days on market $179,000 Active 101 DOM
-
2026-03-28price $179,000 585-char remark
Show marketing remark (585 chars)
Charming home for sale in a quiet neighborhood featuring a large, fenced backyard and convenient carport. This versatile floor plan could easily be converted into a three-bedroom home, with the front room serving as a bedroom, den, or home office to fit your needs. Perfect as a starter home or investment property, this home offers brand new paint and flooring throughout, giving it a fresh, move-in-ready feel. Enjoy outdoor space for pets, play, or entertaining, all in a peaceful setting. Affordable, flexible, and freshly updated. A great opportunity you don’t want to miss!
-
2026-02-18$187,500 Active 585-char remark
Show marketing remark (585 chars)
Charming home for sale in a quiet neighborhood featuring a large, fenced backyard and convenient carport. This versatile floor plan could easily be converted into a three-bedroom home, with the front room serving as a bedroom, den, or home office to fit your needs. Perfect as a starter home or investment property, this home offers brand new paint and flooring throughout, giving it a fresh, move-in-ready feel. Enjoy outdoor space for pets, play, or entertaining, all in a peaceful setting. Affordable, flexible, and freshly updated. A great opportunity you don’t want to miss!
-
1987-11-27soldstatus
ⓘ Source: listings_history table (triggers on properties + properties_extension) + one-shot
backfill from property_details.listing_events for pre-trigger history.
Tax reassessment forecast TX · Resets to sale price
- Current annual tax
- $1,481 · $123/mo
- Projected year-2 tax
- $3,276 · $273/mo
- Expected delta
- +$1,795/yr (+$150/mo · 121.2%)
ⓘ Screening estimate from a state-policy table — verify with the county assessor before closing.
Climate risk First Street
- Flood 1/10 Low FEMA zone X (unshaded) · 0% chance over 30 yrs
- Wildfire 4/10 Moderate
- Heat 6/10 Major 7 d/yr ≥109°F today · 21 d/yr by 30 yrs out
- Wind 4/10 Moderate 18% chance of damaging wind over 30 yrs
- Air quality 3/10 Moderate 3 unhealthy d/yr today · 3 by 30 yrs out
Nearby sold comps map
Loading sold comps map…
Walkable amenities ~0.75 mi
Loading nearby amenities…
Taxation est. · year 1
- Rental income
- $15,626
- − Mortgage interest
- −$10,027
- − Property taxes
- −$1,481
- − Insurance
- −$895
- − Repairs & maintenance
- −$1,250
- − Management
- −$1,250
- − Depreciation
- −$5,207
- Taxable loss
- −$4,484
- Est. tax savings @ 24.0%
- +$1,076
- After-tax cash flow
- $-219/yr
For passive investors: Depreciation is non-cash, so a rental often shows a tax loss while cash-flowing — sheltering income. Rental losses are passive: they offset passive income freely, and up to $25,000/yr can offset ordinary (W-2) income if you actively participate and your MAGI is under $100k (phasing out to $0 by $150k); unused losses carry forward. On sale, claimed depreciation is recaptured at up to 25%, and gains may owe capital-gains tax (a 1031 exchange can defer both). Figures are a year-1 estimate at your 24.0% rate — not tax advice; consult a CPA.
Schools (NCES district)
- District
- Denison ISD
- NCES district ID
- 4816710
- Math proficiency
- 43% ▼ -7.00%
- Reading proficiency
- 44% ▼ -3.00%
- Median HH income
- $41,650
- Composite
- 36.6/100
- National rank
- #4629
- State rank
- #315 of 826 in TX
Livability — Denison
- Score
- 73/100
- State rank
- #221
- US rank
- #5428
Category grades
Schools grade is shown separately in the Schools card above.
Census & demographics
- Census place
- Denison, TX
- County
- Grayson County · 108,053 people
- City population
- 34,008
- Metro
- Sherman-Denison, TX
- Population (ZIP)
- 9,173
- Household income
- $83,067
- Rent vs Own
- Severe rent burden
- 124.0
Population outlook (Grayson County) Hauer SSP2
- Today (2025)
- 134,540 people
- By 2030
- 138,653 · +3.1%
- By 2040
- 145,958 · +8.5%
- By 2050
- 151,218 · +12.4%
- By 2075
- 161,802 · +20.3%
- By 2100
- 159,036 · +18.2%
Race, ethnicity, and origin ACS 2023
- Neighborhood character
- Predominantly White (81%)
- Race & ethnicity
- White 81% Hispanic / Latino 11% Two or more races 9% Black 2% Asian 1%
- Hispanic origin (detail)
- Mexican 10%
- Common ancestry
- Iranian 3% Italian 2% Lithuanian 1%
- Foreign-born
- 5% · Canada
- Languages at home
- 91% English-only · Spanish 8% Other Indo-European 1%
Political lean MEDSL · Grayson
- 2024 margin
- Solid R (+54.3) · D 22.5% · R 76.7%
- 2008→2024 swing
- -16.4pp toward R · 2008: -37.9pp · 2024: -54.3pp
- All cycles
- 2024: R+54.3 2020: R+49.9 2016: R+53.1 2012: R+48.0 2008: R+37.9
Not yet ingested
- Civics
- —
Market trends
- HPI YoY
- ▼ -59.91%
- Current HPI
- 285.7502
- Rent YoY
- —
- Metro
- Sherman-Denison, TX
- State GDP YoY
- ▲ 3.95%
- F500 in state
- 110
Industry mix (Fortune 500 HQ in TX)
| Industry | F500 HQs | Revenue |
|---|---|---|
| Energy | 16 | $1,198B |
|
||
| Technology | 5 | $198B |
|
||
| Engineering / Construction | 4 | $72B |
|
||
| Energy Services | 3 | $60B |
|
||
| Utilities | 3 | $41B |
|
||
| Healthcare | 2 | $330B |
|
||
Price history
-4.5% since first listed3 events — show timeline
- 2026-03-28 Price Changed $179,000 NTREIS
- 2026-02-18 Listed $187,500 NTREIS
- 1987-11-27 Sold (Public Records) — Public Records
Property tax history
+4.2%/yrLatest (2025): $1,481 · -0.1% YoY. Source: county tax records.
Cash-flow waterfall
monthlySold comps — $/sqft
last 12 mo · ≤1 miLoading sold comps…