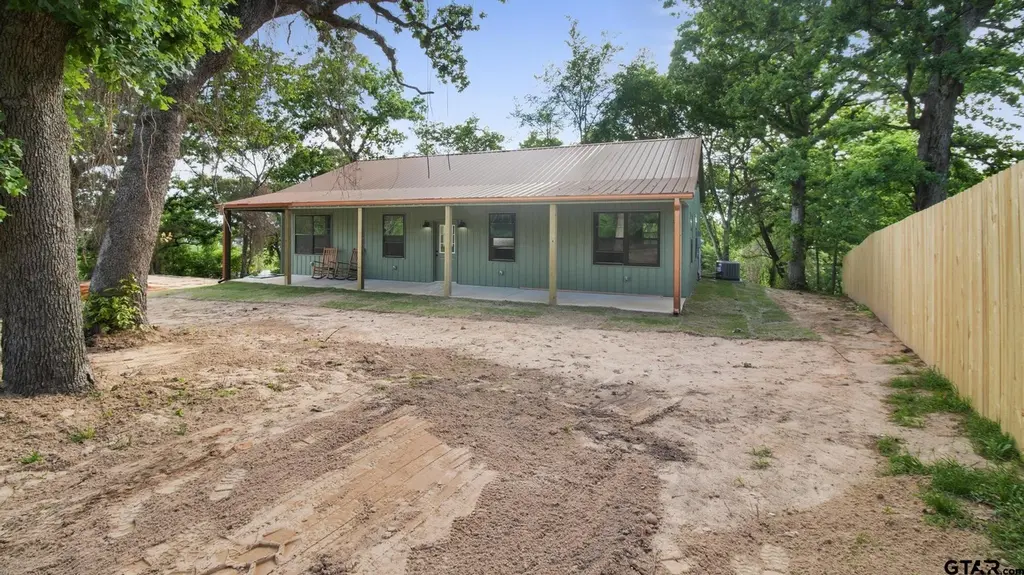
 🏗️ New Construction
22522 Pine St · Emerald Bay, TX
Flood risk 1/10 · Minimal
- FEMA flood zone
- X (unshaded)
- Chance of flooding over 30 yrs
- 0.0%
- Est. flood insurance / yr
- $507 – $1,088
Fire risk 2/10 · Minimal
- Est. fire insurance / yr
- $1,222 – $2,270
Heat risk 7/10 · Major
- Hot days now (above 109°F)
- 7 days/yr
- Hot days in 30 yrs
- 26 days/yr
Wind risk 6/10 · Moderate
- Chance of severe wind over 30 yrs
- 68.0%
Air-quality risk 1/10 · Minimal
- Unhealthy air days now
- 0 days/yr
- Unhealthy air days in 30 yrs
- 0 days/yr
Risk factors via First Street. Map © Google.
Why this score? — see what drove the F grade
The composite is a weighted blend of 9 inputs, each scored 0–100. Each bar is that input's sub-score; the figure is the points it added to the 100-point composite (weight × sub-score).
- ARV discount +7.5/15.0
- Schools +5.4/10.0
- Livability +3.6/5.0
- Rent growth +2.5/5.0
- Condition / age +2.5/5.0
- Cash flow +1.9/30.0
- 1% rule +0.0/10.0
- DSCR +0.0/10.0
- Appreciation +0.0/10.0
$295,000
🖨 Deal sheet (PDF) 📄 Offer letter ✓ Due diligence
Listing remarks MLS
2 lots being sold together totaling . 22 acres (+ or -) in award winning Bullard ISD in Flint, TX! Enjoy the slower pace of life near Lake Palestine while being close to all the amenities Tyler has to offer! Mobile homes are permitted.
Key facts
- Spacious front porch
- Back porch
- Kitchen island
Tags
Property features AI
Finance
- Other: Located in the Lakeway Harbor subdivision
- HOA & community: Homeowners association with $200 annual fee (about $16.67/month)
Exterior
- Home design: Single family detached residence; 1 story; New construction
- Construction: Metal siding; Aluminum/metal roof
- Exterior features: Porch; Wood fencing
Interior
- Kitchen: Dishwasher; Electric oven; Electric range; Microwave
- Bathrooms: 2 full bathrooms
- Heating & cooling: Central heating (electric); Central air; Ceiling fan(s)
- Interior features: Walk-in closet(s)
Neighborhood map
What this means for you Summary
Snapshot
- This is a 3-bed/2.0-bath land listed at $295k.
Deal economics
- At list price, monthly cash flow is $-2k ($-19k/yr) — negative.
- To cash-flow at today's rent, offer at most $192k (35.1% below list).
- To meet the 1% rule (rent ≥ 1% of price), the offer needs to be $170k (42.5% below list).
- Recommended offer: $170k (42.5% below list) — sets the bar for 1% rule.
- Cap rate 1.8% vs local median 2.9% in Emerald Bay — below-typical yield; the buyer is paying a premium for something (appreciation thesis, condition, location) that the cap rate doesn't capture.
Location & tenants
- Location reads 71/100 on livability (#293 in TX) — a middle-class / working-renter tenant base. Strengths: crime A+, housing A+, employment A; Watch: amenities F, commute F, health & safety D-.
- Bullard ISD (rural): math 65% / reading 60% proficiency, ranked #48 of 826 in TX (top 6%) — acceptable for families but not a draw, mixed tenant base, ~2y average lease.
- Zoned schools: Bullard El (math 61% / reading 61%, grade B, #368 of 4,322 statewide, top 9%, 434 students, 36% FRL); Bullard Int (math 66% / reading 50%, grade B, #197 of 1,662 statewide, top 12%, 435 students, 26% FRL); Bullard H S (math 57% / reading 68%, grade B-, #234 of 1,632 statewide, top 14%, 848 students, 25% FRL).
- Market conditions: 358 active listings in the ZIP; 1 comparable units currently listed for rent nearby; solid renter incomes; 595 units permitted in Smith County in 2024 (45 in 5+ unit buildings).
Forward outlook
- Local home prices are declining (-3.0%/yr); year-one equity from $3k of loan paydown is wiped out by about $13k of value loss. Plan a longer hold.
- Smith County population projected at +24% by 2050 — long-run rental-demand tailwind backs the buy-and-hold thesis.
Negotiation context
- It's been on market 18 days — a 2% lower offer ($291k) is reasonable based on typical stale-listing flexibility.
- 3 sale attempts with the ask held roughly flat each time — persistent listings suggest the price (not the market) is what's stuck; bring a comps-based counter.
Risks & watch-outs
- Climate carrying-cost: major wind risk, 68% chance of damaging wind over 30y; extreme-heat days projected 7→26/yr by 2055 (HVAC capex compounding) — expect insurance premiums to compound above CPI over the hold.
Questions for the listing agent
- What do current leases actually rent for vs. the listed asking? Can we see a recent rent roll and the last 12 months of T-12 income?
- What does the HOA fee cover, when was the last increase, and are there any pending special assessments or reserve-fund shortfalls?
- Is there a deadline driving the sale (1031 exchange, divorce, estate, relocation)? That informs how much negotiation room exists.
- The area grade is low — what's the realistic commute time and amenity access for the typical tenant pool here? Any planned neighborhood developments (good or bad) we should know about?
- What's the average days-on-market for RENTAL listings here right now (not sales)? A rising rental-DOM trend means longer vacancies and softer asking-rent achievability than the comps imply.
- What's the recent tenant-quality profile in this submarket — average credit score on applications, eviction rate, late-payment / NSF rate, and stable-employment percentage? A property-management company in the area should have these aggregated.
- How much new for-sale + rental construction is in the pipeline within 1–3 miles? Heavy new supply typically softens prices + rents 12–24 months out; constrained supply supports both.
Investment metrics
- 1% rule
- 0.41% ✗
- Cap rate
- 1.81%
- Cash-on-cash
- -16.02%
- DSCR
- 0.29
- GRM
- 20.5
CMA / ARV
- ARV (median comp)
- $417,235
- List price
- $295,000
- Delta
- -28.10%
- Verdict
- UNDERPRICED
- Comps
- 9 within 1.0 mi
Projected returns pro-forma
-3.0% appreciation · 3.0% rent growth · sell at horizon
- IRR
- -47.5%
- Equity multiple
- -0.43×
- Total profit
- $-166,920
- Equity at exit
- $62,211
- IRR
- -90.7%
- Equity multiple
- -1.34×
- Total profit
- $-273,128
- Equity at exit
- $36,075
Cash invested: $116,826 (down + closing). Projections, not guarantees.
Landlord ↔ Tenant lean methodology
- Overall (STATE)
- 87 Strongly Landlord-Friendly
- State Texas
- 87 Strongly Landlord-Friendly · R+5
- County
- — inherits STATE
- City
- — inherits STATE
ZIP-level market 75762
- Home prices YoY
- -28.4%
- Active inventory
- 358
- Price-to-rent
- 14.5×
Monthly cashflow live
- Estimated rent
- $1,697 medium interval (Pro) →
- Mortgage (P&I)
- −$2,188
- Tax est. 1.5%
- −$522 /mo · $6,259/yr
- Insurance
- −$174
- HOA
- −$17
- Vacancy / Maint / Mgmt
- −$356
- Net cashflow
- $-1,560
Break-even live
Sensitivity live
| Price | -10% $-1,271 | -5% $-1,416 | +0% $-1,560 | +5% $-1,704 | +10% $-1,848 |
|---|---|---|---|---|---|
| Rent | -10% $-1,694 | -5% $-1,627 | +0% $-1,560 | +5% $-1,493 | +10% $-1,426 |
| Rate | -1.0pp $-1,350 | -0.5pp $-1,454 | base $-1,560 | +0.5pp $-1,668 | +1.0pp $-1,778 |
UW: 25.0% down · 7.5% · 30yr · 1.5% tax · 5.0% vac · 8.0% maint · 8.0% mgmt
Financing live
Cash to close
- Down payment
- $104,309
- Closing costs
- $12,517
- Reserves months
- —
- Total cash needed
- —
Loan-product check · same deal, 3 products live
Conventional
25% down · 7.5% · 30yr
- Down + closing
- —
- Monthly P&I
- —
- Monthly cashflow
- —
- DSCR
- —
- Eligible?
- —
Personal DTI + credit; lowest rate.
DSCR
20% down · 8.5% · 30yr
- Down + closing
- —
- Monthly P&I
- —
- Monthly cashflow
- —
- DSCR
- —
- Eligible?
- —
No personal income docs; deal must DSCR.
Hard money
10% down · 12.0% · 12mo
- Down + closing
- —
- Monthly P&I
- —
- Monthly cashflow
- —
- DSCR
- —
- Eligible?
- —
Short-term bridge; refi at stabilization.
Rent comps 1 comps
| Address | Beds | Baths | Sqft | Rent | $/sqft | DOM | Units | Dist |
|---|---|---|---|---|---|---|---|---|
| 16584 Lakeway Cir Flint, TX | 3.0 | 2.0 | 1500 | $1,050 | $0.70 | 15d | 1 | 0.39mi |
HOA detail
- Monthly dues
- $17 · $204/yr
Listing history 22 events
-
2026-06-22days on market $295,000 Active 18 DOM
-
2026-06-19days on market $295,000 Active 16 DOM
-
2026-06-18days on market $295,000 Active 15 DOM
-
2026-06-17days on market $295,000 Active 14 DOM
-
2026-06-16days on market $295,000 Active 13 DOM
-
2026-06-15days on market $295,000 Active 12 DOM
-
2026-06-14days on market $295,000 Active 10 DOM
-
2026-06-13days on market $295,000 Active 9 DOM
-
2026-06-10days on market $295,000 Active 7 DOM
-
2026-06-09days on market $295,000 Active 6 DOM
-
2026-06-08days on market $295,000 Active 5 DOM
-
2026-06-07pricedays on market $295,000 Active 4 DOM
-
2026-06-02days on market $300,000 Active 53 DOM
-
2026-06-01days on market $300,000 Active 52 DOM
-
2026-05-31days on market $300,000 Active 51 DOM
-
2026-05-30days on market $300,000 Active 50 DOM
-
2026-04-10$300,000 Active 1190-char remark
-
2025-03-27soldstatus
-
2025-03-21soldstatus Closed 236-char remark
Show marketing remark (236 chars)
2 lots being sold together totaling . 22 acres (+ or -) in award winning Bullard ISD in Flint, TX! Enjoy the slower pace of life near Lake Palestine while being close to all the amenities Tyler has to offer! Mobile homes are permitted.
-
2025-03-08historical 236-char remark
Show marketing remark (236 chars)
2 lots being sold together totaling . 22 acres (+ or -) in award winning Bullard ISD in Flint, TX! Enjoy the slower pace of life near Lake Palestine while being close to all the amenities Tyler has to offer! Mobile homes are permitted.
-
2025-01-08$17,000 Active 236-char remark
Show marketing remark (236 chars)
2 lots being sold together totaling . 22 acres (+ or -) in award winning Bullard ISD in Flint, TX! Enjoy the slower pace of life near Lake Palestine while being close to all the amenities Tyler has to offer! Mobile homes are permitted.
-
2001-07-19soldstatus
ⓘ Source: listings_history table (triggers on properties + properties_extension) + one-shot
backfill from property_details.listing_events for pre-trigger history.
Climate risk First Street
- Flood 1/10 Low FEMA zone X (unshaded) · 0% chance over 30 yrs
- Wildfire 2/10 Low
- Heat 7/10 Severe 7 d/yr ≥109°F today · 26 d/yr by 30 yrs out
- Wind 6/10 Major 68% chance of damaging wind over 30 yrs
- Air quality 1/10 Low 0 unhealthy d/yr today · 0 by 30 yrs out
Nearby sold comps map
Loading sold comps map…
Walkable amenities ~0.75 mi
Loading nearby amenities…
Taxation est. · year 1
- Rental income
- $20,364
- − Mortgage interest
- −$23,372
- − Property taxes
- −$6,259
- − Insurance
- −$2,086
- − Repairs & maintenance
- −$1,629
- − Management
- −$1,629
- − HOA
- −$204
- − Depreciation
- −$12,138
- Taxable loss
- −$26,953
- Est. tax savings @ 24.0%
- +$6,469
- After-tax cash flow
- $-12,249/yr
For passive investors: Depreciation is non-cash, so a rental often shows a tax loss while cash-flowing — sheltering income. Rental losses are passive: they offset passive income freely, and up to $25,000/yr can offset ordinary (W-2) income if you actively participate and your MAGI is under $100k (phasing out to $0 by $150k); unused losses carry forward. On sale, claimed depreciation is recaptured at up to 25%, and gains may owe capital-gains tax (a 1031 exchange can defer both). Figures are a year-1 estimate at your 24.0% rate — not tax advice; consult a CPA.
Schools (NCES district)
- District
- Bullard ISD
- NCES district ID
- 4812060
- Math proficiency
- 65% ▼ -2.00%
- Reading proficiency
- 60% ▬ 0.00%
- Median HH income
- $55,026
- Composite
- 53.66/100
- National rank
- #1433
- State rank
- #48 of 826 in TX
Livability — Emerald Bay
- Score
- 71/100
- State rank
- #293
- US rank
- #6721
Category grades
Schools grade is shown separately in the Schools card above.
Census & demographics
- County
- Smith County · 180,570 people
- Metro
- Tyler, TX
- Population (ZIP)
- 15,704
- Household income
- $90,057
- Rent vs Own
- Severe rent burden
- 98.0
Population outlook (Smith County) Hauer SSP2
- Today (2025)
- 248,890 people
- By 2030
- 261,665 · +5.1%
- By 2040
- 286,114 · +15.0%
- By 2050
- 308,006 · +23.8%
- By 2075
- 354,171 · +42.3%
- By 2100
- 372,828 · +49.8%
Race, ethnicity, and origin ACS 2023
- Neighborhood character
- Predominantly White (71%)
- Race & ethnicity
- White 71% Hispanic / Latino 16% Two or more races 13% Black 11%
- Hispanic origin (detail)
- Mexican 12%
- Common ancestry
- Iranian 2% Serbian 2% Portuguese 1%
- Foreign-born
- 5% · Canada
- Languages at home
- 85% English-only · Spanish 13%
Political lean MEDSL · Smith
- 2024 margin
- Solid R (+45.1) · D 27.0% · R 72.1%
- 2008→2024 swing
- -5.6pp toward R · 2008: -39.5pp · 2024: -45.1pp
- All cycles
- 2024: R+45.1 2020: R+39.4 2016: R+43.9 2012: R+46.9 2008: R+39.5
Not yet ingested
- Civics
- —
Market trends
- HPI YoY
- ▼ -78.39%
- Current HPI
- 197.2375
- Rent YoY
- —
- Metro
- Tyler, TX
- State GDP YoY
- ▲ 3.95%
- F500 in state
- 110
Industry mix (Fortune 500 HQ in TX)
| Industry | F500 HQs | Revenue |
|---|---|---|
| Energy | 16 | $1,198B |
|
||
| Technology | 5 | $198B |
|
||
| Engineering / Construction | 4 | $72B |
|
||
| Energy Services | 3 | $60B |
|
||
| Utilities | 3 | $41B |
|
||
| Healthcare | 2 | $330B |
|
||
Price history
+1635.3% since first listed7 events — show timeline
- 2026-06-03 Listed $295,000 GTAR
- 2026-04-10 Listed $300,000 GTAR
- 2025-03-27 Sold (Public Records) — Public Records
- 2025-03-21 Sold (MLS) — GTAR
- 2025-03-08 Delisted — GTAR
- 2025-01-08 Listed $17,000 GTAR
- 2001-07-19 Sold (Public Records) — Public Records
Property tax history
+2.8%/yrLatest (2024): $76 · +1.0% YoY. Source: county tax records.
Cash-flow waterfall
monthlySold comps — $/sqft
last 12 mo · ≤1 miLoading sold comps…