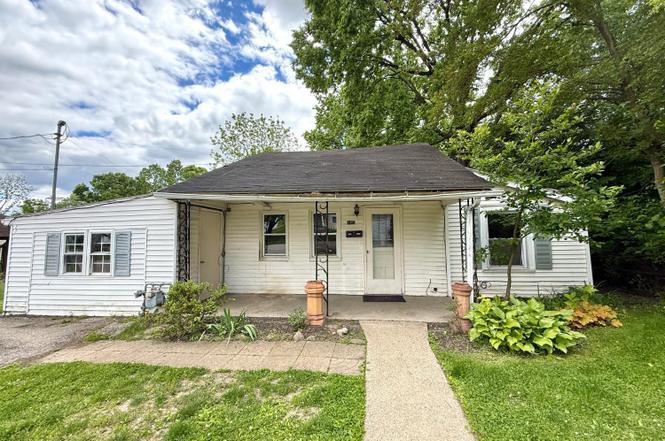
115 W Warren St · Lebanon, OH
Flood risk 8/10 · Major
- FEMA flood zone
- X (shaded)
- Chance of flooding over 30 yrs
- 0.99%
- Est. flood insurance / yr
- $507 – $1,088
Fire risk 1/10 · Minimal
- Est. fire insurance / yr
- $713 – $1,323
Heat risk 4/10 · Minor
- Hot days now (above 101°F)
- 7 days/yr
- Hot days in 30 yrs
- 19 days/yr
Wind risk 2/10 · Minimal
- Chance of severe wind over 30 yrs
- 1.0%
Air-quality risk 4/10 · Minor
- Unhealthy air days now
- 4 days/yr
- Unhealthy air days in 30 yrs
- 6 days/yr
Risk factors via First Street. Map © Google.
Why this score? — see what drove the B+ grade
The composite is a weighted blend of 9 inputs, each scored 0–100. Each bar is that input's sub-score; the figure is the points it added to the 100-point composite (weight × sub-score).
- Cash flow +29.3/30.0
- ARV discount +15.0/15.0
- DSCR +10.0/10.0
- 1% rule +7.5/10.0
- Schools +5.9/10.0
- Rent growth +4.6/5.0
- Livability +3.5/5.0
- Condition / age +2.5/5.0
- Appreciation +0.0/10.0
$137,000
🖨 Deal sheet 📄 Offer letter ✓ Due diligence
Listing remarks MLS
Don't miss this unique opportunity to acquire a fixer upper in the Lebanon school District! This home needs a full renovation, but is priced accordingly and full of possibilities. Located on a Private, .4 acre lot. This home has been loved by its renters for many years. There are lots of perennials and a lovely magnolia tree in front. Located in the heart of Lebanon, steps from local stores, restaurants and coffee shops. 3 bedroom ranch floor plan with convenient first floor laundry. Enjoy the covered front porch and expansive covered deck in back overlooking the private backyard. 2019 Water heater, central AC, older roof. Conveniently located on a quiet street near Berry Intermediate. Cash only, strictly as is, no contingencies.
Key facts
- Covered front porch
- Private lot
- Perennials
Tags
Property features AI
Finance
- Other: Residential zoning
- HOA & community: No homeowners association
Exterior
- Parking: Driveway
- Utilities: Public water; Public sewer; Natural gas
- Home design: Ranch-style single family home; One story; Slab foundation
- Construction: Vinyl siding; Shingle roof; Built as a ranch (single-family)
- Exterior features: Covered deck/patio; Patio; Porch; Vinyl windows
Interior
- Kitchen: Tile flooring; Wood cabinets; Oven/Range; Refrigerator
- Bedrooms: Three bedrooms total; Primary bedroom approximately 30 x 11 (Level: 1); Bedroom 2 approximately 10 x 10 (Level: 1); Bedroom 3 approximately 10 x 11 (Level: 1)
- Flooring: Wood flooring (living room); Tile flooring (kitchen)
- Bathrooms: One full bathroom on the main level
- Heating & cooling: Forced air heating; Central air conditioning; Gas water heating
- Interior features: Seven total rooms; Wood floors in living room; Tile floor and wood cabinets in kitchen
- Laundry & utility: Main-level laundry room approximately 12 x 5
Neighborhood map
What this means for you Summary
Snapshot
- This is a 3-bed/1.0-bath single-family listed at $137k.
Deal economics
- At list price, monthly cash flow is $413 ($5k/yr) — positive.
- The deal already cash-flows at list — no discount required.
- Meets the 1% rule at list price ($2k rent vs $137k).
- Cap rate 10.5% vs local median 2.5% in Lebanon — top-decile yield for the area; either an underpriced asset or a hidden risk that comps aren't pricing in. Stress-test before assuming the spread holds.
Location & tenants
- Location reads 70/100 on livability (#457 in OH) — a middle-class / working-renter tenant base. Strengths: cost of living A+, housing A+, crime A; Watch: amenities F, commute F, health & safety F.
- Lebanon City (suburban): math 67% / reading 69% proficiency, ranked #151 of 656 in OH (top 23%) — acceptable for families but not a draw, mixed tenant base, ~2y average lease.
- Market conditions: Rents rising fast (+8.3%/yr); 289 active listings in the ZIP; 13 comparable units currently listed for rent nearby; rentals at typical pace (median 24d on market — plan ~3-4 weeks tenant-placement turnaround); solid renter incomes; 1,224 units permitted in Warren County in 2024 (474 in 5+ unit buildings).
Forward outlook
- Local home prices are declining (-3.0%/yr); year-one equity from $947 of loan paydown is wiped out by about $4k of value loss. Plan a longer hold.
- Warren County population projected at +16% by 2050 — long-run rental-demand tailwind backs the buy-and-hold thesis.
- At projected returns (-3.0% appreciation + 8.0% rent growth), your $38k cash investment doubles in ~7 years — after that, you're playing with house money.
Negotiation context
- Only 6 days on market — expect competitive offers; lowballing is unlikely to land.
- 2 sale attempts with the ask held roughly flat each time — persistent listings suggest the price (not the market) is what's stuck; bring a comps-based counter.
- Current owner paid $92k; 49% above their basis — modest negotiation headroom, anchor on the comps not their cost.
Risks & watch-outs
- Watch-outs: flood insurance adds $66/mo.
- Climate carrying-cost: severe flood risk — expect insurance premiums to compound above CPI over the hold.
Questions for the listing agent
- What's the actual annual flood-insurance premium (NFIP or private), and is the property in a SFHA with mandatory coverage?
- Is there a deadline driving the sale (1031 exchange, divorce, estate, relocation)? That informs how much negotiation room exists.
- Schools are B-rated — typically a magnet for longer-tenancy family renters. What's the average tenant stay here, and is there a school-zone premium baked into asking?
- What's the average days-on-market for RENTAL listings here right now (not sales)? A rising rental-DOM trend means longer vacancies and softer asking-rent achievability than the comps imply.
- What's the recent tenant-quality profile in this submarket — average credit score on applications, eviction rate, late-payment / NSF rate, and stable-employment percentage? A property-management company in the area should have these aggregated.
- How much new for-sale + rental construction is in the pipeline within 1–3 miles? Heavy new supply typically softens prices + rents 12–24 months out; constrained supply supports both.
Investment metrics
- 1% rule
- 1.25% ✓
- Cap rate
- 10.49%
- Cash-on-cash
- 15.00%
- DSCR
- 1.67
- GRM
- 6.7
CMA / ARV
- ARV (median comp)
- $247,929
- List price
- $137,000
- Delta
- -43.94%
- Verdict
- UNDERPRICED
- Comps
- 20 within 1.0 mi
Show comp detail 12 sales within ~0.75 mi
| Address | Dist | Beds/Ba | Sqft | Sold | Price | $/sf | Match |
|---|---|---|---|---|---|---|---|
| 224 W Warren St | 0.07mi | 3/1.0 | 1,175 (-6%) | 3mo | $200,000 | $170 | 84 |
| 114 New St | 0.33mi | 3/1.5 | 1,248 (0%) | 7mo | $240,000 | $192 | 77 |
| 246 Cincinnati Ave | 0.43mi | 3/1.5 | 1,178 (-6%) | 0mo | $230,000 | $195 | 68 |
| 107 Parkview St | 0.49mi | 3/1.5 | 1,180 (-5%) | 3mo | $255,000 | $216 | 64 |
| 444 E Main St | 0.62mi | 3/2.0 | 1,240 (-1%) | 4mo | $245,000 | $198 | 63 |
| 124 S East St | 0.49mi | 3/2.0 | 1,242 (-0%) | 14mo | $291,000 | $234 | 61 |
| 120 Canal St | 0.11mi | 3/2.0 | 1,416 (+14%) | 10mo | $272,000 | $192 | 60 |
| 402 Pleasant St | 0.48mi | 3/2.0 | 1,288 (+3%) | 20mo | $345,100 | $268 | 52 |
| 29 Summit St | 0.74mi | 2/1.0 (-1) | 1,290 (+3%) | 7mo | $250,000 | $194 | 50 |
| 316 Center St | 0.73mi | 3/1.0 | 1,307 (+5%) | 10mo | $265,000 | $203 | 49 |
| 444 E Silver St | 0.59mi | 3/1.5 | 1,200 (-4%) | 19mo | $335,000 | $279 | 48 |
| 439 E Mulberry St | 0.60mi | 2/1.0 (-1) | 1,070 (-14%) | 22mo | $200,000 | $187 | 25 |
Match score weights: distance 35% · size 25% · config 20% · recency 20%. Top-matched comps best support the ARV.
Projected returns pro-forma
-3.0% appreciation · 8.0% rent growth · sell at horizon
- IRR
- 8.3%
- Equity multiple
- 1.34×
- Total profit
- $13,163
- Equity at exit
- $20,427
- IRR
- 21.4%
- Equity multiple
- 3.26×
- Total profit
- $86,516
- Equity at exit
- $11,845
Cash invested: $38,360 (down + closing). Projections, not guarantees.
Landlord ↔ Tenant lean methodology
- Overall (STATE)
- 73 Landlord-Friendly
- State Ohio
- 73 Landlord-Friendly · R+6
- County
- — inherits STATE
- City
- — inherits STATE
ZIP-level market 45036
- Rents YoY
- 8.3%
- Active inventory
- 289
- Price-to-rent
- 6.7×
Monthly cashflow live
- Estimated rent
- $1,708 high interval (Pro) →
- Mortgage (P&I)
- −$718
- Tax from tax record
- −$94 /mo · $1,133/yr
- Insurance
- −$57
- Flood insurance flood zone
- −$66 /mo · $798/yr
- HOA
- −$0
- Vacancy / Maint / Mgmt
- −$359
- Net cashflow
- $413
Break-even live
UW: 25.0% down · 7.5% · 30yr · 1.5% tax · 5.0% vac · 8.0% maint · 8.0% mgmt
Financing live
Cash to close
- Down payment
- $34,250
- Closing costs
- $4,110
- Reserves months
- —
- Total cash needed
- —
Loan-product check · same deal, 3 products live
Conventional
25% down · 7.5% · 30yr
- Down + closing
- —
- Monthly P&I
- —
- Monthly cashflow
- —
- DSCR
- —
- Eligible?
- —
Personal DTI + credit; lowest rate.
DSCR
20% down · 8.5% · 30yr
- Down + closing
- —
- Monthly P&I
- —
- Monthly cashflow
- —
- DSCR
- —
- Eligible?
- —
No personal income docs; deal must DSCR.
Hard money
10% down · 12.0% · 12mo
- Down + closing
- —
- Monthly P&I
- —
- Monthly cashflow
- —
- DSCR
- —
- Eligible?
- —
Short-term bridge; refi at stabilization.
Rent comps 13 comps
| Address | Beds | Baths | Sqft | Rent | $/sqft | DOM | Units | Dist |
|---|---|---|---|---|---|---|---|---|
| 15 N West St Lebanon, OH | 2.0 | 1.0 | 887 | $1,150 | $1.30 | 1d | 4 | 0.30mi |
| 800 Franklin Rd Lebanon, OH | 2.0 | 1.0 | 900 | $1,275 | $1.42 | 43d | 1 | 0.53mi |
| 800 Franklin Rd Lebanon, OH | 2.0 | 1.0 | 900 | $1,325 | $1.47 | 1d | 4 | 0.53mi |
| 308 S Mechanic St Unit 308 Lebanon, OH | 2.0 | 1.0 | 950 | $1,495 | $1.57 | 23d | 1 | 0.60mi |
| 870 Franklin Rd Lebanon, OH | 2.0 | 2.0 | 1225 | $2,164 | $1.77 | 1d | 8 | 0.71mi |
| 104 Rough Way Lebanon, OH | 2.0 | 2.0 | 1200 | $1,450 | $1.21 | 43d | 1 | 0.81mi |
| 100 Rough Way Lebanon, OH | 2.0 | 2.0 | 1200 | $1,450 | $1.21 | 43d | 1 | 0.81mi |
| 100 Rough Way Lebanon, OH | 2.0 | 2.0 | 1120 | $1,450 | $1.29 | 14d | 1 | 0.81mi |
| 1111 Deerfield Rd Lebanon, OH | 2.0 | 1.0 | 885 | $1,649 | $1.86 | 1d | 15 | 1.15mi |
| 201 Cook Rd Unit A Lebanon, OH | 2.0 | 1.0 | 1200 | $1,700 | $1.42 | 3d | 1 | 1.29mi |
| 1173 Navaho Dr Unit A Lebanon, OH | 3.0 | 1.5 | 1189 | $1,645 | $1.38 | 43d | 1 | 1.46mi |
| 1173 Navaho Dr Unit B Lebanon, OH | 3.0 | 1.5 | 1189 | $1,695 | $1.43 | 43d | 1 | 1.46mi |
| 1125 Algonquin Dr Unit A Lebanon, OH | 2.0 | 1.0 | 1250 | $1,650 | $1.32 | 23d | 1 | 1.47mi |
Listing history 15 events
-
2026-06-18days on market $137,000 Active 6 DOM
-
2026-06-17days on market $137,000 Active 5 DOM
-
2026-06-16days on market $137,000 Active 4 DOM
-
2026-06-15days on market $137,000 Active 3 DOM
-
2026-06-13pricedays on market $137,000 Active 1 DOM
-
2026-06-09days on market $139,000 Active 25 DOM
-
2026-06-08days on market $139,000 Active 24 DOM
-
2026-06-07days on market $139,000 Active 23 DOM
-
2026-06-03days on market $139,000 Active 19 DOM
-
2026-06-02days on market $139,000 Active 18 DOM
-
2026-06-01days on market $139,000 Active 17 DOM
-
2026-05-31days on market $139,000 Active 16 DOM
-
2026-05-15$149,000 Active 739-char remark
Show marketing remark (739 chars)
Don't miss this unique opportunity to acquire a fixer upper in the Lebanon school District! This home needs a full renovation, but is priced accordingly and full of possibilities. Located on a Private, .4 acre lot. This home has been loved by its renters for many years. There are lots of perennials and a lovely magnolia tree in front. Located in the heart of Lebanon, steps from local stores, restaurants and coffee shops. 3 bedroom ranch floor plan with convenient first floor laundry. Enjoy the covered front porch and expansive covered deck in back overlooking the private backyard. 2019 Water heater, central AC, older roof. Conveniently located on a quiet street near Berry Intermediate. Cash only, strictly as is, no contingencies.
-
2026-04-02soldstatus $92,000
-
2000-05-12soldstatus $59,500
ⓘ Source: listings_history table (triggers on properties + properties_extension) + one-shot
backfill from property_details.listing_events for pre-trigger history.
Tax reassessment forecast OH · Partial reset (capped growth)
- Current annual tax
- $1,133 · $94/mo
- Projected year-2 tax
- $1,635 · $136/mo
- Expected delta
- +$502/yr (+$42/mo · 44.4%)
ⓘ Screening estimate from a state-policy table — verify with the county assessor before closing.
Climate risk First Street
- Flood 8/10 Severe FEMA zone X (shaded) · 99% chance over 30 yrs
- Wildfire 1/10 Low
- Heat 4/10 Moderate 7 d/yr ≥101°F today · 19 d/yr by 30 yrs out
- Wind 2/10 Low 100% chance of damaging wind over 30 yrs
- Air quality 4/10 Moderate 4 unhealthy d/yr today · 6 by 30 yrs out
Nearby sold comps map
Loading sold comps map…
Walkable amenities ~0.75 mi
Loading nearby amenities…
Taxation est. · year 1
- Rental income
- $20,499
- − Mortgage interest
- −$7,674
- − Property taxes
- −$1,133
- − Insurance
- −$1,482
- − Repairs & maintenance
- −$1,640
- − Management
- −$1,640
- − Depreciation
- −$3,985
- Taxable income
- $2,945
- Est. tax owed @ 24.0%
- −$707
- After-tax cash flow
- $4,251/yr
For passive investors: Depreciation is non-cash, so a rental often shows a tax loss while cash-flowing — sheltering income. Rental losses are passive: they offset passive income freely, and up to $25,000/yr can offset ordinary (W-2) income if you actively participate and your MAGI is under $100k (phasing out to $0 by $150k); unused losses carry forward. On sale, claimed depreciation is recaptured at up to 25%, and gains may owe capital-gains tax (a 1031 exchange can defer both). Figures are a year-1 estimate at your 24.0% rate — not tax advice; consult a CPA.
Schools (NCES district)
- District
- Lebanon City
- NCES district ID
- 3904421
- Math proficiency
- 67% ▼ -2.00%
- Reading proficiency
- 69% ▼ -3.00%
- Median HH income
- $66,118
- Composite
- 59.25/100
- National rank
- #936
- State rank
- #151 of 656 in OH
Livability — Lebanon
- Score
- 70/100
- State rank
- #457
- US rank
- #7561
Category grades
Schools grade is shown separately in the Schools card above.
Census & demographics
- Census place
- Lebanon, OH
- County
- Warren County · 196,906 people
- City population
- 42,204
- Metro
- Cincinnati, OH-KY-IN
- Population (ZIP)
- 42,204
- Household income
- $99,128
- Rent vs Own
- Severe rent burden
- 904.0
Population outlook (Warren County) Hauer SSP2
- Today (2025)
- 248,603 people
- By 2030
- 259,345 · +4.3%
- By 2040
- 277,666 · +11.7%
- By 2050
- 289,599 · +16.5%
- By 2075
- 311,681 · +25.4%
- By 2100
- 302,738 · +21.8%
Race, ethnicity, and origin ACS 2023
- Neighborhood character
- Predominantly White (84%)
- Race & ethnicity
- White 84% Black 8% Two or more races 3% Asian 3% Hispanic / Latino 2%
- Common ancestry
- Slovak 2% Romanian 2% Italian 2%
- Foreign-born
- 3% · Canada
- Languages at home
- 97% English-only · Spanish 1% Other Asian/Pacific 1% Other Indo-European 1%
Political lean MEDSL · Warren
- 2024 margin
- Solid R (+31.5) · D 33.8% · R 65.3%
- 2008→2024 swing
- +4.5pp toward D · 2008: -36.1pp · 2024: -31.5pp
- All cycles
- 2024: R+31.5 2020: R+30.8 2016: R+37.6 2012: R+39.5 2008: R+36.1
Not yet ingested
- Civics
- —
Market trends
- HPI YoY
- ▼ -165.95%
- Current HPI
- 239.4833
- Rent YoY
- ▲ 8.33%
- Metro
- Cincinnati, OH-KY-IN
- State GDP YoY
- ▲ 1.98%
- F500 in state
- 48
Industry mix (Fortune 500 HQ in OH)
| Industry | F500 HQs | Revenue |
|---|---|---|
| Insurance | 3 | $145B |
|
||
| Industrial Machinery | 3 | $49B |
|
||
| Financial Services | 3 | $24B |
|
||
| Consumer Goods | 2 | $93B |
|
||
| Aerospace / Defense | 2 | $47B |
|
||
| Utilities | 2 | $33B |
|
||
Price history
+130.3% since first listed6 events — show timeline
- 2026-06-12 Listed $137,000 Cincy MLS
- 2026-06-12 Listing Removed — Cincy MLS
- 2026-05-28 Price Changed $139,000 Cincy MLS
- 2026-05-15 Listed $149,000 Cincy MLS
- 2026-04-02 Sold (Public Records) $92,000 Public Records
- 2000-05-12 Sold (Public Records) $59,500 Public Records
Property tax history
+2.9%/yrLatest (2025): $1,133 · -2.2% YoY. Source: county tax records.
Cash-flow waterfall
monthlySold comps — $/sqft
last 12 mo · ≤1 miLoading sold comps…