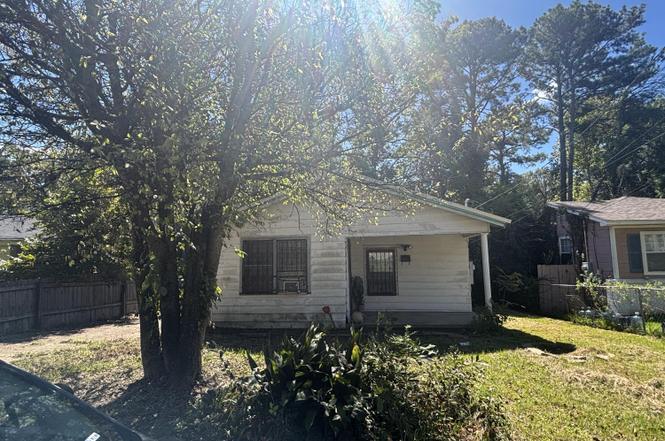
1427 Fernwood Dr · Jackson, MS
Flood risk 1/10 · Minimal
- FEMA flood zone
- X (unshaded)
- Chance of flooding over 30 yrs
- 0.0%
- Est. flood insurance / yr
- $507 – $1,088
Fire risk 1/10 · Minimal
- Est. fire insurance / yr
- $1,241 – $2,305
Heat risk 7/10 · Major
- Hot days now (above 109°F)
- 7 days/yr
- Hot days in 30 yrs
- 20 days/yr
Wind risk 7/10 · Major
- Chance of severe wind over 30 yrs
- 78.0%
Air-quality risk 1/10 · Minimal
- Unhealthy air days now
- 0 days/yr
- Unhealthy air days in 30 yrs
- 0 days/yr
Risk factors via First Street. Map © Google.
Why this score? — see what drove the A- grade
The composite is a weighted blend of 9 inputs, each scored 0–100. Each bar is that input's sub-score; the figure is the points it added to the 100-point composite (weight × sub-score).
- Cash flow +30.0/30.0
- ARV discount +15.0/15.0
- 1% rule +10.0/10.0
- DSCR +10.0/10.0
- Appreciation +10.0/10.0
- Livability +3.4/5.0
- Rent growth +2.5/5.0
- Condition / age +2.5/5.0
- Schools +1.1/10.0
$34,990
🖨 Deal sheet (PDF) 📄 Offer letter ✓ Due diligence
Listing remarks
Opportunity meets location in this hidden Jackson gem. Nestled in a peaceful neighborhood just minutes from downtown, schools, parks, and local favorites, this home offers unmatched convenience with small-town charm. Sitting on a spacious lot, it's ready to be transformed into something special—whether you're creating your first home or unlocking investment potential. Don't miss the chance to make this one yours.
Key facts
- Spacious lot
- Investment potential
- 6,534 sq ft lot
Tags
Neighborhood map
What this means for you Summary
Snapshot
- This is a 2-bed/1.0-bath single-family listed at $35k.
Deal economics
- At list price, monthly cash flow is $602 ($7k/yr) — positive.
- The deal already cash-flows at list — no discount required.
- Meets the 1% rule at list price ($1k rent vs $35k).
- Recommended offer: $34k (1.5% below list) — sets the bar for market timing.
- Cap rate 26.9% vs local median 9.9% in Jackson — top-decile yield for the area; either an underpriced asset or a hidden risk that comps aren't pricing in. Stress-test before assuming the spread holds.
Location & tenants
- Location reads 68/100 on livability (#66 in MS) — a middle-class / working-renter tenant base. Strengths: commute A+, cost of living A+, housing A+; Watch: amenities F, employment F, health & safety F.
- Jackson Public School District (urban): math 9% / reading 18% proficiency, ranked #112 of 130 in MS (top 86%) — low school quality limits family demand, transient renter base, plan for 1-2y turnover; 88% free/reduced lunch — lower-income household profile, screen leases tightly.
- Zoned schools: Johnson Elementary School (math 2% / reading 12%, grade F, #337 of 375 statewide, top 94%, 290 students, 100% FRL); Brinkley Middle School (math 8% / reading 8%, grade F, #165 of 179 statewide, top 93%, 354 students, 100% FRL); Lanier High School (math 3% / reading 2%, grade F, #197 of 197 statewide, top 100%, 603 students, 100% FRL).
- Market conditions: 81 active listings in the ZIP; 12 comparable units currently listed for rent nearby; rentals lingering (median 46d on market — plan ~5-8 weeks vacancy on turnover, expect pricing pressure); 50% of comp listings sitting > 30 days — soft ceiling on asking rent; lower-income renter base — watch delinquency; 167 units permitted in Hinds County in 2024 (0 in 5+ unit buildings).
- This rent runs 44% of the median local income ($30k/yr) — at the standard rent-burdened threshold; future hikes will face affordability resistance.
Forward outlook
- In year one you build about $4k of equity ($242 loan paydown + $3k appreciation (10.0% local appreciation)).
- Hinds County population projected to shrink 6% by 2050 — rents likely to lag national; underwrite the cash flow, not the appreciation.
- At projected returns (10.0% appreciation + 3.0% rent growth), your $10k cash investment doubles in ~1 year — after that, you're playing with house money.
- By year 8, paydown + projected appreciation supports a ~$33k cash-out refi (75% LTV) — recoverable capital for the next deal without selling this one.
Negotiation context
- It's been on market 17 days — a 2% lower offer ($34k) is reasonable based on typical stale-listing flexibility.
Risks & watch-outs
- Watch-outs: built in 1949 — expect roof / HVAC / electrical / plumbing capex.
- Climate carrying-cost: major wind risk, 78% chance of damaging wind over 30y; extreme-heat days projected 7→20/yr by 2055 (HVAC capex compounding) — expect insurance premiums to compound above CPI over the hold.
Questions for the listing agent
- Built in 1949 — when were the roof, HVAC, electrical panel, plumbing, and water heater last replaced?
- Is there a deadline driving the sale (1031 exchange, divorce, estate, relocation)? That informs how much negotiation room exists.
- Schools are F-rated, which usually means shorter tenancies and higher turnover. Who's the typical renter profile here, and what's been the actual vacancy rate?
- What's the average days-on-market for RENTAL listings here right now (not sales)? A rising rental-DOM trend means longer vacancies and softer asking-rent achievability than the comps imply.
- What's the recent tenant-quality profile in this submarket — average credit score on applications, eviction rate, late-payment / NSF rate, and stable-employment percentage? A property-management company in the area should have these aggregated.
- How much new for-sale + rental construction is in the pipeline within 1–3 miles? Heavy new supply typically softens prices + rents 12–24 months out; constrained supply supports both.
Investment metrics
- 1% rule
- 3.11% ✓
- Cap rate
- 26.92%
- Cash-on-cash
- 73.68%
- DSCR
- 4.28
- GRM
- 2.7
CMA / ARV
- ARV (on-the-fly)
- $47,376
- Comps found
- 10
Show comp detail 10 sales within ~0.75 mi
| Address | Dist | Beds/Ba | Sqft | Sold | Price | $/sf | Match |
|---|---|---|---|---|---|---|---|
| 1332 Fernwood Dr | 0.09mi | 2/1.0 | 1,218 (+8%) | 10mo | $78,000 | $64 | 74 |
| 3434 Midlawn St | 0.35mi | 3/2.0 (+1) | 1,188 (+5%) | 1mo | $49,900 | $42 | 65 |
| 1655 Aurora St | 0.48mi | 3/2.0 (+1) | 1,100 (-2%) | 6mo | $115,000 | $105 | 60 |
| 2226 Oak Park Dr | 0.22mi | 3/1.5 (+1) | 1,008 (-11%) | 8mo | $7,500 | $7 | 59 |
| 2324 Ludlow Ave | 0.64mi | 3/1.0 (+1) | 1,203 (+7%) | 3mo | $20,000 | $17 | 51 |
| 2829 Comfort St | 0.22mi | 3/1.5 (+1) | 1,260 (+12%) | 15mo | $48,000 | $38 | 50 |
| 2234 Mobile Ave | 0.68mi | 3/1.5 (+1) | 1,102 (-2%) | 10mo | $25,000 | $23 | 49 |
| 3625 Liberty St | 0.75mi | 3/1.0 (+1) | 1,056 (-6%) | 5mo | $55,000 | $52 | 45 |
| 2438 Kingston Ave | 0.68mi | 3/2.0 (+1) | 1,042 (-8%) | 2mo | $51,000 | $49 | 45 |
| 2235 Mobile Ave | 0.67mi | 3/1.0 (+1) | 994 (-12%) | 12mo | $30,000 | $30 | 34 |
Match score weights: distance 35% · size 25% · config 20% · recency 20%. Top-matched comps best support the ARV.
Projected returns pro-forma
10.0% appreciation · 3.0% rent growth · sell at horizon
- IRR
- 84.3%
- Equity multiple
- 6.86×
- Total profit
- $57,395
- Equity at exit
- $31,522
- IRR
- 78.7%
- Equity multiple
- 15.18×
- Total profit
- $138,944
- Equity at exit
- $67,978
Cash invested: $9,797 (down + closing). Projections, not guarantees.
Landlord ↔ Tenant lean methodology
- Overall (STATE)
- 90 Strongly Landlord-Friendly
- State Mississippi
- 90 Strongly Landlord-Friendly · R+11
- County
- — inherits STATE
- City
- — inherits STATE
ZIP-level market 39213
- Home prices YoY
- 7.0%
- Active inventory
- 81
- Price-to-rent
- 2.7×
Monthly cashflow live
- Estimated rent
- $1,089 high interval (Pro) →
- Mortgage (P&I)
- −$183
- Tax from tax record
- −$61 /mo · $726/yr
- Insurance
- −$15
- HOA
- −$0
- Vacancy / Maint / Mgmt
- −$229
- Net cashflow
- $602
Break-even live
Sensitivity live
| Price | -10% $621 | -5% $611 | +0% $602 | +5% $592 | +10% $582 |
|---|---|---|---|---|---|
| Rent | -10% $516 | -5% $559 | +0% $602 | +5% $645 | +10% $688 |
| Rate | -1.0pp $619 | -0.5pp $610 | base $602 | +0.5pp $592 | +1.0pp $583 |
UW: 25.0% down · 7.5% · 30yr · 1.5% tax · 5.0% vac · 8.0% maint · 8.0% mgmt
Financing live
Cash to close
- Down payment
- $8,748
- Closing costs
- $1,050
- Reserves months
- —
- Total cash needed
- —
Loan-product check · same deal, 3 products live
Conventional
25% down · 7.5% · 30yr
- Down + closing
- —
- Monthly P&I
- —
- Monthly cashflow
- —
- DSCR
- —
- Eligible?
- —
Personal DTI + credit; lowest rate.
DSCR
20% down · 8.5% · 30yr
- Down + closing
- —
- Monthly P&I
- —
- Monthly cashflow
- —
- DSCR
- —
- Eligible?
- —
No personal income docs; deal must DSCR.
Hard money
10% down · 12.0% · 12mo
- Down + closing
- —
- Monthly P&I
- —
- Monthly cashflow
- —
- DSCR
- —
- Eligible?
- —
Short-term bridge; refi at stabilization.
Rent comps 12 comps
| Address | Beds | Baths | Sqft | Rent | $/sqft | DOM | Units | Dist |
|---|---|---|---|---|---|---|---|---|
| 2829 Comfort St Jackson, MS | 3.0 | 1.5 | 1260 | $1,250 | $0.99 | 25d | 1 | 0.21mi |
| 2829 Comfort St Jackson, MS | 3.0 | 2.0 | 1260 | $1,250 | $0.99 | 15d | 1 | 0.21mi |
| 3380 Shady Oaks St Jackson, MS | 2.0 | 1.0 | 721 | $871 | $1.21 | 15d | 1 | 0.35mi |
| 3380 Shady Oaks St Unit B Jackson, MS | 2.0 | 1.0 | 721 | $871 | $1.21 | 25d | 1 | 0.35mi |
| 3380 Shady Oaks St Unit D Jackson, MS | 2.0 | 1.0 | 721 | $832 | $1.15 | 45d | 1 | 0.35mi |
| 3444 Martin Luther King Jr Dr Jackson, MS | 3.0 | 2.0 | 1200 | $1,100 | $0.92 | 45d | 1 | 0.36mi |
| 3625 Liberty St Jackson, MS | 3.0 | 1.0 | 1056 | $1,190 | $1.13 | 15d | 1 | 0.74mi |
| 2157 Ludlow Ave Unit Na Jackson, MS | 3.0 | 2.0 | 1123 | $1,450 | $1.29 | 15d | 1 | 0.78mi |
| 2157 Ludlow Ave Jackson, MS | 3.0 | 2.0 | 1123 | $1,300 | $1.16 | 45d | 1 | 0.78mi |
| 2475 Greenfield Ave Jackson, MS | 2.0 | 1.5 | 1000 | $800 | $0.80 | 45d | 1 | 0.95mi |
| 2566 Williamson Ave Jackson, MS | 3.0 | 1.5 | 940 | $1,150 | $1.22 | 45d | 1 | 1.17mi |
| 1175 Eminence Row Jackson, MS | 2.0 | 1.0 | 700 | $650 | $0.93 | 45d | 1 | 1.30mi |
Listing history 6 events
-
2025-10-30status Pending
-
2025-10-18price $34,990
-
2025-10-13$44,990 Active
-
2010-08-09soldstatus
-
1985-10-21soldstatus
-
1956-06-04soldstatus
ⓘ Source: listings_history table (triggers on properties + properties_extension) + one-shot
backfill from property_details.listing_events for pre-trigger history.
Tax reassessment forecast MS · Resets to sale price
- Current annual tax
- $726 · $61/mo
- Projected year-2 tax
- $726 · $61/mo
- Expected delta
- $0/yr ($0/mo · 0.0%)
ⓘ Screening estimate from a state-policy table — verify with the county assessor before closing.
Climate risk First Street
- Flood 1/10 Low FEMA zone X (unshaded) · 0% chance over 30 yrs
- Wildfire 1/10 Low
- Heat 7/10 Severe 7 d/yr ≥109°F today · 20 d/yr by 30 yrs out
- Wind 7/10 Severe 78% chance of damaging wind over 30 yrs
- Air quality 1/10 Low 0 unhealthy d/yr today · 0 by 30 yrs out
Nearby sold comps map
Loading sold comps map…
Walkable amenities ~0.75 mi
Loading nearby amenities…
Taxation est. · year 1
- Rental income
- $13,065
- − Mortgage interest
- −$1,960
- − Property taxes
- −$726
- − Insurance
- −$175
- − Repairs & maintenance
- −$1,045
- − Management
- −$1,045
- − Depreciation
- −$1,018
- Taxable income
- $7,096
- Est. tax owed @ 24.0%
- −$1,703
- After-tax cash flow
- $5,515/yr
For passive investors: Depreciation is non-cash, so a rental often shows a tax loss while cash-flowing — sheltering income. Rental losses are passive: they offset passive income freely, and up to $25,000/yr can offset ordinary (W-2) income if you actively participate and your MAGI is under $100k (phasing out to $0 by $150k); unused losses carry forward. On sale, claimed depreciation is recaptured at up to 25%, and gains may owe capital-gains tax (a 1031 exchange can defer both). Figures are a year-1 estimate at your 24.0% rate — not tax advice; consult a CPA.
Schools (NCES district)
- District
- Jackson Public School District
- NCES district ID
- 2802190
- Math proficiency
- 9% ▼ -14.00%
- Reading proficiency
- 18% ▼ -7.00%
- Median HH income
- $33,234
- Composite
- 10.89/100
- National rank
- #9755
- State rank
- #112 of 130 in MS
Livability — Jackson
- Score
- 68/100
- State rank
- #66
- US rank
- #9695
Category grades
Schools grade is shown separately in the Schools card above.
Census & demographics
- Census place
- Jackson, MS
- County
- Hinds County · 167,040 people
- City population
- 140,204
- Metro
- Jackson, MS
- Population (ZIP)
- 18,691
- Household income
- $29,541
- Rent vs Own
- Severe rent burden
- 1138.0
Population outlook (Hinds County) Hauer SSP2
- Today (2025)
- 242,528 people
- By 2030
- 241,113 · -0.6%
- By 2040
- 235,557 · -2.9%
- By 2050
- 226,946 · -6.4%
- By 2075
- 199,995 · -17.5%
- By 2100
- 164,165 · -32.3%
Race, ethnicity, and origin ACS 2023
- Neighborhood character
- Predominantly Black (95%)
- Race & ethnicity
- Black 95% White 2% Two or more races 1% Hispanic / Latino 1%
- Foreign-born
- 0% · Canada
- Languages at home
- 98% English-only · Spanish 2%
Political lean MEDSL · Hinds
- 2024 margin
- Solid D (+46.1) · D 72.4% · R 26.3% · Other 1.4%
- 2008→2024 swing
- +7.1pp toward D · 2008: 39.0pp · 2024: 46.1pp
- All cycles
- 2024: D+46.1 2020: D+48.3 2016: D+43.7 2012: D+45.1 2008: D+39.0
Not yet ingested
- Civics
- —
Market trends
- HPI YoY
- ▲ 21.42%
- Current HPI
- 329.1844
- Rent YoY
- —
- Metro
- Jackson, MS
- State GDP YoY
- —
- F500 in state
- 0
Price history
-22.2% since first listed6 events — show timeline
- 2025-10-30 Pending — MLSU
- 2025-10-18 Price Changed $34,990 MLSU
- 2025-10-13 Listed $44,990 MLSU
- 2010-08-09 Sold (Public Records) — Public Records
- 1985-10-21 Sold (Public Records) — Public Records
- 1956-06-04 Sold (Public Records) — Public Records
Property tax history
+7.3%/yrLatest (2025): $726 · +0.4% YoY. Source: county tax records.
Cash-flow waterfall
monthlySold comps — $/sqft
last 12 mo · ≤1 miLoading sold comps…