183 Laurel Rdg · Scotts Corners, NY
Flood risk 1/10 · Minimal
- FEMA flood zone
- X (unshaded)
- Chance of flooding over 30 yrs
- 0.0%
- Est. flood insurance / yr
- $473 – $860
Fire risk 2/10 · Minimal
- Est. fire insurance / yr
- $691 – $1,283
Heat risk 4/10 · Minor
- Hot days now (above 99°F)
- 7 days/yr
- Hot days in 30 yrs
- 16 days/yr
Wind risk 6/10 · Moderate
- Chance of severe wind over 30 yrs
- 27.0%
Air-quality risk 4/10 · Minor
- Unhealthy air days now
- 3 days/yr
- Unhealthy air days in 30 yrs
- 5 days/yr
Risk factors via First Street. Map © Google.
Why this score? — see what drove the B- grade
The composite is a weighted blend of 9 inputs, each scored 0–100. Each bar is that input's sub-score; the figure is the points it added to the 100-point composite (weight × sub-score).
- Cash flow +21.7/30.0
- ARV discount +15.0/15.0
- Schools +7.5/10.0
- DSCR +6.9/10.0
- 1% rule +6.2/10.0
- Livability +3.2/5.0
- Rent growth +2.5/5.0
- Condition / age +2.5/5.0
- Appreciation +0.0/10.0
$439,000
🖨 Deal sheet (PDF) 📄 Offer letter ✓ Due diligence
Listing remarks MLS
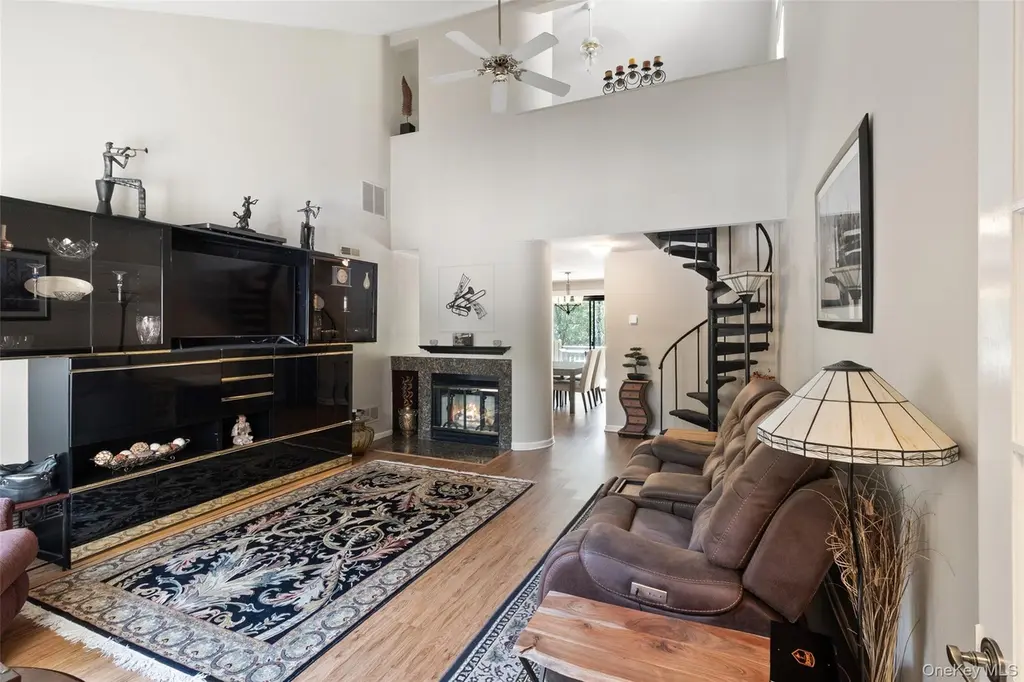
Rare 1 Bedroom With Loft, With Private Wooded Views In Back!!!! Includes Family Room & Spacious Loft With Finished Storage Room! Completely Upgraded Bathroom With Elegant Tile And Vanity. Common Garage Was Sold Seperately For $9,000 On September 2, 1999 Garage Available Seperately Ask Listing Agent For Details.
Key facts
- $530 HOA
- Parking
- Community pool
Property features AI
Finance
- HOA & community: Plaza Management association; Monthly HOA fee of $530; Association covers common area and exterior maintenance, grounds care, snow removal, and trash; Quarterly water fee; Community amenities: pool, tennis courts, basketball court
Exterior
- Parking: One assigned common parking space
- Utilities: Public sewer; Electric service by NYSEG; Private trash collection
- Home design: Townhouse condominium; Two levels; Entry level: 2
- Construction: Frame construction with wood siding
- Exterior features: Balcony; Near public transit; Near shops; Near schools; Wooded setting; Community outdoor pool
Interior
- Kitchen: Dishwasher; Electric oven; Refrigerator; ENERGY STAR qualified appliances
- Bedrooms: Two-level layout with additional rooms including a library/den and a loft
- Flooring: Carpet; Hardwood
- Bathrooms: 1 full bathroom
- Heating & cooling: Electric forced-air heating; Central air conditioning; Wood-burning fireplace in family room
- Interior features: Cathedral ceilings; Ceiling fans; Smart thermostat; Storage; Blinds; Window screens; Deck (patio/porch); Pets allowed
- Laundry & utility: In-unit washer and dryer; Electric water heater
Neighborhood map
What this means for you Summary
Snapshot
- This is a 1-bed/1.0-bath single-family listed at $439k.
Deal economics
- At list price, monthly cash flow is $676 ($8k/yr) — positive.
- The deal already cash-flows at list — no discount required.
- Meets the 1% rule at list price ($5k rent vs $439k).
- Recommended offer: $432k (1.5% below list) — sets the bar for market timing.
- Cap rate 8.1% vs local median 2.6% in Scotts Corners — top-decile yield for the area; either an underpriced asset or a hidden risk that comps aren't pricing in. Stress-test before assuming the spread holds.
Location & tenants
- Location reads 63/100 on livability (#810 in NY) — a middle-class / working-renter tenant base. Strengths: crime A+, employment A+, housing B+; Watch: amenities F, commute F, cost of living F.
- Katonah-Lewisboro Union Free School District (suburban): math 75% / reading 82% proficiency, ranked #32 of 590 in NY (top 5%) — strong family-tenant draw, lease renewals of 3-5y typical; only 3% free/reduced lunch — higher-income household profile.
- Zoned schools: Meadow Pond Elementary School (math 77% / reading 87%, grade A+, #138 of 2,108 statewide, top 8%, 342 students, 8% FRL); John Jay Middle School (math 58% / reading 79%, grade A, #94 of 729 statewide, top 13%, 662 students, 7% FRL); John Jay High School (math 98% / reading 82%, grade A+, #238 of 1,100 statewide, top 23%, 917 students, 9% FRL) — zoned schools at 8% FRL track the district average.
- Market conditions: 54 active listings in the ZIP; 1 comparable units currently listed for rent nearby; 954 units permitted in Westchester County in 2024 (649 in 5+ unit buildings).
Forward outlook
- Local home prices are declining (-3.0%/yr); year-one equity from $3k of loan paydown is wiped out by about $13k of value loss. Plan a longer hold.
- Westchester County population projected at +10% by 2050 — modest demand growth; plan on rents tracking national, not racing it.
Negotiation context
- It's been on market 22 days — a 2% lower offer ($432k) is reasonable based on typical stale-listing flexibility.
- 3 sale attempts since 30y ago; this cycle's ask is 33% above the opening price — seller raised mid-cycle; expect resistance to lowballs.
- Current owner paid $315k; 39% above their basis — modest negotiation headroom, anchor on the comps not their cost.
Risks & watch-outs
- Climate carrying-cost: major wind risk, 27% chance of damaging wind over 30y — expect insurance premiums to compound above CPI over the hold.
Questions for the listing agent
- What does the HOA fee cover, when was the last increase, and are there any pending special assessments or reserve-fund shortfalls?
- Is there a deadline driving the sale (1031 exchange, divorce, estate, relocation)? That informs how much negotiation room exists.
- What's the average days-on-market for RENTAL listings here right now (not sales)? A rising rental-DOM trend means longer vacancies and softer asking-rent achievability than the comps imply.
- What's the recent tenant-quality profile in this submarket — average credit score on applications, eviction rate, late-payment / NSF rate, and stable-employment percentage? A property-management company in the area should have these aggregated.
- How much new for-sale + rental construction is in the pipeline within 1–3 miles? Heavy new supply typically softens prices + rents 12–24 months out; constrained supply supports both.
Investment metrics
- 1% rule
- 1.12% ✓
- Cap rate
- 8.14%
- Cash-on-cash
- 6.60%
- DSCR
- 1.29
- GRM
- 7.5
CMA / ARV
- ARV (on-the-fly)
- $834,432
- Comps found
- 2
Show comp detail 2 sales within ~0.75 mi
| Address | Dist | Beds/Ba | Sqft | Sold | Price | $/sf | Match |
|---|---|---|---|---|---|---|---|
| 28 West Rd | 0.59mi | 2/1.0 (+1) | 1,176 (-10%) | 13mo | $550,000 | $468 | 40 |
| 97 Hack Green Rd | 0.75mi | 2/1.5 (+1) | 1,260 (-4%) | 19mo | $801,000 | $636 | 36 |
Match score weights: distance 35% · size 25% · config 20% · recency 20%. Top-matched comps best support the ARV.
Projected returns pro-forma
-3.0% appreciation · 3.0% rent growth · sell at horizon
- IRR
- -6.1%
- Equity multiple
- 0.77×
- Total profit
- $-27,881
- Equity at exit
- $65,456
- IRR
- 3.6%
- Equity multiple
- 1.26×
- Total profit
- $31,899
- Equity at exit
- $37,957
Cash invested: $122,920 (down + closing). Projections, not guarantees.
Landlord ↔ Tenant lean methodology
- Overall (STATE)
- 15 Strongly Tenant-Friendly
- State New York
- 15 Strongly Tenant-Friendly · D+10
- County
- — inherits STATE
- City
- — inherits STATE
ZIP-level market 10590
- Home prices YoY
- -30.8%
- Active inventory
- 54
- Price-to-rent
- 7.5×
Monthly cashflow live
- Estimated rent
- $4,900 medium interval (Pro) →
- Mortgage (P&I)
- −$2,302
- Tax from tax record
- −$179 /mo · $2,154/yr
- Insurance
- −$183
- HOA
- −$530
- Vacancy / Maint / Mgmt
- −$1,029
- Net cashflow
- $676
Break-even live
Sensitivity live
| Price | -10% $925 | -5% $801 | +0% $676 | +5% $552 | +10% $428 |
|---|---|---|---|---|---|
| Rent | -10% $289 | -5% $483 | +0% $676 | +5% $870 | +10% $1,064 |
| Rate | -1.0pp $898 | -0.5pp $788 | base $676 | +0.5pp $563 | +1.0pp $447 |
UW: 25.0% down · 7.5% · 30yr · 1.5% tax · 5.0% vac · 8.0% maint · 8.0% mgmt
Financing live
Cash to close
- Down payment
- $109,750
- Closing costs
- $13,170
- Reserves months
- —
- Total cash needed
- —
Loan-product check · same deal, 3 products live
Conventional
25% down · 7.5% · 30yr
- Down + closing
- —
- Monthly P&I
- —
- Monthly cashflow
- —
- DSCR
- —
- Eligible?
- —
Personal DTI + credit; lowest rate.
DSCR
20% down · 8.5% · 30yr
- Down + closing
- —
- Monthly P&I
- —
- Monthly cashflow
- —
- DSCR
- —
- Eligible?
- —
No personal income docs; deal must DSCR.
Hard money
10% down · 12.0% · 12mo
- Down + closing
- —
- Monthly P&I
- —
- Monthly cashflow
- —
- DSCR
- —
- Eligible?
- —
Short-term bridge; refi at stabilization.
Rent comps 1 comps
| Address | Beds | Baths | Sqft | Rent | $/sqft | DOM | Units | Dist |
|---|---|---|---|---|---|---|---|---|
| 280 Boulder Ridge Rd Unit 2F South Salem, NY | 2.0 | 2.5 | 1568 | $4,900 | $3.12 | 3d | 1 | 0.28mi |
HOA detail
- Monthly dues
- $530 · $6,360/yr
Listing history 31 events
-
2026-06-18days on market $439,000 Active 22 DOM
-
2026-06-17price $439,000 Active 21 DOM
-
2026-06-17days on market $459,000 Active 21 DOM
-
2026-06-16days on market $459,000 Active 20 DOM
-
2026-06-15days on market $459,000 Active 19 DOM
-
2026-06-13days on market $459,000 Active 17 DOM
-
2026-06-13days on market $459,000 Active 16 DOM
-
2026-06-10days on market $459,000 Active 14 DOM
-
2026-06-09days on market $459,000 Active 13 DOM
-
2026-06-08days on market $459,000 Active 12 DOM
-
2026-06-07days on market $459,000 Active 11 DOM
-
2026-06-05days on market $459,000 Active 8 DOM
-
2026-06-03days on market $459,000 Active 7 DOM
-
2026-06-03days on market $459,000 Active 6 DOM
-
2026-06-01days on market $459,000 Active 5 DOM
-
2026-05-31days on market $459,000 Active 4 DOM
-
2026-05-23historical $459,000
-
2021-08-14historical
-
2021-05-14$329,000 Active
-
2021-05-03price $329,000
-
2021-05-03historical
-
2005-09-27soldstatus $315,000
-
2001-10-09soldstatus $199,000
-
1999-10-12soldstatus $158,500
-
1999-09-02soldstatus $149,900 318-char remark
Show marketing remark (318 chars)
Rare 1 Bedroom With Loft, With Private Wooded Views In Back!!!! Includes Family Room & Spacious Loft With Finished Storage Room! Completely Upgraded Bathroom With Elegant Tile And Vanity. Common Garage Was Sold Seperately For $9,000 On September 2, 1999 Garage Available Seperately Ask Listing Agent For Details.
-
1999-06-28$149,900 318-char remark
Show marketing remark (318 chars)
Rare 1 Bedroom With Loft, With Private Wooded Views In Back!!!! Includes Family Room & Spacious Loft With Finished Storage Room! Completely Upgraded Bathroom With Elegant Tile And Vanity. Common Garage Was Sold Seperately For $9,000 On September 2, 1999 Garage Available Seperately Ask Listing Agent For Details.
-
1996-11-26price $149,500
-
1996-11-26soldstatus $142,000
-
1996-11-25soldstatus $155,000
-
1996-07-15$142,000
-
1988-01-16soldstatus $100,000
ⓘ Source: listings_history table (triggers on properties + properties_extension) + one-shot
backfill from property_details.listing_events for pre-trigger history.
Tax reassessment forecast NY · Partial reset (capped growth)
- Current annual tax
- $2,154 · $179/mo
- Projected year-2 tax
- $4,786 · $399/mo
- Expected delta
- +$2,633/yr (+$219/mo · 122.2%)
ⓘ Screening estimate from a state-policy table — verify with the county assessor before closing.
Climate risk First Street
- Flood 1/10 Low FEMA zone X (unshaded) · 0% chance over 30 yrs
- Wildfire 2/10 Low
- Heat 4/10 Moderate 7 d/yr ≥99°F today · 16 d/yr by 30 yrs out
- Wind 6/10 Major 27% chance of damaging wind over 30 yrs
- Air quality 4/10 Moderate 3 unhealthy d/yr today · 5 by 30 yrs out
Nearby sold comps map
Loading sold comps map…
Walkable amenities ~0.75 mi
Loading nearby amenities…
Taxation est. · year 1
- Rental income
- $58,800
- − Mortgage interest
- −$24,591
- − Property taxes
- −$2,154
- − Insurance
- −$2,195
- − Repairs & maintenance
- −$4,704
- − Management
- −$4,704
- − HOA
- −$6,360
- − Depreciation
- −$12,771
- Taxable income
- $1,322
- Est. tax owed @ 24.0%
- −$317
- After-tax cash flow
- $7,800/yr
For passive investors: Depreciation is non-cash, so a rental often shows a tax loss while cash-flowing — sheltering income. Rental losses are passive: they offset passive income freely, and up to $25,000/yr can offset ordinary (W-2) income if you actively participate and your MAGI is under $100k (phasing out to $0 by $150k); unused losses carry forward. On sale, claimed depreciation is recaptured at up to 25%, and gains may owe capital-gains tax (a 1031 exchange can defer both). Figures are a year-1 estimate at your 24.0% rate — not tax advice; consult a CPA.
Schools (NCES district)
- District
- Katonah-Lewisboro Union Free School District
- NCES district ID
- 3616080
- Math proficiency
- 75% ▼ -8.00%
- Reading proficiency
- 82% ▲ 2.00%
- Median HH income
- $140,994
- Composite
- 75.09/100
- National rank
- #142
- State rank
- #32 of 590 in NY
Livability — Scotts Corners
- Score
- 63/100
- State rank
- #810
- US rank
- #15702
Category grades
Schools grade is shown separately in the Schools card above.
Census & demographics
- Population (ZIP)
- 7,314
Population outlook (Westchester County) Hauer SSP2
- Today (2025)
- 1,028,035 people
- By 2030
- 1,051,636 · +2.3%
- By 2040
- 1,098,520 · +6.9%
- By 2050
- 1,136,044 · +10.5%
- By 2075
- 1,196,925 · +16.4%
- By 2100
- 1,175,147 · +14.3%
Race, ethnicity, and origin ACS 2023
- Neighborhood character
- Predominantly White (84%)
- Race & ethnicity
- White 84% Two or more races 8% Hispanic / Latino 6% Asian 4% Black 1%
- Hispanic origin (detail)
- Puerto Rican 3%
- Common ancestry
- Italian 4% Romanian 3% Scotch-Irish 2%
- Foreign-born
- 13% · Canada, South Korea, Jamaica
- Languages at home
- 90% English-only · Spanish 4% Other Indo-European 2% Korean 1%
Political lean MEDSL · Westchester
- 2024 margin
- Strong D (+26.3) · D 63.1% · R 36.9%
- 2008→2024 swing
- -1.3pp toward R · 2008: 27.6pp · 2024: 26.3pp
- All cycles
- 2024: D+26.3 2020: D+36.3 2016: D+32.8 2012: D+22.2 2008: D+27.6
Not yet ingested
- Civics
- —
Market trends
- HPI YoY
- ▼ -66.87%
- Current HPI
- 150.088
- Rent YoY
- —
- Metro
- —
- State GDP YoY
- ▲ 2.60%
- F500 in state
- 92
Industry mix (Fortune 500 HQ in NY)
| Industry | F500 HQs | Revenue |
|---|---|---|
| Financial Services | 10 | $950B |
|
||
| Consumer Goods | 9 | $162B |
|
||
| Insurance | 4 | $225B |
|
||
| Telecommunications | 2 | $144B |
|
||
| Pharmaceuticals | 2 | $112B |
|
||
| Media / Entertainment | 2 | $69B |
|
||
Price history
+359.0% since first listed15 events — show timeline
- 2026-05-23 Coming Soon $459,000 OneKey® MLS as Distributed by MLS Grid
- 2021-08-14 Listing Removed — OneKey® MLS as Distributed by MLS Grid
- 2021-05-14 Listed $329,000 OneKey® MLS as Distributed by MLS Grid
- 2021-05-03 Price Changed $329,000 OneKey® MLS as Distributed by MLS Grid
- 2021-05-03 Coming Soon — OneKey® MLS as Distributed by MLS Grid
- 2005-09-27 Sold (Public Records) $315,000 Public Records
- 2001-10-09 Sold (Public Records) $199,000 Public Records
- 1999-10-12 Sold (Public Records) $158,500 Public Records
- 1999-09-02 Sold (MLS) $149,900 HGMLS
- 1999-06-28 Listed $149,900 HGMLS
- 1996-11-26 Sold (MLS) $142,000 HGMLS
- 1996-11-26 Price Changed $149,500 HGMLS
- 1996-11-25 Sold (Public Records) $155,000 Public Records
- 1996-07-15 Listed $142,000 HGMLS
- 1988-01-16 Sold (Public Records) $100,000 Public Records
Property tax history
+2.2%/yrLatest (2025): $2,154 · +3.3% YoY. Source: county tax records.
Cash-flow waterfall
monthlySold comps — $/sqft
last 12 mo · ≤1 miLoading sold comps…