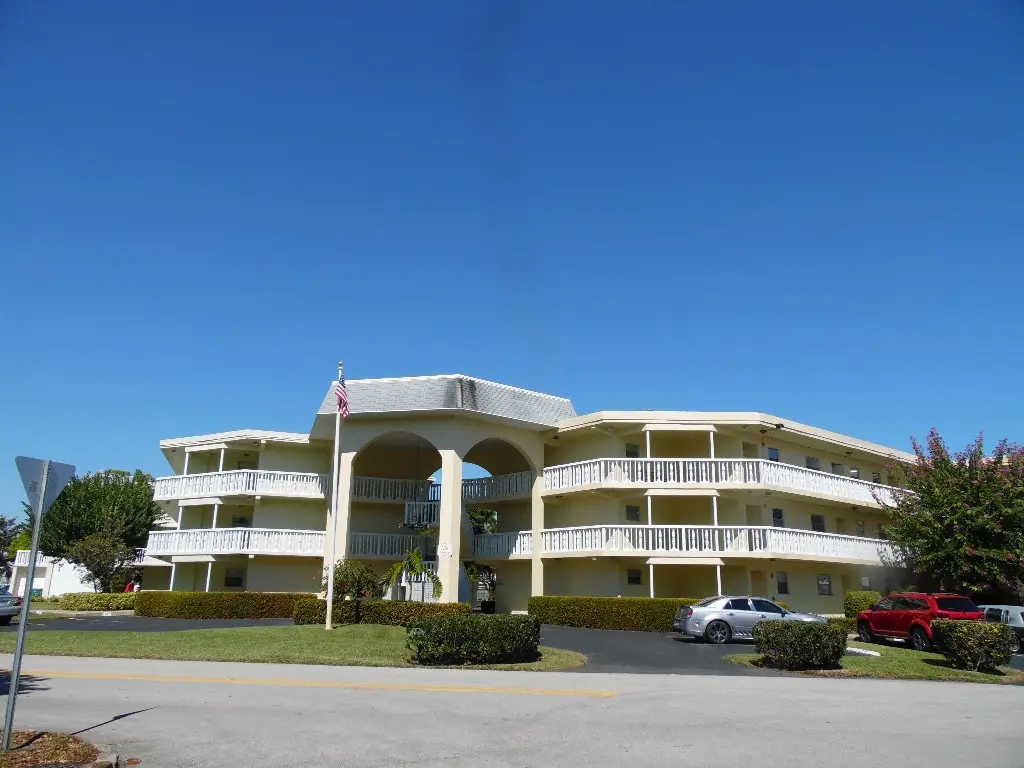
1100 Ponce De Leon Cir Unit N102 · Vero Beach, FL
Flood risk 5/10 · Moderate
- FEMA flood zone
- X (unshaded)
- Chance of flooding over 30 yrs
- 0.24%
- Est. flood insurance / yr
- $507 – $1,088
Fire risk 2/10 · Minimal
- Est. fire insurance / yr
- $947 – $1,759
Heat risk 10/10 · Severe
- Hot days now (above 105°F)
- 7 days/yr
- Hot days in 30 yrs
- 26 days/yr
Wind risk 10/10 · Severe
- Chance of severe wind over 30 yrs
- 99.0%
Air-quality risk 1/10 · Minimal
- Unhealthy air days now
- 0 days/yr
- Unhealthy air days in 30 yrs
- 0 days/yr
Risk factors via First Street. Map © Google.
Why this score? — see what drove the C grade
The composite is a weighted blend of 9 inputs, each scored 0–100. Each bar is that input's sub-score; the figure is the points it added to the 100-point composite (weight × sub-score).
- Cash flow +18.0/30.0
- ARV discount +10.4/15.0
- 1% rule +9.8/10.0
- DSCR +5.7/10.0
- Schools +4.2/10.0
- Livability +4.0/5.0
- Condition / age +3.8/5.0
- Rent growth +2.1/5.0
- Appreciation +0.0/10.0
$119,900
🖨 Deal sheet 📄 Offer letter ✓ Due diligence
Listing remarks MLS
Bargain price to settle estate! Much-desired first floor condo, parking just steps away, no elevator hassle! All rooms tiled, including pretty porch! 2BR/2BA! Community heated pool, library clubhouse. Vacant, immediate occupancy if you wish. Low condo fee only $250 a month! Full price, cash offers only. Sizes are approx & subj. to error.
Key facts
- White wood cabinets
- New kitchen
- Tile floors
Tags
Property features AI
Finance
- HOA & community: Association: AR Choice; Monthly association fee of $467; Association fee covers common areas, insurance, structure maintenance, reserves, sewer, trash and water; Community amenities include pool, elevator, game room, library, bicycle storage, sidewalks and trash chute; Senior community
Exterior
- Parking: Assigned uncovered parking
- Utilities: Public water; Public sewer
- Home design: Residential property with a view; Faces north; 3 stories
- Construction: Block, concrete and stucco construction; Built-up / tar-and-gravel roof
- Exterior features: Enclosed porch; Covered porch; Screened porch; Awnings
Interior
- Kitchen: Dishwasher; Microwave; Range; Refrigerator; Disposal
- Bedrooms: Bedroom — 11 x 10; Bedroom — 13 x 12
- Flooring: Tile
- Bathrooms: 2 full bathrooms
- Heating & cooling: Electric heating; Electric cooling
- Interior features: Pantry; Single-hung windows with window treatments; Unfurnished
- Laundry & utility: Common area laundry; Electric water heater
Neighborhood map
What this means for you Summary
Snapshot
- This is a 2-bed/2.0-bath townhouse listed at $120k. Condition is rated good.
Deal economics
- At list price, monthly cash flow is $104 ($1k/yr) — positive.
- The deal already cash-flows at list — no discount required.
- Meets the 1% rule at list price ($2k rent vs $120k).
- Recommended offer: $116k (3.0% below list) — sets the bar for market timing.
- Cap rate 7.3% vs local median 2.9% in Vero Beach — top-decile yield for the area; either an underpriced asset or a hidden risk that comps aren't pricing in. Stress-test before assuming the spread holds.
Location & tenants
- Location reads 80/100 on livability (#116 in FL, #1,784 nationally) — a professional / high-income tenant draw. Strengths: crime A+, commute A+, health & safety A+; Watch: employment D+, amenities D.
- Indian River (other): math 48% / reading 52% proficiency, ranked #35 of 73 in FL (top 48%) — acceptable for families but not a draw, mixed tenant base, ~2y average lease.
- Market conditions: Rents soft (-1.7%/yr); 206 active listings in the ZIP; 32 comparable units currently listed for rent nearby; rentals at typical pace (median 21d on market — plan ~3-4 weeks tenant-placement turnaround); 564 units permitted in Indian River County in 2024 (281 in 5+ unit buildings).
- This rent runs 39% of the median local income ($55k/yr) — at the standard rent-burdened threshold; future hikes will face affordability resistance.
Forward outlook
- Local home prices are declining (-3.0%/yr); year-one equity from $829 of loan paydown is wiped out by about $4k of value loss. Plan a longer hold.
- Indian River County population projected at +18% by 2050 — long-run rental-demand tailwind backs the buy-and-hold thesis.
Negotiation context
- It's been on market 36 days — a 3% lower offer ($116k) is reasonable based on typical stale-listing flexibility.
- 2 sale attempts since 2y ago; this cycle's ask has dropped $10k (8%) from the opening price — seller is motivated, your offer sets the floor, not the list.
- Current owner paid $30k; list at $120k implies a 300% gain — meaningful room to come down on a strong offer.
Risks & watch-outs
- Watch-outs: HOA is 26% of rent.
- Climate carrying-cost: moderate flood risk; severe wind risk, 99% chance of damaging wind over 30y; extreme-heat days projected 7→26/yr by 2055 (HVAC capex compounding) — expect insurance premiums to compound above CPI over the hold.
Questions for the listing agent
- It's been on market 36 days. Have you received any prior offers? Is the seller open to a 3% concession, seller financing, or rate buy-down credit?
- Built in 1974 — when were the roof, HVAC, electrical panel, plumbing, and water heater last replaced?
- What does the HOA fee cover, when was the last increase, and are there any pending special assessments or reserve-fund shortfalls?
- Is there a deadline driving the sale (1031 exchange, divorce, estate, relocation)? That informs how much negotiation room exists.
- What's the average days-on-market for RENTAL listings here right now (not sales)? A rising rental-DOM trend means longer vacancies and softer asking-rent achievability than the comps imply.
- What's the recent tenant-quality profile in this submarket — average credit score on applications, eviction rate, late-payment / NSF rate, and stable-employment percentage? A property-management company in the area should have these aggregated.
- How much new for-sale + rental construction is in the pipeline within 1–3 miles? Heavy new supply typically softens prices + rents 12–24 months out; constrained supply supports both.
Investment metrics
- 1% rule
- 1.48% ✓
- Cap rate
- 7.33%
- Cash-on-cash
- 3.72%
- DSCR
- 1.17
- GRM
- 5.6
CMA / ARV
- ARV (on-the-fly)
- $128,064
- Comps found
- 12
Show comp detail 12 sales within ~0.75 mi
| Address | Dist | Beds/Ba | Sqft | Sold | Price | $/sf | Match |
|---|---|---|---|---|---|---|---|
| 1100 Ponce De Leon Cir #204 | 0.04mi | 2/2.0 | 928 (0%) | 3mo | $113,000 | $122 | 96 |
| 1100 Ponce De Leon Cir Unit E306 | 0.04mi | 2/2.0 | 928 (0%) | 13mo | $128,000 | $138 | 88 |
| 1100 N Ponce De Leon Cir Unit N203 | 0.00mi | 2/2.0 | 1,000 (+8%) | 0mo | $112,500 | $113 | 87 |
| 1100 W Ponce De Leon Cir W Unit W305 | 0.04mi | 2/2.0 | 840 (-10%) | 0mo | $100,000 | $119 | 82 |
| 923 22nd Pl #217 | 0.21mi | 2/2.0 | 860 (-7%) | 9mo | $92,000 | $107 | 70 |
| 835 18th St #103 | 0.56mi | 2/2.0 | 960 (+3%) | 1mo | $126,000 | $131 | 67 |
| 715 20th St #202 | 0.52mi | 2/1.0 | 940 (+1%) | 5mo | $130,000 | $138 | 65 |
| 835 18th St #710 | 0.56mi | 2/2.0 | 960 (+3%) | 8mo | $159,999 | $167 | 61 |
| 835 18th St #801 | 0.56mi | 2/2.0 | 960 (+3%) | 10mo | $158,000 | $165 | 60 |
| 715 20th St #201 | 0.52mi | 2/1.0 | 940 (+1%) | 13mo | $145,000 | $154 | 59 |
| 835 18th St #402 | 0.56mi | 2/2.0 | 960 (+3%) | 12mo | $155,000 | $161 | 58 |
| 835 18th St #203 | 0.56mi | 2/2.0 | 1,000 (+8%) | 8mo | $119,000 | $119 | 54 |
Match score weights: distance 35% · size 25% · config 20% · recency 20%. Top-matched comps best support the ARV.
Projected returns pro-forma
-3.0% appreciation · 0.0% rent growth · sell at horizon
- IRR
- -15.4%
- Equity multiple
- 0.47×
- Total profit
- $-17,682
- Equity at exit
- $17,877
- IRR
- -17.6%
- Equity multiple
- 0.24×
- Total profit
- $-25,657
- Equity at exit
- $10,367
Cash invested: $33,572 (down + closing). Projections, not guarantees.
Landlord ↔ Tenant lean methodology
- Overall (STATE)
- 87 Strongly Landlord-Friendly
- State Florida
- 87 Strongly Landlord-Friendly · R+3
- County
- — inherits STATE
- City
- — inherits STATE
ZIP-level market 32960
- Home prices YoY
- -25.5%
- Rents YoY
- -1.7%
- Active inventory
- 206
- Price-to-rent
- 5.6×
Monthly cashflow live
- Estimated rent
- $1,772 high interval (Pro) →
- Mortgage (P&I)
- −$629
- Tax est. 1.5%
- −$150 /mo · $1,798/yr
- Insurance
- −$50
- HOA
- −$467
- Vacancy / Maint / Mgmt
- −$372
- Net cashflow
- $104
Break-even live
UW: 25.0% down · 7.5% · 30yr · 1.5% tax · 5.0% vac · 8.0% maint · 8.0% mgmt
Financing live
Cash to close
- Down payment
- $29,975
- Closing costs
- $3,597
- Reserves months
- —
- Total cash needed
- —
Loan-product check · same deal, 3 products live
Conventional
25% down · 7.5% · 30yr
- Down + closing
- —
- Monthly P&I
- —
- Monthly cashflow
- —
- DSCR
- —
- Eligible?
- —
Personal DTI + credit; lowest rate.
DSCR
20% down · 8.5% · 30yr
- Down + closing
- —
- Monthly P&I
- —
- Monthly cashflow
- —
- DSCR
- —
- Eligible?
- —
No personal income docs; deal must DSCR.
Hard money
10% down · 12.0% · 12mo
- Down + closing
- —
- Monthly P&I
- —
- Monthly cashflow
- —
- DSCR
- —
- Eligible?
- —
Short-term bridge; refi at stabilization.
Rent comps 32 comps
| Address | Beds | Baths | Sqft | Rent | $/sqft | DOM | Units | Dist |
|---|---|---|---|---|---|---|---|---|
| 1100 Ponce de Leon Cir #305 Vero Beach, FL | 2.0 | 2.0 | 840 | $1,350 | $1.61 | 21d | 1 | 0.02mi |
| 2222 Ponce De Leon Cir Unit B Vero Beach, FL | 2.0 | 1.0 | 970 | $1,650 | $1.70 | 13d | 1 | 0.04mi |
| 2359 De Soto Ave Vero Beach, FL | 1.0 | 1.0 | 570 | $1,500 | $2.63 | 21d | 1 | 0.16mi |
| 923 22nd Pl #106 Vero Beach, FL | 2.0 | 2.0 | 860 | $1,600 | $1.86 | 21d | 1 | 0.21mi |
| 808 22nd St Unit 8 Vero Beach, FL | 2.0 | 2.0 | 1000 | $1,465 | $1.47 | 21d | 1 | 0.34mi |
| 939 19th St Unit 961 Vero Beach, FL | 2.0 | 2.0 | 1000 | $1,850 | $1.85 | 21d | 1 | 0.36mi |
| 1429 19th Pl #4 Vero Beach, FL | 2.0 | 1.0 | 873 | $1,800 | $2.06 | 21d | 1 | 0.40mi |
| 1748 23rd St Vero Beach, FL | 1.0 | 1.0 | 900 | $1,250 | $1.39 | 13d | 1 | 0.50mi |
| 715 19th Pl Vero Beach, FL | 1.0–2.0 | 1.0–2.0 | 600 | $1,925 | $3.21 | 13d | 7 | 0.54mi |
| 1827 24th St Vero Beach, FL | 2.0 | 1.0 | 850 | $1,900 | $2.24 | 21d | 1 | 0.58mi |
| 1936 18th Ave Unit A Vero Beach, FL | 2.0 | 1.0 | 1100 | $2,000 | $1.82 | 21d | 1 | 0.58mi |
| 635 18th Pl Vero Beach, FL | 3.0 | 2.0 | 1120 | $2,300 | $2.05 | 21d | 1 | 0.68mi |
| 686 17th St Vero Beach, FL | 2.0 | 1.0 | 950 | $1,700 | $1.79 | 13d | 2 | 0.75mi |
| 1765 6th Ave Vero Beach, FL | 2.0 | 1.0 | 800 | $1,550 | $1.94 | 21d | 1 | 0.78mi |
| 1745 6th Ave Unit 7(R) Vero Beach, FL | 2.0 | 1.0 | 800 | $1,550 | $1.94 | 21d | 1 | 0.78mi |
| 400 18th St Vero Beach, FL | 2.0 | 2.0 | 1065 | $1,512 | $1.42 | 13d | 2 | 0.84mi |
| 400 18th St Vero Beach, FL | 2.0 | 2.0 | 1065 | $1,575 | $1.48 | 21d | 1 | 0.84mi |
| 974 14th Ln Vero Beach, FL | 1.0–3.0 | 1.0–3.0 | 1828 | $4,049 | $2.21 | 13d | 32 | 0.86mi |
| 2800 Indian River Blvd Vero Beach, FL | 1.0–2.0 | 1.5–2.0 | 847 | $3,200 | $3.78 | 13d | 5 | 1.06mi |
| 1845 Robalo Dr Unit 205 Vero Beach, FL | 2.0 | 2.0 | 1000 | $2,500 | $2.50 | 21d | 1 | 1.07mi |
| 1935 Cobia Dr Unit 202E Vero Beach, FL | 2.0 | 2.0 | 1000 | $2,250 | $2.25 | 21d | 1 | 1.09mi |
| 1860 Robalo Dr Vero Beach, FL | 2.0 | 2.0 | 950 | $2,600 | $2.74 | 21d | 2 | 1.09mi |
| 1815 Robalo Dr Unit C201 Vero Beach, FL | 1.0 | 1.0 | 650 | $1,700 | $2.62 | 13d | 1 | 1.10mi |
| 1830 Robalo Dr Apt B103 Vero Beach, FL | 1.0 | 1.0 | 650 | $2,100 | $3.23 | 13d | 1 | 1.12mi |
| 1450 5th Ave Vero Beach, FL | 3.0 | 2.0 | 1124 | $2,400 | $2.14 | 21d | 1 | 1.16mi |
| 1825 Cobia Dr Unit 103H Vero Beach, FL | 1.0 | 1.0 | 650 | $2,400 | $3.69 | 13d | 1 | 1.16mi |
| 23 Royal Palm Pointe Unit B Vero Beach, FL | 2.0 | 2.0 | 1100 | $2,695 | $2.45 | 21d | 1 | 1.16mi |
| 516 13th Pl Vero Beach, FL | 3.0 | 2.0 | 1102 | $1,800 | $1.63 | 21d | 1 | 1.20mi |
| 1510 3rd Ct Vero Beach, FL | 3.0 | 2.0 | 950 | $6,000 | $6.32 | 13d | 1 | 1.20mi |
| 1306 12th St Unit B Vero Beach, FL | 2.0 | 1.0 | 1000 | $1,600 | $1.60 | 21d | 1 | 1.21mi |
| 1200 6th Dr Vero Beach, FL | 2.0 | 2.0 | 800 | $1,550 | $1.94 | 13d | 1 | 1.29mi |
| 2145 30th Ave Vero Beach, FL | 2.0 | 2.0 | 1036 | $3,500 | $3.38 | 13d | 1 | 1.34mi |
HOA detail
- Monthly dues
- $467 · $5,604/yr
- Likely covers
- pool
Listing history 30 events
-
2026-06-19days on market $119,900 Active 36 DOM
-
2026-06-18remarks 501-char remark
-
2026-06-18days on market $119,900 Active 35 DOM
-
2026-06-17days on market $119,900 Active 34 DOM
-
2026-06-16days on market $119,900 Active 33 DOM
-
2026-06-15days on market $119,900 Active 32 DOM
-
2026-06-14days on market $119,900 Active 30 DOM
-
2026-06-13days on market $119,900 Active 29 DOM
-
2026-06-10days on market $119,900 Active 27 DOM
-
2026-06-09days on market $119,900 Active 26 DOM
-
2026-06-08days on market $119,900 Active 25 DOM
-
2026-06-07days on market $119,900 Active 24 DOM
-
2026-06-05pricedays on market $119,900 Active 21 DOM
-
2026-06-02days on market $125,000 Active 19 DOM
-
2026-06-01days on market $125,000 Active 18 DOM
-
2026-05-31days on market $125,000 Active 17 DOM
-
2026-05-30days on market $125,000 Active 16 DOM
-
2026-05-22price $125,000
-
2026-05-14$130,000 Active
-
2024-10-19historical $1,500
-
2024-10-06price $1,500
-
2024-09-23price $1,600
-
2024-09-17price $2,300
-
2024-08-31price $1,600
-
2024-08-29price $2,400
-
2024-08-20price $2,500
-
2024-08-02price $1,500
-
2024-07-26price $1,595
-
2024-06-14$1,600
-
2013-01-25soldstatus $30,000 349-char remark
Show marketing remark (349 chars)
Bargain price to settle estate! Much-desired first floor condo, parking just steps away, no elevator hassle! All rooms tiled, including pretty porch! 2BR/2BA! Community heated pool, library clubhouse. Vacant, immediate occupancy if you wish. Low condo fee only $250 a month! Full price, cash offers only. Sizes are approx & subj. to error.
ⓘ Source: listings_history table (triggers on properties + properties_extension) + one-shot
backfill from property_details.listing_events for pre-trigger history.
Climate risk First Street
- Flood 5/10 Major FEMA zone X (unshaded) · 24% chance over 30 yrs
- Wildfire 2/10 Low
- Heat 10/10 Extreme 7 d/yr ≥105°F today · 26 d/yr by 30 yrs out
- Wind 10/10 Extreme 99% chance of damaging wind over 30 yrs
- Air quality 1/10 Low 0 unhealthy d/yr today · 0 by 30 yrs out
Nearby sold comps map
Loading sold comps map…
Walkable amenities ~0.75 mi
Loading nearby amenities…
Taxation est. · year 1
- Rental income
- $21,260
- − Mortgage interest
- −$6,716
- − Property taxes
- −$1,798
- − Insurance
- −$600
- − Repairs & maintenance
- −$1,701
- − Management
- −$1,701
- − HOA
- −$5,604
- − Depreciation
- −$3,488
- Taxable loss
- −$348
- Est. tax savings @ 24.0%
- +$83
- After-tax cash flow
- $1,332/yr
For passive investors: Depreciation is non-cash, so a rental often shows a tax loss while cash-flowing — sheltering income. Rental losses are passive: they offset passive income freely, and up to $25,000/yr can offset ordinary (W-2) income if you actively participate and your MAGI is under $100k (phasing out to $0 by $150k); unused losses carry forward. On sale, claimed depreciation is recaptured at up to 25%, and gains may owe capital-gains tax (a 1031 exchange can defer both). Figures are a year-1 estimate at your 24.0% rate — not tax advice; consult a CPA.
Condition & rehab AI · 13 photos
This well-maintained, freshly painted condo is move-in ready with good condition and potential for further value enhancement through minor updates.
Value-add opportunities
- Both Paint the exterior — Enhances curb appeal and resale value
- Resale Replace outdated appliances — Modernizes the kitchen and appeals to buyers
- Both Upgrade lighting fixtures — Improves ambiance and energy efficiency
- Both Install new flooring in bathrooms — Enhances aesthetics and durability
- Both Paint interior walls — Fresh paint improves aesthetics and resale value
Renovation cost estimate screening
Value-add ROI direction
- Both Paint the exterior — Enhances curb appeal and resale value ↑
- Resale Replace outdated appliances — Modernizes the kitchen and appeals to buyers ↑
- Both Upgrade lighting fixtures — Improves ambiance and energy efficiency ↑
- Both Install new flooring in bathrooms — Enhances aesthetics and durability ↑
- Both Paint interior walls — Fresh paint improves aesthetics and resale value ↑
ⓘ Cost ranges are severity-bucket heuristics (US national rule-of-thumb). Get contractor quotes + a written scope before underwriting a rehab budget.
Schools (NCES district)
- District
- Indian River
- NCES district ID
- 1200930
- Math proficiency
- 48% ▼ -9.00%
- Reading proficiency
- 52% ▼ -3.00%
- Median HH income
- $46,597
- Composite
- 42.45/100
- National rank
- #3218
- State rank
- #35 of 73 in FL
Livability — Vero Beach
- Score
- 80/100
- State rank
- #116
- US rank
- #1784
Category grades
Schools grade is shown separately in the Schools card above.
Census & demographics
- Census place
- Vero Beach, FL
- County
- Indian River County · 143,738 people
- City population
- 98,707
- Metro
- Sebastian-Vero Beach, FL
- Population (ZIP)
- 25,259
- Household income
- $54,682
- Rent vs Own
- Severe rent burden
- 1166.0
Population outlook (Indian River County) Hauer SSP2
- Today (2025)
- 165,104 people
- By 2030
- 172,869 · +4.7%
- By 2040
- 185,640 · +12.4%
- By 2050
- 194,465 · +17.8%
- By 2075
- 211,115 · +27.9%
- By 2100
- 211,781 · +28.3%
Race, ethnicity, and origin ACS 2023
- Neighborhood character
- Majority White (65%)
- Race & ethnicity
- White 65% Hispanic / Latino 16% Two or more races 12% Black 10% Asian 4% Native American 1%
- Hispanic origin (detail)
- Mexican 6% Puerto Rican 3% Cuban 2%
- Common ancestry
- Italian 4% Slovak 3% Romanian 3%
- Foreign-born
- 11% · Canada, Jamaica, Vietnam
- Languages at home
- 82% English-only · Spanish 13% French/Haitian/Cajun 2% Other Asian/Pacific 1%
Political lean MEDSL · Indian River
- 2024 margin
- Strong R (+27.4) · D 36.0% · R 63.4%
- 2008→2024 swing
- -12.5pp toward R · 2008: -14.8pp · 2024: -27.4pp
- All cycles
- 2024: R+27.4 2020: R+21.6 2016: R+24.5 2012: R+22.3 2008: R+14.8
Not yet ingested
- Civics
- —
Market trends
- HPI YoY
- ▼ -103.20%
- Current HPI
- 302.0029
- Rent YoY
- ▼ -1.66%
- Metro
- Sebastian-Vero Beach, FL
- State GDP YoY
- ▲ 3.28%
- F500 in state
- 36
Industry mix (Fortune 500 HQ in FL)
| Industry | F500 HQs | Revenue |
|---|---|---|
| Industrial Technology | 2 | $29B |
|
||
| Insurance | 2 | $17B |
|
||
| Retail | 1 | $60B |
|
||
| Technology Distribution | 1 | $58B |
|
||
| Homebuilding | 1 | $35B |
|
||
| Technology Manufacturing | 1 | $35B |
|
||
Price history
+316.7% since first listed13 events — show timeline
- 2026-05-22 Price Changed $125,000 RAIRCMLS
- 2026-05-14 Listed $130,000 RAIRCMLS
- 2024-10-19 Rental Removed $1,500 RAIRCMLS
- 2024-10-06 Price Changed $1,500 RAIRCMLS
- 2024-09-23 Price Changed $1,600 RAIRCMLS
- 2024-09-17 Price Changed $2,300 RAIRCMLS
- 2024-08-31 Price Changed $1,600 RAIRCMLS
- 2024-08-29 Price Changed $2,400 RAIRCMLS
- 2024-08-20 Price Changed $2,500 RAIRCMLS
- 2024-08-02 Price Changed $1,500 RAIRCMLS
- 2024-07-26 Price Changed $1,595 RAIRCMLS
- 2024-06-14 Listed for Rent $1,600 RAIRCMLS
- 2013-01-25 Sold (MLS) $30,000 RAIRCMLS
Cash-flow waterfall
monthlySold comps — $/sqft
last 12 mo · ≤1 miLoading sold comps…