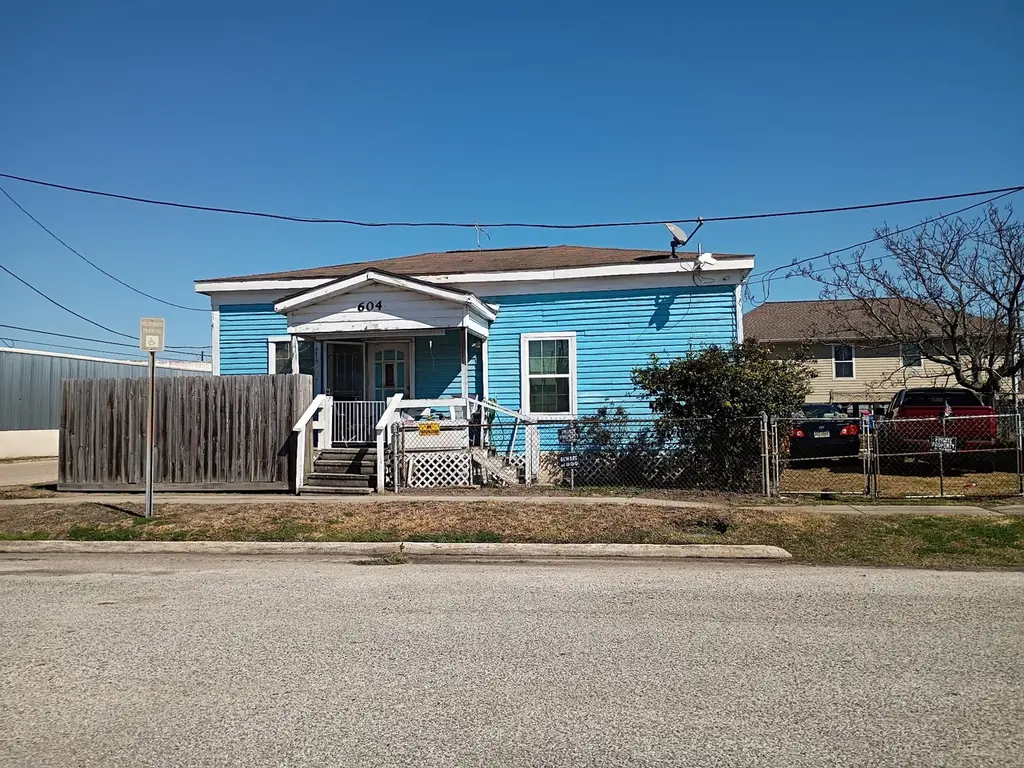
604 42nd St · Galveston, TX
Flood risk 10/10 · Severe
- FEMA flood zone
- AE
- Chance of flooding over 30 yrs
- 0.99%
- Est. flood insurance / yr
- $1,737 – $8,500
Fire risk 1/10 · Minimal
- Est. fire insurance / yr
- $1,222 – $2,270
Heat risk 10/10 · Severe
- Hot days now (above 107°F)
- 7 days/yr
- Hot days in 30 yrs
- 28 days/yr
Wind risk 10/10 · Severe
- Chance of severe wind over 30 yrs
- 99.0%
Air-quality risk 2/10 · Minimal
- Unhealthy air days now
- 1 days/yr
- Unhealthy air days in 30 yrs
- 2 days/yr
Risk factors via First Street. Map © Google.
Why this score? — see what drove the B- grade
The composite is a weighted blend of 9 inputs, each scored 0–100. Each bar is that input's sub-score; the figure is the points it added to the 100-point composite (weight × sub-score).
- Cash flow +30.0/30.0
- DSCR +10.0/10.0
- 1% rule +9.2/10.0
- ARV discount +7.5/15.0
- Livability +3.8/5.0
- Schools +3.0/10.0
- Condition / age +2.5/5.0
- Rent growth +2.2/5.0
- Appreciation +0.0/10.0
$99,000
🖨 Deal sheet 📄 Offer letter ✓ Due diligence
Listing remarks MLS
Opportunity on the Harborside! Unique corner-lot property includes home + adjacent lot at 606 42nd St. (addtl 1,209 sq. ft.), creating a rare chance to own extra land in a prime location. Whether you envision expanding, building, adding outdoor entertaining space, extra parking, or holding for future investment potential, the additional lot adds flexibility and value that’s hard to find on the island. Home features 2 bedrooms w/ closets, 1 hall bath, an open living/dining, and an expanded kitchen with washer/dryer connections. Electrical has been updated, and plumbing is believed to be updated. A third room w/closet + exterior access offers flexibility. Home is livable but needs a new roof and TLC, ideal for renovation, investment, Airbnb potential, or redevelopment. Blocks from Historic Strand District, Ball HS, community rec center and pool, and close to UTMB. Buyer to verify dimensions. Kitchen addition measurements may vary. Sold as-is.
Key facts
- Yard space
- 2,278 sq ft lot
- Listed 13 days
Tags
Neighborhood map
What this means for you Summary
Snapshot
- This is a 2-bed/1.0-bath single-family listed at $99k.
Deal economics
- At list price, monthly cash flow is $16 ($197/yr) — positive.
- The deal already cash-flows at list — no discount required.
- Meets the 1% rule at list price ($1k rent vs $99k).
- Cap rate 11.7% vs local median 0.1% in Galveston — top-decile yield for the area; either an underpriced asset or a hidden risk that comps aren't pricing in. Stress-test before assuming the spread holds.
Location & tenants
- Location reads 76/100 on livability (#108 in TX, #3,559 nationally) — a middle-class / working-renter tenant base. Strengths: commute A+, cost of living A+, housing A+; Watch: amenities D+, employment D, crime F.
- Galveston ISD (town): math 33% / reading 39% proficiency, ranked #514 of 826 in TX (top 62%) — families likely to look elsewhere, expect single-tenant / working-renter base with shorter leases; 68% free/reduced lunch — lower-income household profile, screen leases tightly.
- Market conditions: Rents soft (-1.1%/yr); 622 active listings in the ZIP; 37 comparable units currently listed for rent nearby; rentals lingering (median 44d on market — plan ~5-8 weeks vacancy on turnover, expect pricing pressure); 59% of comp listings sitting > 30 days — soft ceiling on asking rent; 3,258 units permitted in Galveston County in 2024 (0 in 5+ unit buildings).
- This rent runs 37% of the median local income ($45k/yr) — at the standard rent-burdened threshold; future hikes will face affordability resistance.
Forward outlook
- Local home prices are declining (-3.0%/yr); year-one equity from $684 of loan paydown is wiped out by about $3k of value loss. Plan a longer hold.
- Galveston County population projected at +43% by 2050 — long-run rental-demand tailwind backs the buy-and-hold thesis.
Negotiation context
- Only 14 days on market — expect competitive offers; lowballing is unlikely to land.
- 3 sale attempts since 17y ago; this cycle's ask has dropped $66k (40%) from the opening price — seller is motivated, your offer sets the floor, not the list.
Risks & watch-outs
- Watch-outs: flood insurance adds $427/mo.
- Climate carrying-cost: in FEMA flood zone AE (mandatory federal flood insurance); severe wind risk, 99% chance of damaging wind over 30y; extreme-heat days projected 7→28/yr by 2055 (HVAC capex compounding) — expect insurance premiums to compound above CPI over the hold.
Questions for the listing agent
- Built in 1962 — when were the roof, HVAC, electrical panel, plumbing, and water heater last replaced?
- What's the actual annual flood-insurance premium (NFIP or private), and is the property in a SFHA with mandatory coverage?
- Is there a deadline driving the sale (1031 exchange, divorce, estate, relocation)? That informs how much negotiation room exists.
- Crime grade is F in this area — have there been break-ins, vandalism, or insurance claims at this property in the last 3 years? What carrier currently insures it and at what premium?
- What's the average days-on-market for RENTAL listings here right now (not sales)? A rising rental-DOM trend means longer vacancies and softer asking-rent achievability than the comps imply.
- What's the recent tenant-quality profile in this submarket — average credit score on applications, eviction rate, late-payment / NSF rate, and stable-employment percentage? A property-management company in the area should have these aggregated.
- How much new for-sale + rental construction is in the pipeline within 1–3 miles? Heavy new supply typically softens prices + rents 12–24 months out; constrained supply supports both.
Investment metrics
- 1% rule
- 1.42% ✓
- Cap rate
- 11.66%
- Cash-on-cash
- 19.18%
- DSCR
- 1.85
- GRM
- 5.9
CMA / ARV
- ARV (median comp)
- $224,168
- List price
- $99,000
- Delta
- -48.70%
- Verdict
- UNDERPRICED
- Comps
- 20 within 1.0 mi
Show comp detail 12 sales within ~0.75 mi
| Address | Dist | Beds/Ba | Sqft | Sold | Price | $/sf | Match |
|---|---|---|---|---|---|---|---|
| 4214 Winnie St | 0.06mi | 2/2.0 | 1,259 (+6%) | 5mo | $220,000 | $175 | 80 |
| 4310 Broadway St | 0.25mi | 3/1.0 (+1) | 1,156 (-3%) | 2mo | $225,000 | $195 | 77 |
| 4016 Ursuline St | 0.56mi | 2/1.0 | 1,138 (-4%) | 1mo | $149,000 | $131 | 66 |
| 3602 Avenue K | 0.51mi | 2/2.0 | 1,208 (+2%) | 6mo | $187,750 | $155 | 64 |
| 4419 Ursuline St | 0.61mi | 2/1.0 | 1,200 (+1%) | 8mo | $259,000 | $216 | 64 |
| 3321 Sealy Ave | 0.62mi | 2/2.0 | 1,176 (-1%) | 7mo | $186,000 | $158 | 59 |
| 4327 Avenue O | 0.72mi | 2/2.0 | 1,213 (+2%) | 4mo | $380,000 | $313 | 56 |
| 1309 Milam Dr | 0.75mi | 2/2.0 | 1,260 (+6%) | 2mo | $260,000 | $206 | 50 |
| 1410 35th St | 0.73mi | 2/1.0 | 1,104 (-7%) | 5mo | $90,000 | $82 | 49 |
| 3513 Ursuline St | 0.75mi | 3/4.0 (+1) | 1,220 (+2%) | 1mo | $269,900 | $221 | 43 |
| 4413 Avenue O | 0.73mi | 2/1.0 | 1,338 (+12%) | 8mo | $261,000 | $195 | 39 |
| 4909 Travis Dr | 0.75mi | 3/1.0 (+1) | 1,367 (+15%) | 2mo | $265,000 | $194 | 34 |
Match score weights: distance 35% · size 25% · config 20% · recency 20%. Top-matched comps best support the ARV.
Projected returns pro-forma
-3.0% appreciation · 0.0% rent growth · sell at horizon
- IRR
- -20.4%
- Equity multiple
- 0.32×
- Total profit
- $-18,831
- Equity at exit
- $14,761
- IRR
- -31.0%
- Equity multiple
- -0.08×
- Total profit
- $-29,816
- Equity at exit
- $8,560
Cash invested: $27,720 (down + closing). Projections, not guarantees.
Landlord ↔ Tenant lean methodology
- Overall (STATE)
- 87 Strongly Landlord-Friendly
- State Texas
- 87 Strongly Landlord-Friendly · R+5
- County
- — inherits STATE
- City
- — inherits STATE
ZIP-level market 77550
- Home prices YoY
- -32.9%
- Rents YoY
- -1.1%
- Active inventory
- 622
- Price-to-rent
- 5.9×
Monthly cashflow live
- Estimated rent
- $1,401 high interval (Pro) →
- Mortgage (P&I)
- −$519
- Tax from tax record
- −$103 /mo · $1,239/yr
- Insurance
- −$41
- Flood insurance flood zone
- −$427 /mo · $5,118/yr
- HOA
- −$0
- Vacancy / Maint / Mgmt
- −$294
- Net cashflow
- $16
Break-even live
UW: 25.0% down · 7.5% · 30yr · 1.5% tax · 5.0% vac · 8.0% maint · 8.0% mgmt
Financing live
Cash to close
- Down payment
- $24,750
- Closing costs
- $2,970
- Reserves months
- —
- Total cash needed
- —
Loan-product check · same deal, 3 products live
Conventional
25% down · 7.5% · 30yr
- Down + closing
- —
- Monthly P&I
- —
- Monthly cashflow
- —
- DSCR
- —
- Eligible?
- —
Personal DTI + credit; lowest rate.
DSCR
20% down · 8.5% · 30yr
- Down + closing
- —
- Monthly P&I
- —
- Monthly cashflow
- —
- DSCR
- —
- Eligible?
- —
No personal income docs; deal must DSCR.
Hard money
10% down · 12.0% · 12mo
- Down + closing
- —
- Monthly P&I
- —
- Monthly cashflow
- —
- DSCR
- —
- Eligible?
- —
Short-term bridge; refi at stabilization.
Rent comps 37 comps
| Address | Beds | Baths | Sqft | Rent | $/sqft | DOM | Units | Dist |
|---|---|---|---|---|---|---|---|---|
| 4217 Sealy St Galveston, TX | 2.0 | 1.0 | 900 | $850 | $0.94 | 43d | 1 | 0.21mi |
| 4406 Avenue N Galveston, TX | 2.0 | 2.0 | 1197 | $1,230 | $1.03 | 3d | 1 | 0.58mi |
| 3718 Avenue M 1/2 Unit Rear Up Galveston, TX | 3.0 | 1.0 | 936 | $1,275 | $1.36 | 43d | 1 | 0.60mi |
| 3523 Avenue L Unit L Galveston, TX | 3.0 | 2.0 | 1500 | $2,250 | $1.50 | 43d | 1 | 0.61mi |
| 3501 Avenue M Galveston, TX | 3.0 | 1.0 | 950 | $1,240 | $1.31 | 43d | 1 | 0.68mi |
| 3409 Avenue L Unit Le Bleu Sirene Galveston, TX | 2.0 | 1.0 | 1006 | $1,600 | $1.59 | 43d | 1 | 0.68mi |
| 4020 Avenue O 1/2 Galveston, TX | 3.0 | 1.0 | 916 | $1,350 | $1.47 | 1d | 1 | 0.76mi |
| 2921 Avenue H Unit H Galveston, TX | 2.0 | 2.0 | 925 | $1,263 | $1.37 | 43d | 1 | 0.90mi |
| 2915 Avenue H Galveston, TX | 2.0–3.0 | 1.5–3.0 | 1118 | $1,750 | $1.57 | 1d | 15 | 0.90mi |
| 4715 Avenue P 1/2 Unit 1/2 REAR Galveston, TX | 1.0 | 1.0 | 748 | $1,395 | $1.86 | 5d | 1 | 0.99mi |
| 5006 Bernardo De Galvez Ave Unit RL14 Galveston, TX | 2.0 | 1.0 | 1080 | $1,350 | $1.25 | 43d | 1 | 1.01mi |
| 5313 Perry Ave Galveston, TX | 2.0 | 2.0 | 1036 | $1,595 | $1.54 | 22d | 1 | 1.07mi |
| 2727 Avenue K Galveston, TX | 3.0 | 1.0 | 972 | $1,900 | $1.95 | 43d | 1 | 1.07mi |
| 3602 Avenue Q 1/2 Galveston, TX | 2.0 | 1.0 | 1416 | $2,500 | $1.77 | 43d | 1 | 1.09mi |
| 2806 Avenue M 1/2 Galveston, TX | 2.0 | 1.0 | 792 | $830 | $1.05 | 43d | 1 | 1.11mi |
| 2806 Avenue M 1/2 #1 Galveston, TX | 2.0 | 1.0 | 792 | $830 | $1.05 | 24d | 1 | 1.11mi |
| 2711 Avenue K Unit 10 Galveston, TX | 3.0 | 1.0 | 950 | $1,295 | $1.36 | 20d | 1 | 1.11mi |
| 2711 Avenue K Unit 12 Galveston, TX | 3.0 | 1.0 | 950 | $1,325 | $1.39 | 43d | 1 | 1.11mi |
| 2711 Avenue K Unit 9 Galveston, TX | 3.0 | 1.0 | 950 | $1,650 | $1.74 | 20d | 1 | 1.11mi |
| 2711 Avenue K Unit 01 Galveston, TX | 3.0 | 1.0 | 800 | $1,195 | $1.49 | 43d | 1 | 1.11mi |
| 5501 Menard Ave Galveston, TX | 2.0 | 2.0 | 900 | $1,200 | $1.33 | 43d | 1 | 1.14mi |
| 2627 Avenue K Galveston, TX | 2.0 | 1.0 | 700 | $1,200 | $1.71 | 43d | 1 | 1.14mi |
| 2221 35th St Unit UP Galveston, TX | 2.0 | 1.0 | 1080 | $1,300 | $1.20 | 18d | 1 | 1.17mi |
| 2221 35th St Galveston, TX | 2.0 | 1.0 | 1080 | $1,300 | $1.20 | 15d | 1 | 1.17mi |
| 4824 Avenue R Galveston, TX | 2.0 | 2.0 | 1250 | $1,300 | $1.04 | 43d | 1 | 1.17mi |
| 2223 35th St Galveston, TX | 2.0 | 1.0 | 860 | $1,500 | $1.74 | 43d | 1 | 1.17mi |
| 2609 Avenue L Apt 8 Galveston, TX | 2.0 | 1.0 | 758 | $995 | $1.31 | 24d | 1 | 1.19mi |
| 4818 Avenue R 1/2 Galveston, TX | 1.0–3.0 | 1.0–2.0 | 1264 | $1,462 | $1.16 | 1d | 2 | 1.22mi |
| 2814 Avenue O 1/2 Galveston, TX | 2.0 | 1.0 | 1105 | $1,400 | $1.27 | 43d | 1 | 1.23mi |
| 1208 26th St Unit 1546007P Galveston, TX | 3.0 | 2.0 | 796 | $2,599 | $3.27 | 15d | 1 | 1.23mi |
| 1212 26th St Unit 1545867P Galveston, TX | 3.0 | 2.0 | 742 | $2,645 | $3.56 | 12d | 1 | 1.23mi |
| 3010 Avenue Q Galveston, TX | 2.0 | 1.0 | 1045 | $1,400 | $1.34 | 43d | 1 | 1.25mi |
| 5523 Avenue O 1/2 Galveston, TX | 2.0 | 1.0 | 900 | $1,010 | $1.12 | 44d | 1 | 1.27mi |
| 2001 29th St Galveston, TX | 2.0 | 1.0 | 1109 | $1,400 | $1.26 | 43d | 1 | 1.29mi |
| 4420 Avenue T Galveston, TX | 3.0 | 2.0 | 1260 | $2,100 | $1.67 | 43d | 1 | 1.33mi |
| 1914 27th St Galveston, TX | 2.0 | 1.5 | 840 | $1,795 | $2.14 | 12d | 1 | 1.39mi |
| 1801 Rosenberg St Unit HOUSE Galveston, TX | 3.0 | 3.5 | 1288 | $2,700 | $2.10 | 43d | 1 | 1.44mi |
Listing history 25 events
-
2026-06-18days on market $99,000 Active 14 DOM
-
2026-06-17days on market $99,000 Active 13 DOM
-
2026-06-16days on market $99,000 Active 12 DOM
-
2026-06-15days on market $99,000 Active 11 DOM
-
2026-06-13days on market $99,000 Active 9 DOM
-
2026-06-09days on market $99,000 Active 5 DOM
-
2026-06-08days on market $99,000 Active 4 DOM
-
2026-06-07remarks 699-char remark
-
2026-06-07pricedays on market $99,000 Active 3 DOM
-
2026-06-03days on market $115,000 Active 94 DOM
-
2026-06-02days on market $115,000 Active 93 DOM
-
2026-06-01days on market $115,000 Active 92 DOM
-
2026-05-31days on market $115,000 Active 91 DOM
-
2026-04-09price $115,000 965-char remark
Show marketing remark (965 chars)
Opportunity on the Harborside! Unique corner-lot property includes home + adjacent lot at 606 42nd St. (addtl 1,209 sq. ft.), creating a rare chance to own extra land in a prime location. Whether you envision expanding, building, adding outdoor entertaining space, extra parking, or holding for future investment potential, the additional lot adds flexibility and value that’s hard to find on the island. Home features 2 bedrooms w/ closets, 1 hall bath, an open living/dining, and an expanded kitchen with washer/dryer connections. Electrical has been updated, and plumbing is believed to be updated. A third room w/closet + exterior access offers flexibility. Home is livable but needs a new roof and TLC, ideal for renovation, investment, Airbnb potential, or redevelopment. Blocks from Historic Strand District, Ball HS, community rec center and pool, and close to UTMB. Buyer to verify dimensions. Kitchen addition measurements may vary. Sold as-is.
-
2026-03-24price $140,000 965-char remark
Show marketing remark (965 chars)
Opportunity on the Harborside! Unique corner-lot property includes home + adjacent lot at 606 42nd St. (addtl 1,209 sq. ft.), creating a rare chance to own extra land in a prime location. Whether you envision expanding, building, adding outdoor entertaining space, extra parking, or holding for future investment potential, the additional lot adds flexibility and value that’s hard to find on the island. Home features 2 bedrooms w/ closets, 1 hall bath, an open living/dining, and an expanded kitchen with washer/dryer connections. Electrical has been updated, and plumbing is believed to be updated. A third room w/closet + exterior access offers flexibility. Home is livable but needs a new roof and TLC, ideal for renovation, investment, Airbnb potential, or redevelopment. Blocks from Historic Strand District, Ball HS, community rec center and pool, and close to UTMB. Buyer to verify dimensions. Kitchen addition measurements may vary. Sold as-is.
-
2026-03-01$165,000 Active 965-char remark
Show marketing remark (965 chars)
Opportunity on the Harborside! Unique corner-lot property includes home + adjacent lot at 606 42nd St. (addtl 1,209 sq. ft.), creating a rare chance to own extra land in a prime location. Whether you envision expanding, building, adding outdoor entertaining space, extra parking, or holding for future investment potential, the additional lot adds flexibility and value that’s hard to find on the island. Home features 2 bedrooms w/ closets, 1 hall bath, an open living/dining, and an expanded kitchen with washer/dryer connections. Electrical has been updated, and plumbing is believed to be updated. A third room w/closet + exterior access offers flexibility. Home is livable but needs a new roof and TLC, ideal for renovation, investment, Airbnb potential, or redevelopment. Blocks from Historic Strand District, Ball HS, community rec center and pool, and close to UTMB. Buyer to verify dimensions. Kitchen addition measurements may vary. Sold as-is.
-
2014-02-14soldstatus 192-char remark
Show marketing remark (192 chars)
Corner house at a very low price. Selling in its present condition. Please check your flood insurance. Survey available of the property. Extra room has a closet and could be used as a bedroom.
-
2014-02-14soldstatus
Show marketing remark (192 chars)
Corner house at a very low price. Selling in its present condition. Please check your flood insurance. Survey available of the property. Extra room has a closet and could be used as a bedroom.
-
2014-02-06historical 192-char remark
Show marketing remark (192 chars)
Corner house at a very low price. Selling in its present condition. Please check your flood insurance. Survey available of the property. Extra room has a closet and could be used as a bedroom.
-
2013-12-02$29,500 192-char remark
Show marketing remark (192 chars)
Corner house at a very low price. Selling in its present condition. Please check your flood insurance. Survey available of the property. Extra room has a closet and could be used as a bedroom.
-
2010-12-09historical
-
2010-08-05soldstatus
-
2009-12-14$35,000
-
2009-12-02soldstatus
-
2007-03-27soldstatus
ⓘ Source: listings_history table (triggers on properties + properties_extension) + one-shot
backfill from property_details.listing_events for pre-trigger history.
Tax reassessment forecast TX · Resets to sale price
- Current annual tax
- $1,239 · $103/mo
- Projected year-2 tax
- $1,812 · $151/mo
- Expected delta
- +$572/yr (+$48/mo · 46.2%)
ⓘ Screening estimate from a state-policy table — verify with the county assessor before closing.
Climate risk First Street
- Flood 10/10 Extreme FEMA zone AE · 99% chance over 30 yrs
- Wildfire 1/10 Low
- Heat 10/10 Extreme 7 d/yr ≥107°F today · 28 d/yr by 30 yrs out
- Wind 10/10 Extreme 99% chance of damaging wind over 30 yrs
- Air quality 2/10 Low 1 unhealthy d/yr today · 2 by 30 yrs out
Nearby sold comps map
Loading sold comps map…
Walkable amenities ~0.75 mi
Loading nearby amenities…
Taxation est. · year 1
- Rental income
- $16,810
- − Mortgage interest
- −$5,546
- − Property taxes
- −$1,239
- − Insurance
- −$5,614
- − Repairs & maintenance
- −$1,345
- − Management
- −$1,345
- − Depreciation
- −$2,880
- Taxable loss
- −$1,158
- Est. tax savings @ 24.0%
- +$278
- After-tax cash flow
- $475/yr
For passive investors: Depreciation is non-cash, so a rental often shows a tax loss while cash-flowing — sheltering income. Rental losses are passive: they offset passive income freely, and up to $25,000/yr can offset ordinary (W-2) income if you actively participate and your MAGI is under $100k (phasing out to $0 by $150k); unused losses carry forward. On sale, claimed depreciation is recaptured at up to 25%, and gains may owe capital-gains tax (a 1031 exchange can defer both). Figures are a year-1 estimate at your 24.0% rate — not tax advice; consult a CPA.
Schools (NCES district)
- District
- Galveston ISD
- NCES district ID
- 4820280
- Math proficiency
- 33% ▼ -14.00%
- Reading proficiency
- 39% ▼ -4.00%
- Median HH income
- $40,162
- Composite
- 30.22/100
- National rank
- #6299
- State rank
- #514 of 826 in TX
Livability — Galveston
- Score
- 76/100
- State rank
- #108
- US rank
- #3559
Category grades
Schools grade is shown separately in the Schools card above.
Census & demographics
- Census place
- Galveston, TX
- County
- Galveston County · 357,330 people
- City population
- 55,599
- Metro
- Houston-The Woodlands-Sugar Land, TX
- Population (ZIP)
- 23,489
- Household income
- $45,047
- Rent vs Own
- Severe rent burden
- 2193.0
Population outlook (Galveston County) Hauer SSP2
- Today (2025)
- 390,640 people
- By 2030
- 425,226 · +8.9%
- By 2040
- 493,765 · +26.4%
- By 2050
- 559,698 · +43.3%
- By 2075
- 719,260 · +84.1%
- By 2100
- 819,628 · +109.8%
Race, ethnicity, and origin ACS 2023
- Neighborhood character
- Diverse neighborhood (Simpson 0.66)
- Race & ethnicity
- White 46% Hispanic / Latino 30% Two or more races 19% Black 19% Asian 3%
- Hispanic origin (detail)
- Mexican 21% Puerto Rican 1%
- Common ancestry
- Lithuanian 2% Italian 2% Romanian 1%
- Foreign-born
- 11% · Canada, Jamaica
- Languages at home
- 75% English-only · Spanish 18% Other Asian/Pacific 2% Russian/Polish/Slavic 1%
Political lean MEDSL · Galveston
- 2024 margin
- Strong R (+27.4) · D 35.7% · R 63.1% · Other 1.2%
- 2008→2024 swing
- -7.9pp toward R · 2008: -19.5pp · 2024: -27.4pp
- All cycles
- 2024: R+27.4 2020: R+22.6 2016: R+22.6 2012: R+26.9 2008: R+19.5
Not yet ingested
- Civics
- —
Market trends
- HPI YoY
- ▼ -158.96%
- Current HPI
- 324.2159
- Rent YoY
- ▼ -1.12%
- Metro
- Houston-The Woodlands-Sugar Land, TX
- State GDP YoY
- ▲ 3.95%
- F500 in state
- 110
Industry mix (Fortune 500 HQ in TX)
| Industry | F500 HQs | Revenue |
|---|---|---|
| Energy | 16 | $1,198B |
|
||
| Technology | 5 | $198B |
|
||
| Engineering / Construction | 4 | $72B |
|
||
| Energy Services | 3 | $60B |
|
||
| Utilities | 3 | $41B |
|
||
| Healthcare | 2 | $330B |
|
||
Price history
+228.6% since first listed12 events — show timeline
- 2026-04-09 Price Changed $115,000 HARMLS
- 2026-03-24 Price Changed $140,000 HARMLS
- 2026-03-01 Listed $165,000 HARMLS
- 2014-02-14 Sold (Public Records) — Public Records
- 2014-02-14 Sold (MLS) — HARMLS
- 2014-02-06 Listing Removed — HARMLS
- 2013-12-02 Listed $29,500 HARMLS
- 2010-12-09 Listing Removed — HARMLS
- 2010-08-05 Sold (Public Records) — Public Records
- 2009-12-14 Listed $35,000 HARMLS
- 2009-12-02 Sold (Public Records) — Public Records
- 2007-03-27 Sold (Public Records) — Public Records
Property tax history
+9.2%/yrLatest (2025): $1,239 · +9.3% YoY. Source: county tax records.
Cash-flow waterfall
monthlySold comps — $/sqft
last 12 mo · ≤1 miLoading sold comps…