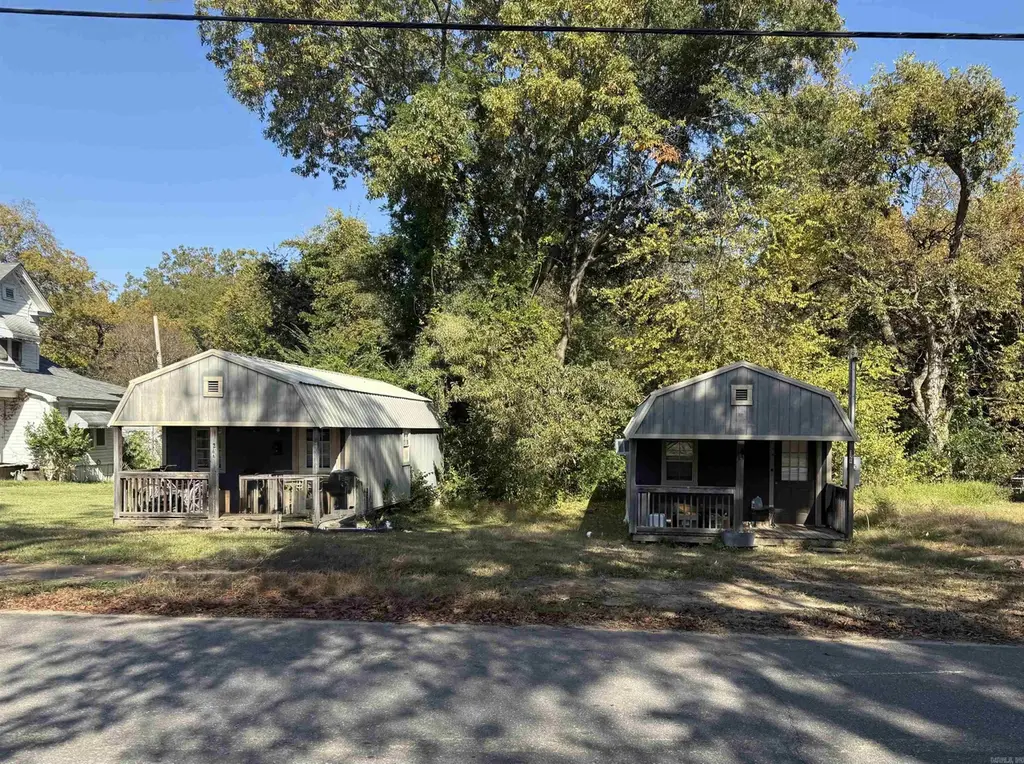
124 W College, A & B Ave · Monticello, AR
Flood risk 1/10 · Minimal
- FEMA flood zone
- X (unshaded)
- Chance of flooding over 30 yrs
- 0.0%
- Est. flood insurance / yr
- $507 – $1,088
Fire risk 4/10 · Minor
- Est. fire insurance / yr
- $1,499 – $2,785
Heat risk 6/10 · Moderate
- Hot days now (above 109°F)
- 7 days/yr
- Hot days in 30 yrs
- 20 days/yr
Wind risk 6/10 · Moderate
- Chance of severe wind over 30 yrs
- 27.0%
Air-quality risk 1/10 · Minimal
- Unhealthy air days now
- 0 days/yr
- Unhealthy air days in 30 yrs
- 0 days/yr
Risk factors via First Street. Map © Google.
Why this score? — see what drove the D+ grade
The composite is a weighted blend of 9 inputs, each scored 0–100. Each bar is that input's sub-score; the figure is the points it added to the 100-point composite (weight × sub-score).
- Cash flow +19.8/30.0
- ARV discount +7.5/15.0
- DSCR +6.3/10.0
- 1% rule +4.3/10.0
- Livability +3.5/5.0
- Rent growth +2.5/5.0
- Condition / age +2.5/5.0
- Schools +2.4/10.0
- Appreciation +0.0/10.0
$80,000
🖨 Deal sheet 📄 Offer letter ✓ Due diligence
Listing remarks MLS
Great investment opportunity in the heart of town! This property includes two separate 1BR/1BA tiny homes, each designed for low-maintenance living and steady rental income. Both units are currently tenant-occupied, providing immediate cash flow. Convenient in-town location and an easy, hands-off setup for any investor.
Key facts
- Immediate cash flow
- Tenant occupied
- Steady rental income
Tags
Neighborhood map
What this means for you Summary
Snapshot
- This is a 2-bed/1.0-bath single-family listed at $80k.
Deal economics
- At list price, monthly cash flow is $96 ($1k/yr) — positive.
- The deal already cash-flows at list — no discount required.
- To meet the 1% rule (rent ≥ 1% of price), the offer needs to be $74k (7.0% below list).
- Recommended offer: $70k (12.0% below list) — sets the bar for market timing.
- Cap rate 7.7% vs local median 2.9% in Monticello — top-decile yield for the area; either an underpriced asset or a hidden risk that comps aren't pricing in. Stress-test before assuming the spread holds.
Location & tenants
- Location reads 69/100 on livability (#72 in AR) — a middle-class / working-renter tenant base. Strengths: cost of living A+, health & safety A+, housing A; Watch: schools F, crime D-, amenities F.
- Monticello School District (town): math 30% / reading 29% proficiency, ranked #161 of 238 in AR (top 68%) — low school quality limits family demand, transient renter base, plan for 1-2y turnover.
- Market conditions: 114 active listings in the ZIP; 16 units permitted in Drew County in 2024 (0 in 5+ unit buildings).
Forward outlook
- Local home prices are declining (-3.0%/yr); year-one equity from $553 of loan paydown is wiped out by about $2k of value loss. Plan a longer hold.
- Drew County population projected to shrink 8% by 2050 — rents likely to lag national; underwrite the cash flow, not the appreciation.
Negotiation context
- It's been on market 217 days — a 12% lower offer ($70k) is reasonable based on typical stale-listing flexibility.
- 2 sale attempts since 14y ago; this cycle's ask has dropped $25k (24%) from the opening price — seller is motivated, your offer sets the floor, not the list.
- Current owner paid $6k; list at $80k implies a 1233% gain — meaningful room to come down on a strong offer.
Risks & watch-outs
- Climate carrying-cost: major wind risk, 27% chance of damaging wind over 30y; extreme-heat days projected 7→20/yr by 2055 (HVAC capex compounding) — expect insurance premiums to compound above CPI over the hold.
Questions for the listing agent
- It's been on market 217 days. Have you received any prior offers? Is the seller open to a 12% concession, seller financing, or rate buy-down credit?
- Why hasn't it sold? Are there any deal-killer items the seller is aware of (foundation, flood, title, zoning, code violations)?
- Is there a deadline driving the sale (1031 exchange, divorce, estate, relocation)? That informs how much negotiation room exists.
- Schools are F-rated, which usually means shorter tenancies and higher turnover. Who's the typical renter profile here, and what's been the actual vacancy rate?
- Crime grade is D in this area — have there been break-ins, vandalism, or insurance claims at this property in the last 3 years? What carrier currently insures it and at what premium?
- The area grade is low — what's the realistic commute time and amenity access for the typical tenant pool here? Any planned neighborhood developments (good or bad) we should know about?
- What's the average days-on-market for RENTAL listings here right now (not sales)? A rising rental-DOM trend means longer vacancies and softer asking-rent achievability than the comps imply.
- What's the recent tenant-quality profile in this submarket — average credit score on applications, eviction rate, late-payment / NSF rate, and stable-employment percentage? A property-management company in the area should have these aggregated.
- How much new for-sale + rental construction is in the pipeline within 1–3 miles? Heavy new supply typically softens prices + rents 12–24 months out; constrained supply supports both.
Investment metrics
- 1% rule
- 0.93% ✗
- Cap rate
- 7.73%
- Cash-on-cash
- 5.13%
- DSCR
- 1.23
- GRM
- 9.0
CMA / ARV
No comps found within radius.
Projected returns pro-forma
-3.0% appreciation · 3.0% rent growth · sell at horizon
- IRR
- -8.4%
- Equity multiple
- 0.69×
- Total profit
- $-6,893
- Equity at exit
- $11,928
- IRR
- 1.1%
- Equity multiple
- 1.08×
- Total profit
- $1,741
- Equity at exit
- $6,917
Cash invested: $22,400 (down + closing). Projections, not guarantees.
Landlord ↔ Tenant lean methodology
- Overall (STATE)
- 92 Strongly Landlord-Friendly
- State Arkansas
- 92 Strongly Landlord-Friendly · R+14
- County
- — inherits STATE
- City
- — inherits STATE
ZIP-level market 71655
- Home prices YoY
- -10.8%
- Active inventory
- 114
- Price-to-rent
- 9.0×
Monthly cashflow live
- Estimated rent
- $744 medium interval (Pro) →
- Mortgage (P&I)
- −$420
- Tax from tax record
- −$39 /mo · $472/yr
- Insurance
- −$33
- HOA
- −$0
- Vacancy / Maint / Mgmt
- −$156
- Net cashflow
- $96
Break-even live
UW: 25.0% down · 7.5% · 30yr · 1.5% tax · 5.0% vac · 8.0% maint · 8.0% mgmt
Financing live
Cash to close
- Down payment
- $20,000
- Closing costs
- $2,400
- Reserves months
- —
- Total cash needed
- —
Loan-product check · same deal, 3 products live
Conventional
25% down · 7.5% · 30yr
- Down + closing
- —
- Monthly P&I
- —
- Monthly cashflow
- —
- DSCR
- —
- Eligible?
- —
Personal DTI + credit; lowest rate.
DSCR
20% down · 8.5% · 30yr
- Down + closing
- —
- Monthly P&I
- —
- Monthly cashflow
- —
- DSCR
- —
- Eligible?
- —
No personal income docs; deal must DSCR.
Hard money
10% down · 12.0% · 12mo
- Down + closing
- —
- Monthly P&I
- —
- Monthly cashflow
- —
- DSCR
- —
- Eligible?
- —
Short-term bridge; refi at stabilization.
Listing history 22 events
-
2026-06-19days on market $80,000 Active 217 DOM
-
2026-06-18days on market $80,000 Active 216 DOM
-
2026-06-17days on market $80,000 Active 215 DOM
-
2026-06-16days on market $80,000 Active 214 DOM
-
2026-06-15days on market $80,000 Active 213 DOM
-
2026-06-14days on market $80,000 Active 211 DOM
-
2026-06-12days on market $80,000 Active 210 DOM
-
2026-06-09days on market $80,000 Active 207 DOM
-
2026-06-08days on market $80,000 Active 206 DOM
-
2026-06-07days on market $80,000 Active 205 DOM
-
2026-06-07days on market $80,000 Active 204 DOM
-
2026-06-04days on market $80,000 Active 201 DOM
-
2026-06-02days on market $80,000 Active 200 DOM
-
2026-06-01days on market $80,000 Active 199 DOM
-
2026-05-31days on market $80,000 Active 198 DOM
-
2026-05-31days on market $80,000 Active 197 DOM
-
2026-04-29price $80,000 321-char remark
Show marketing remark (321 chars)
Great investment opportunity in the heart of town! This property includes two separate 1BR/1BA tiny homes, each designed for low-maintenance living and steady rental income. Both units are currently tenant-occupied, providing immediate cash flow. Convenient in-town location and an easy, hands-off setup for any investor.
-
2025-11-14$105,000 New Listing 321-char remark
Show marketing remark (321 chars)
Great investment opportunity in the heart of town! This property includes two separate 1BR/1BA tiny homes, each designed for low-maintenance living and steady rental income. Both units are currently tenant-occupied, providing immediate cash flow. Convenient in-town location and an easy, hands-off setup for any investor.
-
2018-11-01soldstatus $6,000
-
2014-08-01historical
-
2012-07-18$15,000
-
1989-08-01soldstatus $33,000
ⓘ Source: listings_history table (triggers on properties + properties_extension) + one-shot
backfill from property_details.listing_events for pre-trigger history.
Tax reassessment forecast AR · Resets to sale price
- Current annual tax
- $472 · $39/mo
- Projected year-2 tax
- $512 · $43/mo
- Expected delta
- +$40/yr (+$3/mo · 8.5%)
ⓘ Screening estimate from a state-policy table — verify with the county assessor before closing.
Climate risk First Street
- Flood 1/10 Low FEMA zone X (unshaded) · 0% chance over 30 yrs
- Wildfire 4/10 Moderate
- Heat 6/10 Major 7 d/yr ≥109°F today · 20 d/yr by 30 yrs out
- Wind 6/10 Major 27% chance of damaging wind over 30 yrs
- Air quality 1/10 Low 0 unhealthy d/yr today · 0 by 30 yrs out
Nearby sold comps map
Loading sold comps map…
Walkable amenities ~0.75 mi
Loading nearby amenities…
Taxation est. · year 1
- Rental income
- $8,930
- − Mortgage interest
- −$4,481
- − Property taxes
- −$472
- − Insurance
- −$400
- − Repairs & maintenance
- −$714
- − Management
- −$714
- − Depreciation
- −$2,327
- Taxable loss
- −$179
- Est. tax savings @ 24.0%
- +$43
- After-tax cash flow
- $1,192/yr
For passive investors: Depreciation is non-cash, so a rental often shows a tax loss while cash-flowing — sheltering income. Rental losses are passive: they offset passive income freely, and up to $25,000/yr can offset ordinary (W-2) income if you actively participate and your MAGI is under $100k (phasing out to $0 by $150k); unused losses carry forward. On sale, claimed depreciation is recaptured at up to 25%, and gains may owe capital-gains tax (a 1031 exchange can defer both). Figures are a year-1 estimate at your 24.0% rate — not tax advice; consult a CPA.
Schools (NCES district)
- District
- Monticello School District
- NCES district ID
- 0509840
- Math proficiency
- 30% ▼ -20.00%
- Reading proficiency
- 29% ▼ -12.00%
- Median HH income
- $33,146
- Composite
- 24.19/100
- National rank
- #7732
- State rank
- #161 of 238 in AR
Livability — Monticello
- Score
- 69/100
- State rank
- #72
- US rank
- #8686
Category grades
Schools grade is shown separately in the Schools card above.
Census & demographics
- Census place
- Monticello, AR
- Population (ZIP)
- 13,892
Population outlook (Drew County) Hauer SSP2
- Today (2025)
- 18,483 people
- By 2030
- 18,278 · -1.1%
- By 2040
- 17,712 · -4.2%
- By 2050
- 17,015 · -7.9%
- By 2075
- 15,815 · -14.4%
- By 2100
- 14,335 · -22.4%
Race, ethnicity, and origin ACS 2023
- Neighborhood character
- Majority White (63%)
- Race & ethnicity
- White 63% Black 28% Two or more races 6% Hispanic / Latino 5%
- Common ancestry
- Lithuanian 2% Slovak 1% Serbian 1%
- Foreign-born
- 3% · Canada, China
- Languages at home
- 94% English-only · Spanish 4%
Political lean MEDSL · Drew
- 2024 margin
- Solid R (+33.8) · D 32.2% · R 66.0% · Other 1.8%
- 2008→2024 swing
- -14.7pp toward R · 2008: -19.1pp · 2024: -33.8pp
- All cycles
- 2024: R+33.8 2020: R+27.8 2016: R+24.5 2012: R+18.9 2008: R+19.1
Not yet ingested
- Civics
- —
Market trends
- HPI YoY
- ▼ -26.27%
- Current HPI
- 218.1414
- Rent YoY
- —
- Metro
- —
- State GDP YoY
- ▲ 3.80%
- F500 in state
- 10
Industry mix (Fortune 500 HQ in AR)
| Industry | F500 HQs | Revenue |
|---|---|---|
| Retail | 1 | $681B |
|
||
| Food / Agriculture | 1 | $53B |
|
||
| Retail / Energy | 1 | $22B |
|
||
| Transportation / Logistics | 1 | $12B |
|
||
| Energy | 1 | $4B |
|
||
Price history
+142.4% since first listed6 events — show timeline
- 2026-04-29 Price Changed $80,000 CARMLS
- 2025-11-14 Listed $105,000 CARMLS
- 2018-11-01 Sold (Public Records) $6,000 Public Records
- 2014-08-01 Listing Removed — CARMLS
- 2012-07-18 Listed $15,000 CARMLS
- 1989-08-01 Sold (Public Records) $33,000 Public Records
Property tax history
+27.2%/yrLatest (2022): $472 · +20.0% YoY. Source: county tax records.
Cash-flow waterfall
monthlySold comps — $/sqft
last 12 mo · ≤1 miLoading sold comps…