 🏷️ Likely Rental
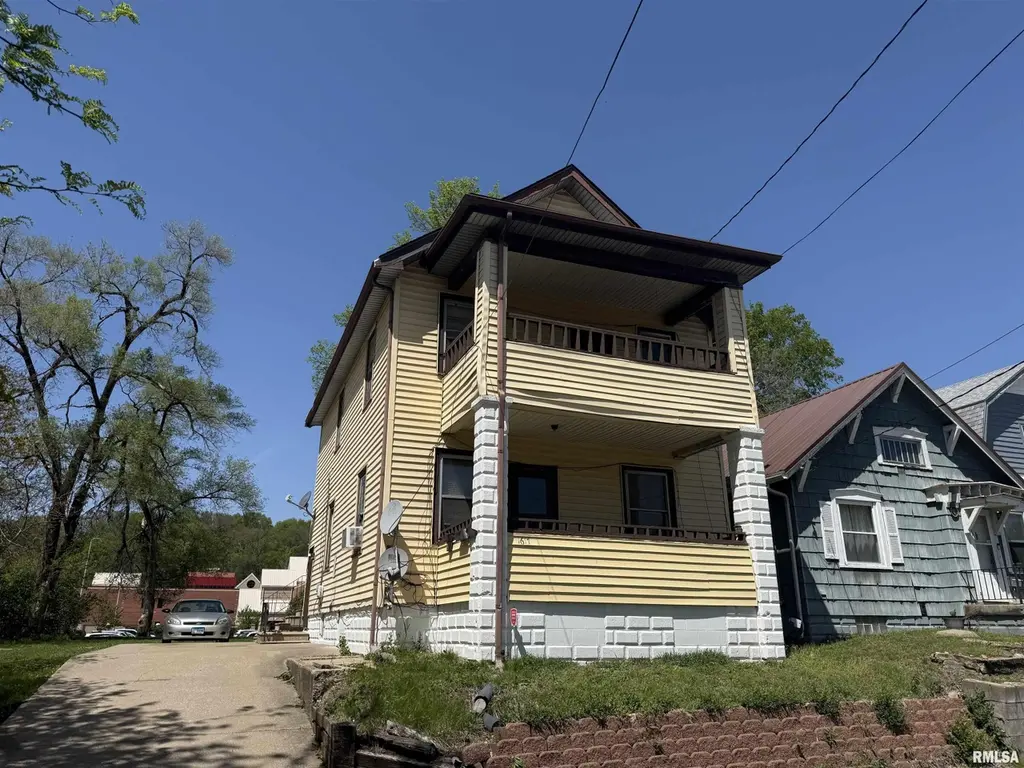
1617 NE Monroe St · Peoria, IL
Flood risk 1/10 · Minimal
- FEMA flood zone
- X
- Chance of flooding over 30 yrs
- 0.0%
- Est. flood insurance / yr
- $473 – $860
Fire risk 1/10 · Minimal
- Est. fire insurance / yr
- $804 – $1,492
Heat risk 3/10 · Minor
- Hot days now (above 105°F)
- 7 days/yr
- Hot days in 30 yrs
- 18 days/yr
Wind risk 2/10 · Minimal
- Chance of severe wind over 30 yrs
- 1.0%
Air-quality risk 3/10 · Minor
- Unhealthy air days now
- 1 days/yr
- Unhealthy air days in 30 yrs
- 3 days/yr
Risk factors via First Street. Map © Google.
Why this score? — see what drove the B+ grade
The composite is a weighted blend of 9 inputs, each scored 0–100. Each bar is that input's sub-score; the figure is the points it added to the 100-point composite (weight × sub-score).
- Cash flow +30.0/30.0
- ARV discount +15.0/15.0
- 1% rule +10.0/10.0
- DSCR +10.0/10.0
- Livability +3.7/5.0
- Rent growth +3.4/5.0
- Condition / age +2.5/5.0
- Schools +1.1/10.0
- Appreciation +0.0/10.0
$84,000
🖨 Deal sheet 📄 Offer letter ✓ Due diligence
Multi-family units
County records classify this as Multi-Family (2-4 Unit). Listing-text estimate: 2 units. confirmed
Listing remarks MLS
GREAT OPPORTUNITY FOR A DUPLEX IN THE HEART OF PEORIA. This up/down duplex has 2 bedrooms and 1 full bath in each unit. Paved parking spot for 2-3 vehicles and on street parking. Basement is shared between units and has laundry hook ups. Each unit also has 2 porches and a shared patio area. Main level unit is occupied with month to month tenant (who would like to stay) and upper level unit is vacant. Vacant unit is freshly painted and has newer flooring throughout (2026). This unit also has access to unfinished attic space. Seller is selling AS IS. Roof March 2026 and water heaters a few years old. Only pictures of vacant unit are available due to tenant privacy. Easy to show with 24 hour notice. Walking distance to Lincoln School. Come take a tour of this fine property.
Key facts
- Up down duplex
- Shared patio area
- Laundry hook ups
Tags
Neighborhood map
What this means for you Summary
Snapshot
- This is a 2 × 2-bed/1.0-bath units multifamily listed at $84k.
Deal economics
- At list price, monthly cash flow is $958 ($11k/yr) — positive. Per door: $479/mo.
- The deal already cash-flows at list — no discount required.
- Meets the 1% rule at list price ($2k rent vs $84k).
- Recommended offer: $81k (3.0% below list) — sets the bar for market timing.
- Cap rate 20.0% vs local median 5.6% in Peoria — top-decile yield for the area; either an underpriced asset or a hidden risk that comps aren't pricing in. Stress-test before assuming the spread holds.
Location & tenants
- Location reads 73/100 on livability (#270 in IL) — a middle-class / working-renter tenant base. Strengths: commute A+, cost of living A+, housing A+; Watch: employment D+, schools F, crime F.
- Peoria SD 150 (urban): math 11% / reading 14% proficiency, ranked #554 of 620 in IL (top 89%) — low school quality limits family demand, transient renter base, plan for 1-2y turnover; 70% free/reduced lunch — lower-income household profile, screen leases tightly.
- Market conditions: Rents rising (+3.5%/yr); 104 active listings in the ZIP; 7 comparable units currently listed for rent nearby; rentals leasing fast (median 14d on market — plan ~1-2 weeks tenant-placement turnaround); lower-income renter base — watch delinquency; 73 units permitted in Peoria County in 2024 (0 in 5+ unit buildings).
- At $1,910/mo this rent would consume 55% of the median local household income ($42k/yr) (locally 849% of renters already pay >50% of income on rent) — very limited rent-growth headroom before tenants either downsize or default.
Forward outlook
- Local home prices are declining (-3.0%/yr); year-one equity from $581 of loan paydown is wiped out by about $3k of value loss. Plan a longer hold.
- Peoria County population projected at -11% by 2050 — secular population decline; favor cash flow + early exit over multi-decade hold.
- At projected returns (-3.0% appreciation + 3.5% rent growth), your $24k cash investment doubles in ~3 years — after that, you're playing with house money.
Negotiation context
- It's been on market 59 days — a 3% lower offer ($81k) is reasonable based on typical stale-listing flexibility.
- Current owner paid $48k; list at $84k implies a 75% gain — meaningful room to come down on a strong offer.
Risks & watch-outs
- Watch-outs: built in 1900 — expect roof / HVAC / electrical / plumbing capex.
Questions for the listing agent
- It's been on market 59 days. Have you received any prior offers? Is the seller open to a 3% concession, seller financing, or rate buy-down credit?
- Can we see the unit-by-unit rent roll, current vacancy, and any below-market leases? What's the average tenancy length?
- What capital expenditures (roof, boiler, parking lot, exteriors) have been made in the last 5 years, and what's planned in the next 2?
- Built in 1900 — when were the roof, HVAC, electrical panel, plumbing, and water heater last replaced?
- Is there a deadline driving the sale (1031 exchange, divorce, estate, relocation)? That informs how much negotiation room exists.
- Schools are F-rated, which usually means shorter tenancies and higher turnover. Who's the typical renter profile here, and what's been the actual vacancy rate?
- Crime grade is F in this area — have there been break-ins, vandalism, or insurance claims at this property in the last 3 years? What carrier currently insures it and at what premium?
- What's the average days-on-market for RENTAL listings here right now (not sales)? A rising rental-DOM trend means longer vacancies and softer asking-rent achievability than the comps imply.
- What's the recent tenant-quality profile in this submarket — average credit score on applications, eviction rate, late-payment / NSF rate, and stable-employment percentage? A property-management company in the area should have these aggregated.
- How much new apartment / multifamily construction is in the pipeline within 1–3 miles? Heavy new supply (>2% of stock underway) typically softens rents 12–24 months out; light construction supports rent growth.
Investment metrics
- 1% rule
- 2.27% ✓
- Cap rate
- 19.98%
- Cash-on-cash
- 48.87%
- DSCR
- 3.17
- GRM
- 3.7
CMA / ARV
- ARV (median comp)
- $116,626
- List price
- $84,000
- Delta
- -27.98%
- Verdict
- UNDERPRICED
- Comps
- 4 within 2.0 mi
Show comp detail 1 sale within ~0.75 mi
| Address | Dist | Beds/Ba | Sqft | Sold | Price | $/sf | Match |
|---|---|---|---|---|---|---|---|
| 1009 E Kansas St | 0.48mi | 3/2.0 (-1) | 1,500 (+0%) | 12mo | $125,000 | $83 | 62 |
Match score weights: distance 35% · size 25% · config 20% · recency 20%. Top-matched comps best support the ARV.
Projected returns pro-forma
-3.0% appreciation · 3.49% rent growth · sell at horizon
- IRR
- 47.0%
- Equity multiple
- 3.06×
- Total profit
- $48,357
- Equity at exit
- $12,525
- IRR
- 52.9%
- Equity multiple
- 6.30×
- Total profit
- $124,636
- Equity at exit
- $7,263
Cash invested: $23,520 (down + closing). Projections, not guarantees.
Landlord ↔ Tenant lean methodology
- Overall (STATE)
- 43 Moderately Tenant-Leaning
- State Illinois
- 43 Moderately Tenant-Leaning · D+7
- County
- — inherits STATE
- City
- — inherits STATE
ZIP-level market 61603
- Home prices YoY
- -31.8%
- Rents YoY
- 3.5%
- Active inventory
- 104
- Price-to-rent
- 7.3×
Monthly cashflow live
- Estimated rent
- $1,910 medium interval (Pro) →
- Mortgage (P&I)
- −$441
- Tax from tax record
- −$75 /mo · $905/yr
- Insurance
- −$35
- HOA
- −$0
- Vacancy / Maint / Mgmt
- −$401
- Net cashflow
- $958
Break-even live
2-unit breakdown (identical units grouped — click to expand)
| Units | Beds | Baths | Est. rent |
|---|---|---|---|
| 2× units | 2 | 1 | $1,910 |
| #1 | 2 | 1 | $955 |
| #2 | 2 | 1 | $955 |
| Total (2 units) | $1,910 | ||
UW: 25.0% down · 7.5% · 30yr · 1.5% tax · 5.0% vac · 8.0% maint · 8.0% mgmt
Financing live
Cash to close
- Down payment
- $21,000
- Closing costs
- $2,520
- Reserves months
- —
- Total cash needed
- —
Loan-product check · same deal, 3 products live
Conventional
25% down · 7.5% · 30yr
- Down + closing
- —
- Monthly P&I
- —
- Monthly cashflow
- —
- DSCR
- —
- Eligible?
- —
Personal DTI + credit; lowest rate.
DSCR
20% down · 8.5% · 30yr
- Down + closing
- —
- Monthly P&I
- —
- Monthly cashflow
- —
- DSCR
- —
- Eligible?
- —
No personal income docs; deal must DSCR.
Hard money
10% down · 12.0% · 12mo
- Down + closing
- —
- Monthly P&I
- —
- Monthly cashflow
- —
- DSCR
- —
- Eligible?
- —
Short-term bridge; refi at stabilization.
Rent comps 7 comps
| Address | Beds | Baths | Sqft | Rent | $/sqft | DOM | Units | Dist |
|---|---|---|---|---|---|---|---|---|
| 2121 N Prospect Rd Peoria, IL | 3.0 | 1.0 | 946 | $802 | $0.85 | 13d | 1 | 0.47mi |
| 2302 NE Monroe St Peoria, IL | 3.0 | 1.0 | 1100 | $875 | $0.80 | 13d | 1 | 0.52mi |
| 901 NE Glen Oak Ave Unit 2 Peoria, IL | 3.0 | 1.0 | 1120 | $1,200 | $1.07 | 21d | 1 | 0.70mi |
| 526 Fairholm Ave Peoria, IL | 3.0 | 2.0 | 1174 | $925 | $0.79 | 43d | 1 | 0.91mi |
| 1806 N Peoria Ave Peoria, IL | 4.0 | 1.5 | 1668 | $894 | $0.54 | 13d | 1 | 0.92mi |
| 308 E Archer Ave Peoria, IL | 3.0 | 1.0 | 1444 | $950 | $0.66 | 13d | 1 | 1.07mi |
| 501 W Columbia Ter Unit 3 Peoria, IL | 3.0 | 1.0 | 1500 | $1,400 | $0.93 | 43d | 1 | 1.42mi |
Listing history 19 events
-
2026-06-19days on market $84,000 Active 59 DOM
-
2026-06-18days on market $84,000 Active 58 DOM
-
2026-06-17days on market $84,000 Active 57 DOM
-
2026-06-16days on market $84,000 Active 56 DOM
-
2026-06-15days on market $84,000 Active 55 DOM
-
2026-06-14days on market $84,000 Active 53 DOM
-
2026-06-13pricedays on market $84,000 Active 52 DOM
-
2026-06-10days on market $89,000 Active 50 DOM
-
2026-06-09days on market $89,000 Active 49 DOM
-
2026-06-08days on market $89,000 Active 48 DOM
-
2026-06-07days on market $89,000 Active 47 DOM
-
2026-06-03days on market $89,000 Active 43 DOM
-
2026-06-02days on market $89,000 Active 42 DOM
-
2026-06-01days on market $89,000 Active 41 DOM
-
2026-05-31days on market $89,000 Active 40 DOM
-
2026-05-30days on market $89,000 Active 39 DOM
-
2026-05-06price $89,000 781-char remark
Show marketing remark (781 chars)
GREAT OPPORTUNITY FOR A DUPLEX IN THE HEART OF PEORIA. This up/down duplex has 2 bedrooms and 1 full bath in each unit. Paved parking spot for 2-3 vehicles and on street parking. Basement is shared between units and has laundry hook ups. Each unit also has 2 porches and a shared patio area. Main level unit is occupied with month to month tenant (who would like to stay) and upper level unit is vacant. Vacant unit is freshly painted and has newer flooring throughout (2026). This unit also has access to unfinished attic space. Seller is selling AS IS. Roof March 2026 and water heaters a few years old. Only pictures of vacant unit are available due to tenant privacy. Easy to show with 24 hour notice. Walking distance to Lincoln School. Come take a tour of this fine property.
-
2026-04-20$99,000 Active 781-char remark
Show marketing remark (781 chars)
GREAT OPPORTUNITY FOR A DUPLEX IN THE HEART OF PEORIA. This up/down duplex has 2 bedrooms and 1 full bath in each unit. Paved parking spot for 2-3 vehicles and on street parking. Basement is shared between units and has laundry hook ups. Each unit also has 2 porches and a shared patio area. Main level unit is occupied with month to month tenant (who would like to stay) and upper level unit is vacant. Vacant unit is freshly painted and has newer flooring throughout (2026). This unit also has access to unfinished attic space. Seller is selling AS IS. Roof March 2026 and water heaters a few years old. Only pictures of vacant unit are available due to tenant privacy. Easy to show with 24 hour notice. Walking distance to Lincoln School. Come take a tour of this fine property.
-
2005-08-23soldstatus $48,000
ⓘ Source: listings_history table (triggers on properties + properties_extension) + one-shot
backfill from property_details.listing_events for pre-trigger history.
Tax reassessment forecast IL · Partial reset (capped growth)
- Current annual tax
- $905 · $75/mo
- Projected year-2 tax
- $1,406 · $117/mo
- Expected delta
- +$501/yr (+$42/mo · 55.3%)
ⓘ Screening estimate from a state-policy table — verify with the county assessor before closing.
Climate risk First Street
- Flood 1/10 Low FEMA zone X · 0% chance over 30 yrs
- Wildfire 1/10 Low
- Heat 3/10 Moderate 7 d/yr ≥105°F today · 18 d/yr by 30 yrs out
- Wind 2/10 Low 100% chance of damaging wind over 30 yrs
- Air quality 3/10 Moderate 1 unhealthy d/yr today · 3 by 30 yrs out
Nearby sold comps map
Loading sold comps map…
Walkable amenities ~0.75 mi
Loading nearby amenities…
Taxation est. · year 1
- Rental income
- $22,920
- − Mortgage interest
- −$4,705
- − Property taxes
- −$905
- − Insurance
- −$420
- − Repairs & maintenance
- −$1,834
- − Management
- −$1,834
- − Depreciation
- −$2,444
- Taxable income
- $10,778
- Est. tax owed @ 24.0%
- −$2,587
- After-tax cash flow
- $8,908/yr
For passive investors: Depreciation is non-cash, so a rental often shows a tax loss while cash-flowing — sheltering income. Rental losses are passive: they offset passive income freely, and up to $25,000/yr can offset ordinary (W-2) income if you actively participate and your MAGI is under $100k (phasing out to $0 by $150k); unused losses carry forward. On sale, claimed depreciation is recaptured at up to 25%, and gains may owe capital-gains tax (a 1031 exchange can defer both). Figures are a year-1 estimate at your 24.0% rate — not tax advice; consult a CPA.
Schools (NCES district)
- District
- Peoria SD 150
- NCES district ID
- 1731230
- Math proficiency
- 11% ▼ -5.00%
- Reading proficiency
- 14% ▼ -4.00%
- Median HH income
- $41,951
- Composite
- 10.92/100
- National rank
- #9751
- State rank
- #554 of 620 in IL
Livability — Peoria
- Score
- 73/100
- State rank
- #270
- US rank
- #5096
Category grades
Schools grade is shown separately in the Schools card above.
Census & demographics
- Census place
- Peoria, IL
- County
- Peoria County · 120,495 people
- City population
- 114,670
- Metro
- Peoria, IL
- Population (ZIP)
- 15,356
- Household income
- $41,618
- Rent vs Own
- Severe rent burden
- 849.0
Population outlook (Peoria County) Hauer SSP2
- Today (2025)
- 183,007 people
- By 2030
- 179,643 · -1.8%
- By 2040
- 171,782 · -6.1%
- By 2050
- 163,508 · -10.7%
- By 2075
- 140,178 · -23.4%
- By 2100
- 114,493 · -37.4%
Race, ethnicity, and origin ACS 2023
- Neighborhood character
- Diverse neighborhood (Simpson 0.68)
- Race & ethnicity
- Black 43% White 36% Two or more races 12% Hispanic / Latino 10% Asian 1%
- Hispanic origin (detail)
- Mexican 7%
- Common ancestry
- Italian 2% Slovak 1% Lithuanian 1%
- Foreign-born
- 7% · Canada
- Languages at home
- 91% English-only · Spanish 6% Tagalog/Filipino 1%
Political lean MEDSL · Peoria
- 2024 margin
- Toss-up / Even · D 51.5% · R 46.9% · Other 1.6%
- 2008→2024 swing
- -9.2pp toward R · 2008: 13.9pp · 2024: 4.7pp
- All cycles
- 2024: D+4.7 2020: D+6.3 2016: D+2.8 2012: D+4.4 2008: D+13.9
Not yet ingested
- Civics
- —
Market trends
- HPI YoY
- ▼ -65.98%
- Current HPI
- 141.5343
- Rent YoY
- ▲ 3.49%
- Metro
- Peoria, IL
- State GDP YoY
- ▲ 1.59%
- F500 in state
- 60
Industry mix (Fortune 500 HQ in IL)
| Industry | F500 HQs | Revenue |
|---|---|---|
| Insurance | 4 | $201B |
|
||
| Consumer Goods | 4 | $87B |
|
||
| Industrial Machinery | 3 | $64B |
|
||
| Healthcare | 2 | $55B |
|
||
| Retail / Pharmacy | 1 | $148B |
|
||
| Agriculture / Food | 1 | $86B |
|
||
Price history
+85.4% since first listed3 events — show timeline
- 2026-05-06 Price Changed $89,000 RMLSA as Distributed by MLS Grid
- 2026-04-20 Listed $99,000 RMLSA as Distributed by MLS Grid
- 2005-08-23 Sold (Public Records) $48,000 Public Records
Property tax history
+0.3%/yrLatest (2024): $905 · +4.8% YoY. Source: county tax records.
Cash-flow waterfall
monthlySold comps — $/sqft
last 12 mo · ≤1 miLoading sold comps…