 20-Plex
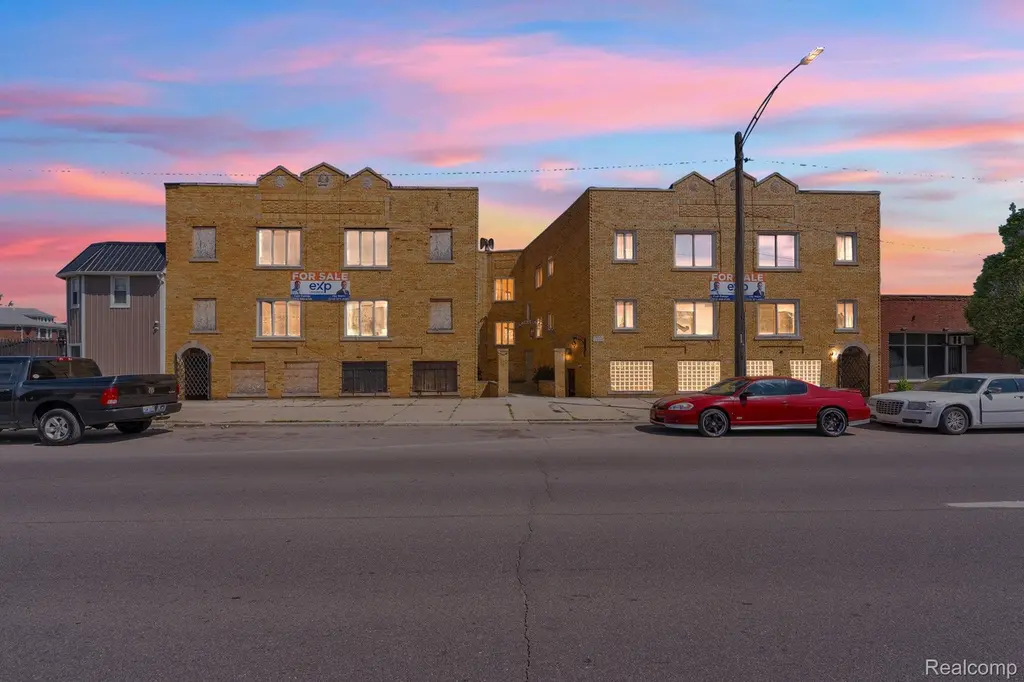
15523 Mack Ave · Detroit, MI
Flood risk 1/10 · Minimal
- FEMA flood zone
- X (unshaded)
- Chance of flooding over 30 yrs
- 0.0%
- Est. flood insurance / yr
- $507 – $1,088
Fire risk 1/10 · Minimal
- Est. fire insurance / yr
- $784 – $1,456
Heat risk 3/10 · Minor
- Hot days now (above 96°F)
- 7 days/yr
- Hot days in 30 yrs
- 15 days/yr
Wind risk 2/10 · Minimal
- Chance of severe wind over 30 yrs
- —
Air-quality risk 3/10 · Minor
- Unhealthy air days now
- 3 days/yr
- Unhealthy air days in 30 yrs
- 4 days/yr
Risk factors via First Street. Map © Google.
Why this score? — see what drove the B- grade
The composite is a weighted blend of 9 inputs, each scored 0–100. Each bar is that input's sub-score; the figure is the points it added to the 100-point composite (weight × sub-score).
- Cash flow +30.0/30.0
- 1% rule +10.0/10.0
- DSCR +10.0/10.0
- ARV discount +7.5/15.0
- Livability +3.7/5.0
- Rent growth +2.7/5.0
- Condition / age +2.2/5.0
- Schools +1.3/10.0
- Appreciation +0.0/10.0
$1,000,000
🖨 Deal sheet (PDF) 📄 Offer letter ✓ Due diligence
Multi-family units
County records classify this as Multi-Family (5+ Unit). Listing-text estimate: 20 units. confirmed
5+ unit building — per-unit beds/baths from public records are typically unavailable; the breakdown below (if shown) is an estimate from the listing text.
Listing remarks
Directly across from Grosse Pointe, 15523 Mack Avenue presents a rare opportunity to acquire a 20-unit mixed-use asset in one of Detroit's most sought-after border markets. The property consists of 18 residential units and 2 commercial spaces positioned along the highly visible Mack Avenue corridor, offering investors immediate scale and significant value-add potential. Located just minutes from Downtown Grosse Pointe, Corewell Health Beaumont Grosse Pointe Hospital, and Downtown Detroit, the property sits in a proven corridor supported by strong residential demand, established commercial activity, and continued public and private investment. Investors have the opportunity to increase value
Key facts
- 18 residential units
- 2 commercial spaces
- Renovation potential
Tags
Property features AI
Finance
- Other: Zoned for commercial, multi-family, multiple, and residential uses; Lot dimensions approximately 100.14 x 72.64 on a 0.17-acre lot; Property located on Mack Ave between Wayburn St and Nottingham Rd
Exterior
- Utilities: Public water; Public sewer
- Home design: Residential income property (multi-family); Two levels
- Construction: Brick construction; Brick/mortar foundation; Built-up above grade finished area of 9,866 square feet
- Exterior features: Paved road access; Pets allowed
Interior
- Bedrooms: Multiple 1-bedroom and 2-bedroom units
- Bathrooms: Multiple full bathrooms (total full bathrooms listed as 20)
- Heating & cooling: Natural gas heating; Radiant heating; Steam heating; No central cooling
- Interior features: Full unfinished walk-up basement
Neighborhood map
What this means for you Summary
Snapshot
- This is a 20 × 16-bed/20.0-bath units multifamily listed at $1.00M. Condition is rated fair.
Deal economics
- At list price, monthly cash flow is $19k ($231k/yr) — positive. Per door: $965/mo.
- The deal already cash-flows at list — no discount required.
- Meets the 1% rule at list price ($33k rent vs $1.00M).
- Recommended offer: $985k (1.5% below list) — sets the bar for market timing.
- Cap rate 29.4% vs local median 10.1% in Detroit — top-decile yield for the area; either an underpriced asset or a hidden risk that comps aren't pricing in. Stress-test before assuming the spread holds.
Location & tenants
- Location reads 73/100 on livability (#218 in MI) — a middle-class / working-renter tenant base. Strengths: amenities A+, commute A+, cost of living A+; Watch: schools F, crime F, employment F.
- Detroit Public Schools Community District (urban): math 10% / reading 24% proficiency, ranked #499 of 540 in MI (top 92%) — low school quality limits family demand, transient renter base, plan for 1-2y turnover; 90% free/reduced lunch — lower-income household profile, screen leases tightly.
- Market conditions: Rents flat; 492 active listings in the ZIP; lower-income renter base — watch delinquency; 2,639 units permitted in Wayne County in 2024 (1,216 in 5+ unit buildings).
- At $33,167/mo this rent would consume 887% of the median local household income ($45k/yr) (locally 2515% of renters already pay >50% of income on rent) — very limited rent-growth headroom before tenants either downsize or default.
Forward outlook
- Local home prices are declining (-3.0%/yr); year-one equity from $7k of loan paydown is wiped out by about $30k of value loss. Plan a longer hold.
- Wayne County population projected at -17% by 2050 — secular population decline; favor cash flow + early exit over multi-decade hold.
- At projected returns (-3.0% appreciation + 0.7% rent growth), your $280k cash investment doubles in ~2 years — after that, you're playing with house money.
Negotiation context
- It's been on market 17 days — a 2% lower offer ($985k) is reasonable based on typical stale-listing flexibility.
- 2 sale attempts with the ask held roughly flat each time — persistent listings suggest the price (not the market) is what's stuck; bring a comps-based counter.
Risks & watch-outs
- Watch-outs: built in 1929 — expect roof / HVAC / electrical / plumbing capex.
Questions for the listing agent
- Can we see the unit-by-unit rent roll, current vacancy, and any below-market leases? What's the average tenancy length?
- What capital expenditures (roof, boiler, parking lot, exteriors) have been made in the last 5 years, and what's planned in the next 2?
- Have any recent inspections been done? Can we get a copy of the seller's disclosures and any deferred-maintenance estimates?
- Built in 1929 — when were the roof, HVAC, electrical panel, plumbing, and water heater last replaced?
- Is there a deadline driving the sale (1031 exchange, divorce, estate, relocation)? That informs how much negotiation room exists.
- Schools are F-rated, which usually means shorter tenancies and higher turnover. Who's the typical renter profile here, and what's been the actual vacancy rate?
- Crime grade is F in this area — have there been break-ins, vandalism, or insurance claims at this property in the last 3 years? What carrier currently insures it and at what premium?
- What's the average days-on-market for RENTAL listings here right now (not sales)? A rising rental-DOM trend means longer vacancies and softer asking-rent achievability than the comps imply.
- What's the recent tenant-quality profile in this submarket — average credit score on applications, eviction rate, late-payment / NSF rate, and stable-employment percentage? A property-management company in the area should have these aggregated.
- How much new apartment / multifamily construction is in the pipeline within 1–3 miles? Heavy new supply (>2% of stock underway) typically softens rents 12–24 months out; light construction supports rent growth.
Investment metrics
- 1% rule
- 3.32% ✓
- Cap rate
- 29.44%
- Cash-on-cash
- 82.68%
- DSCR
- 4.68
- GRM
- 2.5
CMA / ARV
- ARV (median comp)
- $335,294
- List price
- $1,000,000
- Delta
- 198.25%
- Verdict
- OVERPRICED
- Comps
- 2 within 2.0 mi
Projected returns pro-forma
-3.0% appreciation · 0.73% rent growth · sell at horizon
- IRR
- 80.4%
- Equity multiple
- 4.55×
- Total profit
- $993,043
- Equity at exit
- $149,103
- IRR
- 83.3%
- Equity multiple
- 8.71×
- Total profit
- $2,158,412
- Equity at exit
- $86,462
Cash invested: $280,000 (down + closing). Projections, not guarantees.
Landlord ↔ Tenant lean methodology
- Overall (STATE)
- 62 Landlord-Friendly
- State Michigan
- 62 Landlord-Friendly · EVEN
- County
- — inherits STATE
- City
- — inherits STATE
ZIP-level market 48224
- Rents YoY
- 0.7%
- Active inventory
- 492
- Price-to-rent
- 50.3×
Monthly cashflow live
- Estimated rent
- $33,167 medium interval (Pro) →
- Mortgage (P&I)
- −$5,244
- Tax est. 1.5%
- −$1,250 /mo · $15,000/yr
- Insurance
- −$417
- HOA
- −$0
- Vacancy / Maint / Mgmt
- −$6,965
- Net cashflow
- $19,291
Break-even live
Sensitivity live
| Price | -10% $19,982 | -5% $19,637 | +0% $19,291 | +5% $18,946 | +10% $18,600 |
|---|---|---|---|---|---|
| Rent | -10% $16,671 | -5% $17,981 | +0% $19,291 | +5% $20,601 | +10% $21,911 |
| Rate | -1.0pp $19,795 | -0.5pp $19,545 | base $19,291 | +0.5pp $19,032 | +1.0pp $18,768 |
20-unit breakdown (identical units grouped — click to expand)
| Units | Beds | Baths | Est. rent |
|---|---|---|---|
| 20× units | 16 | 20 | $33,160 |
| #1 | 16 | 20 | $1,658 |
| #2 | 16 | 20 | $1,658 |
| #3 | 16 | 20 | $1,658 |
| #4 | 16 | 20 | $1,658 |
| #5 | 16 | 20 | $1,658 |
| #6 | 16 | 20 | $1,658 |
| #7 | 16 | 20 | $1,658 |
| #8 | 16 | 20 | $1,658 |
| #9 | 16 | 20 | $1,658 |
| #10 | 16 | 20 | $1,658 |
| #11 | 16 | 20 | $1,658 |
| #12 | 16 | 20 | $1,658 |
| #13 | 16 | 20 | $1,658 |
| #14 | 16 | 20 | $1,658 |
| #15 | 16 | 20 | $1,658 |
| #16 | 16 | 20 | $1,658 |
| #17 | 16 | 20 | $1,658 |
| #18 | 16 | 20 | $1,658 |
| #19 | 16 | 20 | $1,658 |
| #20 | 16 | 20 | $1,658 |
| Total (20 units) | $33,167 | ||
UW: 25.0% down · 7.5% · 30yr · 1.5% tax · 5.0% vac · 8.0% maint · 8.0% mgmt
Financing live
Cash to close
- Down payment
- $250,000
- Closing costs
- $30,000
- Reserves months
- —
- Total cash needed
- —
Loan-product check · same deal, 3 products live
Conventional
25% down · 7.5% · 30yr
- Down + closing
- —
- Monthly P&I
- —
- Monthly cashflow
- —
- DSCR
- —
- Eligible?
- —
Personal DTI + credit; lowest rate.
DSCR
20% down · 8.5% · 30yr
- Down + closing
- —
- Monthly P&I
- —
- Monthly cashflow
- —
- DSCR
- —
- Eligible?
- —
No personal income docs; deal must DSCR.
Hard money
10% down · 12.0% · 12mo
- Down + closing
- —
- Monthly P&I
- —
- Monthly cashflow
- —
- DSCR
- —
- Eligible?
- —
Short-term bridge; refi at stabilization.
Listing history 15 events
-
2026-06-21days on market $1,000,000 Active 17 DOM
-
2026-06-18days on market $1,000,000 Active 14 DOM
-
2026-06-17days on market $1,000,000 Active 13 DOM
-
2026-06-16days on market $1,000,000 Active 12 DOM
-
2026-06-15days on market $1,000,000 Active 11 DOM
-
2026-06-13days on market $1,000,000 Active 9 DOM
-
2026-06-13days on market $1,000,000 Active 8 DOM
-
2026-06-09days on market $1,000,000 Active 5 DOM
-
2026-06-08days on market $1,000,000 Active 4 DOM
-
2026-06-07remarks 699-char remark
-
2026-06-07statusdays on market $1,000,000 Active 3 DOM
-
2026-05-13historical
-
2026-05-13historical
-
2026-04-07$1,000,000 Active
-
2026-04-07$1,000,000 Active
ⓘ Source: listings_history table (triggers on properties + properties_extension) + one-shot
backfill from property_details.listing_events for pre-trigger history.
Climate risk First Street
- Flood 1/10 Low FEMA zone X (unshaded) · 0% chance over 30 yrs
- Wildfire 1/10 Low
- Heat 3/10 Moderate 7 d/yr ≥96°F today · 15 d/yr by 30 yrs out
- Wind 2/10 Low
- Air quality 3/10 Moderate 3 unhealthy d/yr today · 4 by 30 yrs out
Nearby sold comps map
Loading sold comps map…
Walkable amenities ~0.75 mi
Loading nearby amenities…
Taxation est. · year 1
- Rental income
- $398,004
- − Mortgage interest
- −$56,016
- − Property taxes
- −$15,000
- − Insurance
- −$5,000
- − Repairs & maintenance
- −$31,840
- − Management
- −$31,840
- − Depreciation
- −$29,091
- Taxable income
- $229,217
- Est. tax owed @ 24.0%
- −$55,012
- After-tax cash flow
- $176,482/yr
For passive investors: Depreciation is non-cash, so a rental often shows a tax loss while cash-flowing — sheltering income. Rental losses are passive: they offset passive income freely, and up to $25,000/yr can offset ordinary (W-2) income if you actively participate and your MAGI is under $100k (phasing out to $0 by $150k); unused losses carry forward. On sale, claimed depreciation is recaptured at up to 25%, and gains may owe capital-gains tax (a 1031 exchange can defer both). Figures are a year-1 estimate at your 24.0% rate — not tax advice; consult a CPA.
Condition & rehab AI · 14 photos
This multi-family property requires extensive repairs and renovations to improve its condition and increase its value. The property is in a state of disrepair and would benefit from exterior and interior renovations, HVAC and mechanical system upgrades, and landscaping and fencing repair.
Repairs flagged
- Major Exterior brick facade — The brick facade is visibly worn and in need of repair.
- Major Interior finishes — The interior appears to be in a state of disrepair, with exposed structural elements and incomplete finishes.
- Major Roof — The roof appears to be in a state of disrepair, with visible wear and tear.
- Major Flooring — The flooring appears to be in a state of disrepair, with visible wear and tear.
- Major HVAC and mechanical systems — The HVAC and mechanical systems appear to be in a state of disrepair, with visible wear and tear.
- Major Landscaping — The landscaping appears to be in a state of disrepair, with overgrown vegetation and a lack of maintenance.
- Major Fencing — The fencing appears to be in a state of disrepair, with visible wear and tear and some areas missing or damaged.
Value-add opportunities
- Resale Exterior renovation — A fresh exterior renovation would significantly improve the curb appeal and marketability of the property.
- Resale Interior renovation — A fresh interior renovation would improve the living conditions and marketability of the property.
- Resale HVAC and mechanical systems upgrade — Upgrading the HVAC and mechanical systems would improve the comfort and energy efficiency of the property.
- Resale Landscaping and fencing repair — A well-maintained and aesthetically pleasing landscaping and fencing would significantly improve the curb appeal and marketability of the property.
- Rental Residential unit upgrades — Upgrading the residential units with modern finishes and amenities would increase rental value and attract tenants.
- Both Commercial space upgrades — Upgrading the commercial space with modern finishes and amenities would increase both the resale and rental value of the property.
Renovation cost estimate screening
| Repair item | Severity | Est. cost |
|---|---|---|
| Exterior brick facade · The brick facade is visibly worn and in need of repair. | Major | $15,000–50,000 |
| Interior finishes · The interior appears to be in a state of disrepair, with exposed structural elements and incomplete finishes. | Major | $15,000–50,000 |
| Roof · The roof appears to be in a state of disrepair, with visible wear and tear. | Major | $15,000–50,000 |
| Flooring · The flooring appears to be in a state of disrepair, with visible wear and tear. | Major | $15,000–50,000 |
| HVAC and mechanical systems · The HVAC and mechanical systems appear to be in a state of disrepair, with visible wear and tear. | Major | $15,000–50,000 |
| Landscaping · The landscaping appears to be in a state of disrepair, with overgrown vegetation and a lack of maintenance. | Major | $15,000–50,000 |
| Fencing · The fencing appears to be in a state of disrepair, with visible wear and tear and some areas missing or damaged. | Major | $15,000–50,000 |
| Total estimated repair cost · 7 items | $105,000–350,000 |
Value-add ROI direction
- Resale Exterior renovation — A fresh exterior renovation would significantly improve the curb appeal and marketability of the property. ↑
- Resale Interior renovation — A fresh interior renovation would improve the living conditions and marketability of the property. ↑
- Resale HVAC and mechanical systems upgrade — Upgrading the HVAC and mechanical systems would improve the comfort and energy efficiency of the property. ↑
- Resale Landscaping and fencing repair — A well-maintained and aesthetically pleasing landscaping and fencing would significantly improve the curb appeal and marketability of the property. ↑
- Rental Residential unit upgrades — Upgrading the residential units with modern finishes and amenities would increase rental value and attract tenants. ↑
- Both Commercial space upgrades — Upgrading the commercial space with modern finishes and amenities would increase both the resale and rental value of the property. ↑
ⓘ Cost ranges are severity-bucket heuristics (US national rule-of-thumb). Get contractor quotes + a written scope before underwriting a rehab budget.
Schools (NCES district)
- District
- Detroit Public Schools Community District
- NCES district ID
- 2601103
- Math proficiency
- 10% ▼ -2.00%
- Reading proficiency
- 24% ▲ 6.00%
- Median HH income
- $25,815
- Composite
- 13.06/100
- National rank
- #9564
- State rank
- #499 of 540 in MI
Livability — Detroit
- Score
- 73/100
- State rank
- #218
- US rank
- #5427
Category grades
Schools grade is shown separately in the Schools card above.
Census & demographics
- Census place
- Detroit, MI
- County
- Wayne County · 1,562,939 people
- City population
- 572,865
- Metro
- Detroit-Warren-Dearborn, MI
- Population (ZIP)
- 39,668
- Household income
- $44,856
- Rent vs Own
- Severe rent burden
- 2515.0
Population outlook (Wayne County) Hauer SSP2
- Today (2025)
- 1,675,273 people
- By 2030
- 1,620,300 · -3.3%
- By 2040
- 1,502,341 · -10.3%
- By 2050
- 1,384,039 · -17.4%
- By 2075
- 1,124,592 · -32.9%
- By 2100
- 881,193 · -47.4%
Race, ethnicity, and origin ACS 2023
- Neighborhood character
- Predominantly Black (88%)
- Race & ethnicity
- Black 88% White 8% Two or more races 3% Hispanic / Latino 1%
- Common ancestry
- Iranian 1% Romanian 1% Lithuanian 1%
- Foreign-born
- 1%
- Languages at home
- 97% English-only · Spanish 2%
Political lean MEDSL · Wayne
- 2024 margin
- Strong D (+29.0) · D 62.7% · R 33.7% · Other 3.6%
- 2008→2024 swing
- -20.5pp toward R · 2008: 49.5pp · 2024: 29.0pp
- All cycles
- 2024: D+29.0 2020: D+38.1 2016: D+37.3 2012: D+46.9 2008: D+49.5
Not yet ingested
- Civics
- —
Market trends
- HPI YoY
- ▼ -226.38%
- Current HPI
- 161.886
- Rent YoY
- ▲ 0.73%
- Metro
- Detroit-Warren-Dearborn, MI
- State GDP YoY
- ▲ 1.37%
- F500 in state
- 28
Industry mix (Fortune 500 HQ in MI)
| Industry | F500 HQs | Revenue |
|---|---|---|
| Automotive Parts | 3 | $48B |
|
||
| Automotive | 2 | $372B |
|
||
| Chemicals | 1 | $45B |
|
||
| Automotive Retail | 1 | $29B |
|
||
| Healthcare / Medical Devices | 1 | $23B |
|
||
| Automotive Technology | 1 | $20B |
|
||
Price history
+0.0% since first listed4 events — show timeline
- 2026-05-13 Listing Removed — MiRealSource-MiMLS
- 2026-05-13 Listing Removed — REALCOMP
- 2026-04-07 Listed $1,000,000 REALCOMP
- 2026-04-07 Listed $1,000,000 MiRealSource-MiMLS
Cash-flow waterfall
monthlySold comps — $/sqft
last 12 mo · ≤1 miLoading sold comps…