 Fourplex
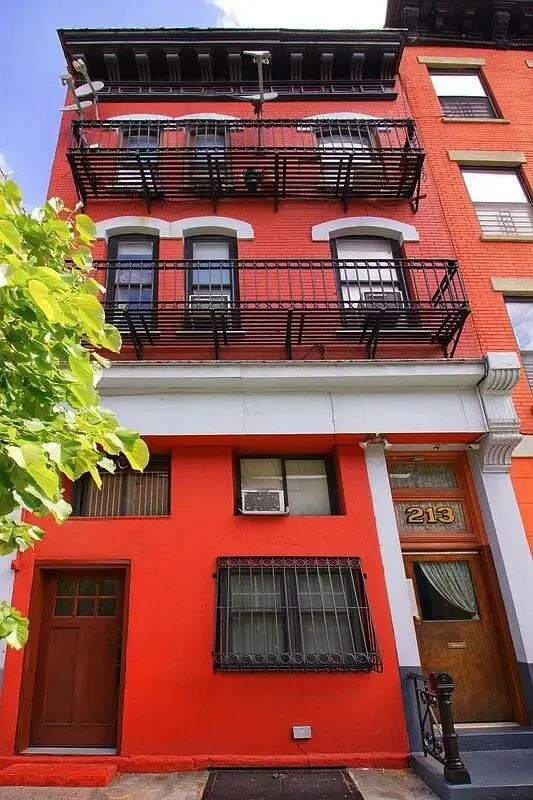
213 E 120th St · New York, NY
Flood risk No data
- FEMA flood zone
- —
- Chance of flooding over 30 yrs
- —
- Est. flood insurance / yr
- —
Fire risk No data
- Est. fire insurance / yr
- —
Heat risk No data
- Hot days now (above threshold)
- —
- Hot days in 30 yrs
- —
Wind risk No data
- Chance of severe wind over 30 yrs
- —
Air-quality risk No data
- Unhealthy air days now
- —
- Unhealthy air days in 30 yrs
- —
Risk factors via First Street. Map © Google.
Why this score? — see what drove the C grade
The composite is a weighted blend of 9 inputs, each scored 0–100. Each bar is that input's sub-score; the figure is the points it added to the 100-point composite (weight × sub-score).
- Cash flow +16.6/30.0
- ARV discount +7.5/15.0
- Appreciation +6.6/10.0
- DSCR +5.1/10.0
- Schools +5.0/10.0
- 1% rule +4.5/10.0
- Rent growth +3.9/5.0
- Livability +3.8/5.0
- Condition / age +2.2/5.0
$1,895,000
🖨 Deal sheet (PDF) 📄 Offer letter ✓ Due diligence
Multi-family units
County records classify this as Multi-Family (2-4 Unit). Listing-text estimate: 4 units. confirmed
Listing remarks
213 East 120th Street presents a compelling four-unit, mixed-use townhouse investment opportunity in the rapidly evolving East Harlem corridor. Built in 1899 and spanning approximately 5,200 square feet , the property is configured with 7 bedrooms, 4 bathrooms, and 16 total rooms across four units. Delivered fully vacant, this asset offers immediate value-add potential through renovation, repositioning, and improved operational efficiency. The building features a flexible layout with a mix of residential and ground-floor commercial or live/ work space , including a unit with direct access to a private backyard patio. Each residential unit is pre-plumbed for in-unit washer/dryers, enhancin
Key facts
- Full basement
- Mezzanine space
- 1,919 sq ft lot
Tags
Property features AI
Finance
- Financial info: Pets allowed in building (restrictions apply)
Exterior
- Home design: Single-story building; Entry at level 1
- Construction: Green building
- Exterior features: Private outdoor space (over 60 sq ft); Lot roughly 1,919 sq ft (approx. dimensions 101 x 19)
Interior
- Bedrooms: Total rooms: 15
- Bathrooms: 5 full bathrooms
- Heating & cooling: Cooling system present
- Interior features: Smoke-free property
- Laundry & utility: In-unit laundry
Neighborhood map
What this means for you Summary
Snapshot
- This is a 4 × 7-bed/5.0-bath units multifamily listed at $1.90M. Condition is rated fair.
Deal economics
- At list price, monthly cash flow is $1k ($14k/yr) — positive. Per door: $283/mo.
- The deal already cash-flows at list — no discount required.
- To meet the 1% rule (rent ≥ 1% of price), the offer needs to be $1.80M (4.9% below list).
- Recommended offer: $1.78M (6.0% below list) — sets the bar for market timing.
- Cap rate 7.0% vs local median 2.6% in New York — top-decile yield for the area; either an underpriced asset or a hidden risk that comps aren't pricing in. Stress-test before assuming the spread holds.
Location & tenants
- Location reads 75/100 on livability (#268 in NY, #4,188 nationally) — a middle-class / working-renter tenant base. Strengths: amenities A+, commute A+, health & safety A; Watch: crime F, cost of living F.
- Market conditions: Rents rising fast (+5.6%/yr); 71 active listings in the ZIP; 4,467 units permitted in New York County in 2024 (4,463 in 5+ unit buildings).
- At $18,012/mo this rent would consume 479% of the median local household income ($45k/yr) (locally 3992% of renters already pay >50% of income on rent) — very limited rent-growth headroom before tenants either downsize or default.
Forward outlook
- In year one you build about $74k of equity ($13k loan paydown + $61k appreciation (3.2% local appreciation)).
- New York County population projected at +21% by 2050 — long-run rental-demand tailwind backs the buy-and-hold thesis.
- At projected returns (3.2% appreciation + 5.6% rent growth), your $531k cash investment doubles in ~5 years — after that, you're playing with house money.
- By year 2, paydown + projected appreciation supports a ~$121k cash-out refi (75% LTV) — recoverable capital for the next deal without selling this one.
Negotiation context
- It's been on market 72 days — a 6% lower offer ($1.78M) is reasonable based on typical stale-listing flexibility.
- 5 sale attempts since 3y ago; this cycle's ask has dropped $100k (5%) from the opening price — seller is motivated, your offer sets the floor, not the list.
Risks & watch-outs
- Watch-outs: built in 1899 — expect roof / HVAC / electrical / plumbing capex.
Questions for the listing agent
- It's been on market 72 days. Have you received any prior offers? Is the seller open to a 6% concession, seller financing, or rate buy-down credit?
- Can we see the unit-by-unit rent roll, current vacancy, and any below-market leases? What's the average tenancy length?
- What capital expenditures (roof, boiler, parking lot, exteriors) have been made in the last 5 years, and what's planned in the next 2?
- Have any recent inspections been done? Can we get a copy of the seller's disclosures and any deferred-maintenance estimates?
- Built in 1899 — when were the roof, HVAC, electrical panel, plumbing, and water heater last replaced?
- Why hasn't it sold? Are there any deal-killer items the seller is aware of (foundation, flood, title, zoning, code violations)?
- Is there a deadline driving the sale (1031 exchange, divorce, estate, relocation)? That informs how much negotiation room exists.
- Schools are B-rated — typically a magnet for longer-tenancy family renters. What's the average tenant stay here, and is there a school-zone premium baked into asking?
- Crime grade is F in this area — have there been break-ins, vandalism, or insurance claims at this property in the last 3 years? What carrier currently insures it and at what premium?
- What's the average days-on-market for RENTAL listings here right now (not sales)? A rising rental-DOM trend means longer vacancies and softer asking-rent achievability than the comps imply.
- What's the recent tenant-quality profile in this submarket — average credit score on applications, eviction rate, late-payment / NSF rate, and stable-employment percentage? A property-management company in the area should have these aggregated.
- How much new apartment / multifamily construction is in the pipeline within 1–3 miles? Heavy new supply (>2% of stock underway) typically softens rents 12–24 months out; light construction supports rent growth.
Investment metrics
- 1% rule
- 0.95% ✗
- Cap rate
- 7.01%
- Cash-on-cash
- 2.56%
- DSCR
- 1.11
- GRM
- 8.8
CMA / ARV
No comps found within radius.
Projected returns pro-forma
3.23% appreciation · 5.62% rent growth · sell at horizon
- IRR
- 11.9%
- Equity multiple
- 1.70×
- Total profit
- $372,784
- Equity at exit
- $876,873
- IRR
- 15.2%
- Equity multiple
- 3.41×
- Total profit
- $1,277,885
- Equity at exit
- $1,370,970
Cash invested: $530,600 (down + closing). Projections, not guarantees.
Landlord ↔ Tenant lean methodology
- Overall (CITY)
- 0 Strongly Tenant-Friendly
- State New York
- 15 Strongly Tenant-Friendly · D+10
- County
- — inherits STATE
- City New York
- 0 Strongly Tenant-Friendly · D+34
ZIP-level market 10035
- Home prices YoY
- 1.0%
- Rents YoY
- 5.6%
- Active inventory
- 71
- Price-to-rent
- 35.1×
Monthly cashflow live
- Estimated rent
- $18,012 medium interval (Pro) →
- Mortgage (P&I)
- −$9,938
- Tax est. 1.5%
- −$2,369 /mo · $28,425/yr
- Insurance
- −$790
- HOA
- −$0
- Vacancy / Maint / Mgmt
- −$3,783
- Net cashflow
- $1,134
Break-even live
Sensitivity live
| Price | -10% $2,443 | -5% $1,788 | +0% $1,134 | +5% $479 | +10% $-176 |
|---|---|---|---|---|---|
| Rent | -10% $-289 | -5% $422 | +0% $1,134 | +5% $1,845 | +10% $2,557 |
| Rate | -1.0pp $2,088 | -0.5pp $1,616 | base $1,134 | +0.5pp $643 | +1.0pp $143 |
4-unit breakdown (identical units grouped — click to expand)
| Units | Beds | Baths | Est. rent |
|---|---|---|---|
| 4× units | 7 | 5 | $18,012 |
| #1 | 7 | 5 | $4,503 |
| #2 | 7 | 5 | $4,503 |
| #3 | 7 | 5 | $4,503 |
| #4 | 7 | 5 | $4,503 |
| Total (4 units) | $18,012 | ||
UW: 25.0% down · 7.5% · 30yr · 1.5% tax · 5.0% vac · 8.0% maint · 8.0% mgmt
Financing live
Cash to close
- Down payment
- $473,750
- Closing costs
- $56,850
- Reserves months
- —
- Total cash needed
- —
Loan-product check · same deal, 3 products live
Conventional
25% down · 7.5% · 30yr
- Down + closing
- —
- Monthly P&I
- —
- Monthly cashflow
- —
- DSCR
- —
- Eligible?
- —
Personal DTI + credit; lowest rate.
DSCR
20% down · 8.5% · 30yr
- Down + closing
- —
- Monthly P&I
- —
- Monthly cashflow
- —
- DSCR
- —
- Eligible?
- —
No personal income docs; deal must DSCR.
Hard money
10% down · 12.0% · 12mo
- Down + closing
- —
- Monthly P&I
- —
- Monthly cashflow
- —
- DSCR
- —
- Eligible?
- —
Short-term bridge; refi at stabilization.
Listing history 27 events
-
2026-06-18days on market $1,895,000 Active 72 DOM
-
2026-06-17days on market $1,895,000 Active 71 DOM
-
2026-06-15days on market $1,895,000 Active 69 DOM
-
2026-06-13days on market $1,895,000 Active 67 DOM
-
2026-06-10days on market $1,895,000 Active 63 DOM
-
2026-06-08days on market $1,895,000 Active 62 DOM
-
2026-06-08days on market $1,895,000 Active 61 DOM
-
2026-06-04days on market $1,895,000 Active 58 DOM
-
2026-06-03days on market $1,895,000 Active 57 DOM
-
2026-06-01days on market $1,895,000 Active 55 DOM
-
2026-05-31pricedays on market $1,895,000 Active 54 DOM
-
2026-04-07$1,995,000 Active
-
2026-04-07$1,995,000 Active
-
2025-04-25price $1,900,000
-
2025-03-25price $1,995,000
-
2024-10-22price $2,100,000
-
2024-02-20historical $3,950
-
2024-01-05$3,950
-
2024-01-04price $2,050,000
-
2024-01-04price $2,050,000
-
2023-12-31historical $4,200
-
2023-12-03price $4,200
-
2023-11-20price $2,200,000
-
2023-08-11price $2,350,000
-
2023-08-03
-
2023-06-17historical
-
2023-05-09$2,495,000 Active
ⓘ Source: listings_history table (triggers on properties + properties_extension) + one-shot
backfill from property_details.listing_events for pre-trigger history.
Nearby sold comps map
Loading sold comps map…
Walkable amenities ~0.75 mi
Loading nearby amenities…
Taxation est. · year 1
- Rental income
- $216,144
- − Mortgage interest
- −$106,149
- − Property taxes
- −$28,425
- − Insurance
- −$9,475
- − Repairs & maintenance
- −$17,292
- − Management
- −$17,292
- − Depreciation
- −$55,127
- Taxable loss
- −$17,616
- Est. tax savings @ 24.0%
- +$4,228
- After-tax cash flow
- $17,831/yr
For passive investors: Depreciation is non-cash, so a rental often shows a tax loss while cash-flowing — sheltering income. Rental losses are passive: they offset passive income freely, and up to $25,000/yr can offset ordinary (W-2) income if you actively participate and your MAGI is under $100k (phasing out to $0 by $150k); unused losses carry forward. On sale, claimed depreciation is recaptured at up to 25%, and gains may owe capital-gains tax (a 1031 exchange can defer both). Figures are a year-1 estimate at your 24.0% rate — not tax advice; consult a CPA.
Condition & rehab AI · 1 photo
This four-unit townhouse in East Harlem requires moderate repairs and maintenance, with potential for significant value increase through exterior updates, HVAC maintenance, and interior renovations.
Repairs flagged
- Minor paint touch-ups — Some areas of the exterior paint may need touch-ups.
- Minor window screens — Window screens may need cleaning or replacement.
- Minor HVAC maintenance — Regular HVAC maintenance is recommended to ensure efficiency and longevity.
- Minor landscaping — Some landscaping improvements could enhance curb appeal and attract tenants/investors.
Value-add opportunities
- Both exterior paint touch-ups — Enhances curb appeal and property value.
- Both HVAC maintenance — Improves comfort and energy efficiency, attracting tenants/investors.
- Both landscaping improvements — Enhances curb appeal and attracts potential buyers/tenants.
- Both interior updates — Modernizes the interior and enhances the overall appeal of the property.
- Both renovation of units — Brings the property up to current standards and attracts more tenants/investors.
Renovation cost estimate screening
| Repair item | Severity | Est. cost |
|---|---|---|
| paint touch-ups · Some areas of the exterior paint may need touch-ups. | Minor | $500–3,000 |
| window screens · Window screens may need cleaning or replacement. | Minor | $500–3,000 |
| HVAC maintenance · Regular HVAC maintenance is recommended to ensure efficiency and longevity. | Minor | $500–3,000 |
| landscaping · Some landscaping improvements could enhance curb appeal and attract tenants/investors. | Minor | $500–3,000 |
| Total estimated repair cost · 4 items | $2,000–12,000 |
Value-add ROI direction
- Both exterior paint touch-ups — Enhances curb appeal and property value. ↑
- Both HVAC maintenance — Improves comfort and energy efficiency, attracting tenants/investors. ↑
- Both landscaping improvements — Enhances curb appeal and attracts potential buyers/tenants. ↑
- Both interior updates — Modernizes the interior and enhances the overall appeal of the property. ↑
- Both renovation of units — Brings the property up to current standards and attracts more tenants/investors. ↑
ⓘ Cost ranges are severity-bucket heuristics (US national rule-of-thumb). Get contractor quotes + a written scope before underwriting a rehab budget.
Schools (NCES district)
No district data.
Livability — New York
- Score
- 75/100
- State rank
- #268
- US rank
- #4188
Category grades
Schools grade is shown separately in the Schools card above.
Census & demographics
- Census place
- New York, NY
- County
- New York County · 1,599,927 people
- City population
- 7,731,280
- Metro
- New York-Newark-Jersey City, NY-NJ-PA
- Population (ZIP)
- 38,862
- Household income
- $45,121
- Rent vs Own
- Severe rent burden
- 3992.0
Population outlook (New York County) Hauer SSP2
- Today (2025)
- 1,825,725 people
- By 2030
- 1,904,611 · +4.3%
- By 2040
- 2,052,719 · +12.4%
- By 2050
- 2,206,601 · +20.9%
- By 2075
- 2,509,427 · +37.4%
- By 2100
- 2,702,933 · +48.0%
Race, ethnicity, and origin ACS 2023
- Neighborhood character
- Diverse neighborhood (Simpson 0.68)
- Race & ethnicity
- Hispanic / Latino 42% Black 35% White 14% Two or more races 13% Asian 6% Native American 2%
- Hispanic origin (detail)
- Mexican 5% Puerto Rican 16% Dominican 10%
- Common ancestry
- Lithuanian 2% Romanian 1% Scotch-Irish 1%
- Foreign-born
- 23% · Canada, China, Jamaica
- Languages at home
- 54% English-only · Spanish 34% Other Indo-European 3% Russian/Polish/Slavic 2%
Political lean MEDSL · New York
- 2024 margin
- Solid D (+64.8) · D 82.4% · R 17.6%
- 2008→2024 swing
- -7.4pp toward R · 2008: 72.2pp · 2024: 64.8pp
- All cycles
- 2024: D+64.8 2020: D+74.5 2016: D+77.2 2012: D+69.6 2008: D+72.2
Not yet ingested
- Civics
- —
Market trends
- HPI YoY
- ▲ 3.23%
- Current HPI
- 317.1637
- Rent YoY
- ▲ 5.62%
- Metro
- New York-Newark-Jersey City, NY-NJ-PA
- State GDP YoY
- ▲ 2.60%
- F500 in state
- 92
Industry mix (Fortune 500 HQ in NY)
| Industry | F500 HQs | Revenue |
|---|---|---|
| Financial Services | 10 | $950B |
|
||
| Consumer Goods | 9 | $162B |
|
||
| Insurance | 4 | $225B |
|
||
| Telecommunications | 2 | $144B |
|
||
| Pharmaceuticals | 2 | $112B |
|
||
| Media / Entertainment | 2 | $69B |
|
||
Price history
-20.0% since first listed16 events — show timeline
- 2026-04-07 Listed $1,995,000 OneKey® MLS as Distributed by MLS Grid
- 2026-04-07 Listed $1,995,000 RLS at REBNY
- 2025-04-25 Price Changed $1,900,000 RLS at REBNY
- 2025-03-25 Price Changed $1,995,000 RLS at REBNY
- 2024-10-22 Price Changed $2,100,000 RLS at REBNY
- 2024-02-20 Rental Removed $3,950 ONEKEY
- 2024-01-05 Listed for Rent $3,950 ONEKEY
- 2024-01-04 Price Changed $2,050,000 OneKey® MLS as Distributed by MLS Grid
- 2024-01-04 Price Changed $2,050,000 RLS at REBNY
- 2023-12-31 Rental Removed $4,200 ONEKEY
- 2023-12-03 Price Changed $4,200 ONEKEY
- 2023-11-20 Price Changed $2,200,000 RLS at REBNY
- 2023-08-11 Price Changed $2,350,000 RLS at REBNY
- 2023-08-03 Listed for Rent — ONEKEY
- 2023-06-17 Listing Removed — OneKey® MLS as Distributed by MLS Grid
- 2023-05-09 Listed $2,495,000 OneKey® MLS as Distributed by MLS Grid
Cash-flow waterfall
monthlySold comps — $/sqft
last 12 mo · ≤1 miLoading sold comps…