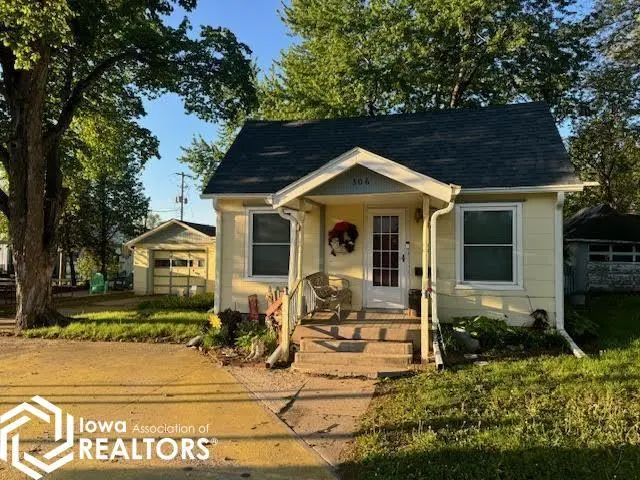
306 Pearl St · Bedford, IA
Flood risk 4/10 · Minor
- FEMA flood zone
- X (unshaded)
- Chance of flooding over 30 yrs
- 0.2%
- Est. flood insurance / yr
- $473 – $860
Fire risk 4/10 · Minor
- Est. fire insurance / yr
- $902 – $1,676
Heat risk 3/10 · Minor
- Hot days now (above 105°F)
- 7 days/yr
- Hot days in 30 yrs
- 15 days/yr
Wind risk 2/10 · Minimal
- Chance of severe wind over 30 yrs
- —
Air-quality risk 1/10 · Minimal
- Unhealthy air days now
- 0 days/yr
- Unhealthy air days in 30 yrs
- 0 days/yr
Risk factors via First Street. Map © Google.
Why this score? — see what drove the A grade
The composite is a weighted blend of 9 inputs, each scored 0–100. Each bar is that input's sub-score; the figure is the points it added to the 100-point composite (weight × sub-score).
- Cash flow +28.6/30.0
- ARV discount +15.0/15.0
- DSCR +10.0/10.0
- Appreciation +10.0/10.0
- Schools +7.0/10.0
- 1% rule +6.9/10.0
- Livability +4.1/5.0
- Rent growth +2.5/5.0
- Condition / age +2.5/5.0
$72,900
🖨 Deal sheet 📄 Offer letter ✓ Due diligence
Listing remarks
Welcome home to this charming two-bedroom, one-bathroom gem that checks all the right boxes without breaking the bank. This affordably priced home features a newer roof, guttering, gutter guards, and newer windows, so you can skip those big-ticket worries right from the start. The on-demand water heater means endless hot showers, and the range, dishwasher, microwave are included so you can move right in without the hassle. Need extra space? The full basement has you covered, whether you want storage, a workshop, or a future hangout spot. The attached garage keeps your car cozy in those Iowa winters, and the beautifully landscaped fenced-in back yard gives kids and pets plenty of room to roa
Key facts
- Attached garage
- Newer roof
- Full basement
Tags
Property features AI
Exterior
- Parking: Attached garage with storage (1 car); Concrete driveway
- Utilities: Public water; Public sewer; Electric with circuit breakers
- Home design: Single-family residence; Residential property
- Construction: Block and fiber cement construction
- Exterior features: Wood fencing; Shingle roof; Public-maintained city street frontage; Lot approximately 0.19 acre (66 x 126); Zoned Business/Commercial and Residential; 1 common wall
Interior
- Kitchen: Range, Microwave, Exhaust Fan, Dishwasher, Disposal
- Flooring: Carpet; Vinyl
- Bathrooms: 1 full bathroom
- Heating & cooling: Steam heating; Window air conditioning units
- Interior features: Range, Microwave, Exhaust Fan, Dishwasher, Disposal, Tankless water heater, Electric water heater; Basement
- Laundry & utility: Tankless water heater, Electric water heater
Neighborhood map
What this means for you Summary
Snapshot
- This is a 2-bed/1.0-bath single-family listed at $73k.
Deal economics
- At list price, monthly cash flow is $239 ($3k/yr) — positive.
- The deal already cash-flows at list — no discount required.
- Meets the 1% rule at list price ($869 rent vs $73k).
Location & tenants
- Location reads 82/100 on livability (#50 in IA, #1,245 nationally) — a professional / high-income tenant draw. Strengths: schools A+, crime A+, cost of living A+; Watch: amenities F, commute F.
- Bedford Community School District (rural): math 81% / reading 85% proficiency, ranked #23 of 289 in IA (top 8%) — strong family-tenant draw, lease renewals of 3-5y typical.
- Market conditions: 33 active listings in the ZIP; 4 units permitted in Taylor County in 2024 (0 in 5+ unit buildings).
Forward outlook
- In year one you build about $8k of equity ($504 loan paydown + $7k appreciation (10.0% local appreciation)).
- At projected returns (10.0% appreciation + 3.0% rent growth), your $20k cash investment doubles in ~2 years — after that, you're playing with house money.
- By year 5, paydown + projected appreciation supports a ~$36k cash-out refi (75% LTV) — recoverable capital for the next deal without selling this one.
Negotiation context
- Only 10 days on market — expect competitive offers; lowballing is unlikely to land.
Risks & watch-outs
- Watch-outs: built in 1900 — expect roof / HVAC / electrical / plumbing capex.
Questions for the listing agent
- Built in 1900 — when were the roof, HVAC, electrical panel, plumbing, and water heater last replaced?
- Is there a deadline driving the sale (1031 exchange, divorce, estate, relocation)? That informs how much negotiation room exists.
- Schools are A-rated — typically a magnet for longer-tenancy family renters. What's the average tenant stay here, and is there a school-zone premium baked into asking?
- What's the average days-on-market for RENTAL listings here right now (not sales)? A rising rental-DOM trend means longer vacancies and softer asking-rent achievability than the comps imply.
- What's the recent tenant-quality profile in this submarket — average credit score on applications, eviction rate, late-payment / NSF rate, and stable-employment percentage? A property-management company in the area should have these aggregated.
- How much new for-sale + rental construction is in the pipeline within 1–3 miles? Heavy new supply typically softens prices + rents 12–24 months out; constrained supply supports both.
Investment metrics
- 1% rule
- 1.19% ✓
- Cap rate
- 10.23%
- Cash-on-cash
- 14.07%
- DSCR
- 1.63
- GRM
- 7.0
CMA / ARV
- ARV (median comp)
- $89,837
- List price
- $72,900
- Delta
- -18.85%
- Verdict
- UNDERPRICED
- Comps
- 20 within 1.0 mi
Show comp detail 5 sales within ~0.75 mi
| Address | Dist | Beds/Ba | Sqft | Sold | Price | $/sf | Match |
|---|---|---|---|---|---|---|---|
| 507 North St | 0.20mi | 2/2.0 | 944 (-2%) | 4mo | $65,000 | $69 | 80 |
| 803 Jackson St | 0.38mi | 2/1.0 | 900 (-6%) | 1mo | $110,000 | $122 | 71 |
| 407 Randolph St | 0.65mi | 2/1.0 | 928 (-4%) | 13mo | $89,000 | $96 | 53 |
| 1606 Illinois St | 0.60mi | 2/1.0 | 1,008 (+5%) | 16mo | $108,000 | $107 | 51 |
| 1305 Washington St | 0.62mi | 2/1.0 | 864 (-10%) | 12mo | $95,000 | $110 | 44 |
Match score weights: distance 35% · size 25% · config 20% · recency 20%. Top-matched comps best support the ARV.
Projected returns pro-forma
10.0% appreciation · 3.0% rent growth · sell at horizon
- IRR
- 34.6%
- Equity multiple
- 3.69×
- Total profit
- $54,928
- Equity at exit
- $65,674
- IRR
- 29.8%
- Equity multiple
- 8.33×
- Total profit
- $149,722
- Equity at exit
- $141,629
Cash invested: $20,412 (down + closing). Projections, not guarantees.
Landlord ↔ Tenant lean methodology
- Overall (STATE)
- 83 Strongly Landlord-Friendly
- State Iowa
- 83 Strongly Landlord-Friendly · R+6
- County
- — inherits STATE
- City
- — inherits STATE
ZIP-level market 50833
- Home prices YoY
- 12.5%
- Active inventory
- 33
- Price-to-rent
- 7.0×
Monthly cashflow live
- Estimated rent
- $869 medium interval (Pro) →
- Mortgage (P&I)
- −$382
- Tax from tax record
- −$34 /mo · $414/yr
- Insurance
- −$30
- HOA
- −$0
- Vacancy / Maint / Mgmt
- −$183
- Net cashflow
- $239
Break-even live
UW: 25.0% down · 7.5% · 30yr · 1.5% tax · 5.0% vac · 8.0% maint · 8.0% mgmt
Financing live
Cash to close
- Down payment
- $18,225
- Closing costs
- $2,187
- Reserves months
- —
- Total cash needed
- —
Loan-product check · same deal, 3 products live
Conventional
25% down · 7.5% · 30yr
- Down + closing
- —
- Monthly P&I
- —
- Monthly cashflow
- —
- DSCR
- —
- Eligible?
- —
Personal DTI + credit; lowest rate.
DSCR
20% down · 8.5% · 30yr
- Down + closing
- —
- Monthly P&I
- —
- Monthly cashflow
- —
- DSCR
- —
- Eligible?
- —
No personal income docs; deal must DSCR.
Hard money
10% down · 12.0% · 12mo
- Down + closing
- —
- Monthly P&I
- —
- Monthly cashflow
- —
- DSCR
- —
- Eligible?
- —
Short-term bridge; refi at stabilization.
Listing history 2 events
-
2026-05-14status Pending 944-char remark
-
2026-05-02$72,900 Active 944-char remark
ⓘ Source: listings_history table (triggers on properties + properties_extension) + one-shot
backfill from property_details.listing_events for pre-trigger history.
Tax reassessment forecast IA · Partial reset (capped growth)
- Current annual tax
- $414 · $34/mo
- Projected year-2 tax
- $779 · $65/mo
- Expected delta
- +$365/yr (+$30/mo · 88.2%)
ⓘ Screening estimate from a state-policy table — verify with the county assessor before closing.
Climate risk First Street
- Flood 4/10 Moderate FEMA zone X (unshaded) · 20% chance over 30 yrs
- Wildfire 4/10 Moderate
- Heat 3/10 Moderate 7 d/yr ≥105°F today · 15 d/yr by 30 yrs out
- Wind 2/10 Low
- Air quality 1/10 Low 0 unhealthy d/yr today · 0 by 30 yrs out
Nearby sold comps map
Loading sold comps map…
Walkable amenities ~0.75 mi
Loading nearby amenities…
Taxation est. · year 1
- Rental income
- $10,429
- − Mortgage interest
- −$4,084
- − Property taxes
- −$414
- − Insurance
- −$364
- − Repairs & maintenance
- −$834
- − Management
- −$834
- − Depreciation
- −$2,121
- Taxable income
- $1,777
- Est. tax owed @ 24.0%
- −$427
- After-tax cash flow
- $2,446/yr
For passive investors: Depreciation is non-cash, so a rental often shows a tax loss while cash-flowing — sheltering income. Rental losses are passive: they offset passive income freely, and up to $25,000/yr can offset ordinary (W-2) income if you actively participate and your MAGI is under $100k (phasing out to $0 by $150k); unused losses carry forward. On sale, claimed depreciation is recaptured at up to 25%, and gains may owe capital-gains tax (a 1031 exchange can defer both). Figures are a year-1 estimate at your 24.0% rate — not tax advice; consult a CPA.
Schools (NCES district)
- District
- Bedford Community School District
- NCES district ID
- 1904560
- Math proficiency
- 81% ▬ 0.00%
- Reading proficiency
- 85% ▲ 3.00%
- Median HH income
- $43,547
- Composite
- 69.52/100
- National rank
- #305
- State rank
- #23 of 289 in IA
Livability — Bedford
- Score
- 82/100
- State rank
- #50
- US rank
- #1245
Category grades
Schools grade is shown separately in the Schools card above.
Census & demographics
- Census place
- Bedford, IA
- Population (ZIP)
- 2,085
Population outlook (Taylor County) Hauer SSP2
- Today (2025)
- 6,143 people
- By 2030
- 6,100 · -0.7%
- By 2040
- 6,080 · -1.0%
- By 2050
- 6,146 · +0.0%
- By 2075
- 6,596 · +7.4%
- By 2100
- 6,954 · +13.2%
Race, ethnicity, and origin ACS 2023
- Neighborhood character
- Predominantly White (95%)
- Race & ethnicity
- White 95% Hispanic / Latino 2% Two or more races 2%
- Common ancestry
- Slovak 2% Iranian 1% Italian 1%
- Foreign-born
- 1% · Canada
- Languages at home
- 99% English-only · Spanish 1%
Political lean MEDSL · Taylor
- 2024 margin
- Solid R (+55.7) · D 21.6% · R 77.4% · Other 1.0%
- 2008→2024 swing
- -47.1pp toward R · 2008: -8.6pp · 2024: -55.7pp
- All cycles
- 2024: R+55.7 2020: R+52.9 2016: R+45.1 2012: R+14.1 2008: R+8.6
Not yet ingested
- Civics
- —
Market trends
- HPI YoY
- ▲ 15.13%
- Current HPI
- 136.32
- Rent YoY
- —
- Metro
- —
- State GDP YoY
- ▲ 2.48%
- F500 in state
- 4
Industry mix (Fortune 500 HQ in IA)
| Industry | F500 HQs | Revenue |
|---|---|---|
| Financial Services | 1 | $16B |
|
||
| Retail / Convenience | 1 | $15B |
|
||
Price history
2 events — show timeline
- 2026-05-14 Pending — IAR
- 2026-05-02 Listed $72,900 IAR
Property tax history
+6.2%/yrLatest (2025): $414 · +2.5% YoY. Source: county tax records.
Cash-flow waterfall
monthlySold comps — $/sqft
last 12 mo · ≤1 miLoading sold comps…