 🔨 Auction
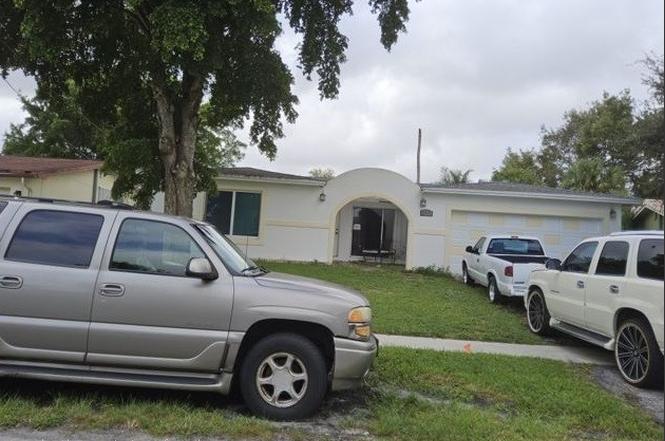
2421 NW 87th Ave · Sunrise, FL
Flood risk 1/10 · Minimal
- FEMA flood zone
- X (shaded)
- Chance of flooding over 30 yrs
- 0.0%
- Est. flood insurance / yr
- $507 – $1,088
Fire risk 1/10 · Minimal
- Est. fire insurance / yr
- $947 – $1,759
Heat risk 10/10 · Severe
- Hot days now (above 105°F)
- 7 days/yr
- Hot days in 30 yrs
- 27 days/yr
Wind risk 10/10 · Severe
- Chance of severe wind over 30 yrs
- 99.0%
Air-quality risk 3/10 · Minor
- Unhealthy air days now
- 2 days/yr
- Unhealthy air days in 30 yrs
- 3 days/yr
Risk factors via First Street. Map © Google.
Why this score? — see what drove the F grade
The composite is a weighted blend of 9 inputs, each scored 0–100. Each bar is that input's sub-score; the figure is the points it added to the 100-point composite (weight × sub-score).
- ARV discount +7.5/15.0
- Cash flow +7.4/30.0
- Livability +4.2/5.0
- Schools +4.1/10.0
- Rent growth +2.7/5.0
- Condition / age +2.5/5.0
- 1% rule +2.1/10.0
- DSCR +1.5/10.0
- Appreciation +0.0/10.0
$5,000
🖨 Deal sheet 📄 Offer letter ✓ Due diligence
Listing remarks
Foreclosure Auction Ends June 18, 2026 at 10:00 AM EST. Explore this charming 3-bedroom, 2-bath residence set in a peaceful and well-located Sunrise community. The list price is the opening bid for the online auction. Sold As-is. Explore more details and submit your bid through Federa Home App.
Key facts
- 6,970 sq ft lot
- 2 garage spots
- Built 1971
Property features AI
Finance
- Other: Zoning: RS-5
Exterior
- Parking: Attached garage with 2 spaces
- Utilities: Other water source; Other sewer
- Home design: Single-family residence; One level
- Construction: Construction materials: see remarks; Other roof
- Exterior features: Front porch
Interior
- Flooring: Other
- Bathrooms: 2 full bathrooms
- Heating & cooling: No heating specified; No cooling specified
- Interior features: Front porch; Other flooring
Neighborhood map
What this means for you Summary
Snapshot
- This is a 3-bed/2.0-bath single-family listed at $5k.
Deal economics
- At list price, monthly cash flow is $-639 ($-8k/yr) — negative.
- The deal already cash-flows at list — no discount required.
- Meets the 1% rule at list price ($3k rent vs $5k).
Location & tenants
- Location reads 83/100 on livability (#56 in FL, #986 nationally) — a professional / high-income tenant draw. Strengths: commute A+, housing A+, health & safety A+; Watch: employment C-, amenities F.
- Broward (suburban): math 42% / reading 53% proficiency, ranked #46 of 73 in FL (top 63%) — families likely to look elsewhere, expect single-tenant / working-renter base with shorter leases.
- Market conditions: Rents flat; 559 active listings in the ZIP; 40 comparable units currently listed for rent nearby; rentals at typical pace (median 23d on market — plan ~3-4 weeks tenant-placement turnaround); 2,111 units permitted in Broward County in 2024 (1,265 in 5+ unit buildings).
- At $3,476/mo this rent would consume 58% of the median local household income ($72k/yr) (locally 931% of renters already pay >50% of income on rent) — very limited rent-growth headroom before tenants either downsize or default.
Forward outlook
- Local home prices are declining (-3.0%/yr); year-one equity from $3k of loan paydown is wiped out by about $15k of value loss. Plan a longer hold.
- Broward County population projected at +34% by 2050 — long-run rental-demand tailwind backs the buy-and-hold thesis.
Negotiation context
- Only 7 days on market — expect competitive offers; lowballing is unlikely to land.
Risks & watch-outs
- Watch-outs: property tax is 146.9% of price.
- Climate carrying-cost: severe wind risk, 99% chance of damaging wind over 30y; extreme-heat days projected 7→27/yr by 2055 (HVAC capex compounding) — expect insurance premiums to compound above CPI over the hold.
Questions for the listing agent
- What do current leases actually rent for vs. the listed asking? Can we see a recent rent roll and the last 12 months of T-12 income?
- Built in 1971 — when were the roof, HVAC, electrical panel, plumbing, and water heater last replaced?
- Property tax is high relative to price — has the assessment been appealed recently, and will the sale trigger a re-assessment?
- Is there a deadline driving the sale (1031 exchange, divorce, estate, relocation)? That informs how much negotiation room exists.
- The area grade is low — what's the realistic commute time and amenity access for the typical tenant pool here? Any planned neighborhood developments (good or bad) we should know about?
- What's the average days-on-market for RENTAL listings here right now (not sales)? A rising rental-DOM trend means longer vacancies and softer asking-rent achievability than the comps imply.
- What's the recent tenant-quality profile in this submarket — average credit score on applications, eviction rate, late-payment / NSF rate, and stable-employment percentage? A property-management company in the area should have these aggregated.
- How much new for-sale + rental construction is in the pipeline within 1–3 miles? Heavy new supply typically softens prices + rents 12–24 months out; constrained supply supports both.
Investment metrics
- 1% rule
- 0.71% ✗
- Cap rate
- 4.73%
- Cash-on-cash
- -5.59%
- DSCR
- 0.75
- GRM
- 11.7
CMA / ARV
- ARV (on-the-fly)
- $489,800
- Comps found
- 12
Show comp detail 12 sales within ~0.75 mi
| Address | Dist | Beds/Ba | Sqft | Sold | Price | $/sf | Match |
|---|---|---|---|---|---|---|---|
| 8390 NW 21st Ct | 0.36mi | 3/2.0 | 1,542 (-2%) | 3mo | $405,000 | $263 | 76 |
| 2511 NW 87th Ave | 0.14mi | 4/3.0 (+1) | 1,645 (+4%) | 3mo | $510,000 | $310 | 75 |
| 8510 Sunset Strip | 0.21mi | 3/2.0 | 1,438 (-9%) | 3mo | $490,000 | $341 | 73 |
| 2477 NW 84th Way | 0.26mi | 3/2.0 | 1,500 (-5%) | 10mo | $450,000 | $300 | 71 |
| 8941 NW 26th Pl | 0.35mi | 2/2.0 (-1) | 1,537 (-3%) | 10mo | $450,000 | $293 | 66 |
| 8661 NW 24th Ct | 0.07mi | 4/2.0 (+1) | 1,768 (+12%) | 8mo | $555,000 | $314 | 65 |
| 9041 NW 24th Pl | 0.27mi | 3/2.0 | 1,360 (-14%) | 4mo | $437,000 | $321 | 61 |
| 8381 NW 28th Pl | 0.57mi | 2/2.0 (-1) | 1,520 (-4%) | 2mo | $380,000 | $250 | 60 |
| 8699 NW 26th Pl | 0.29mi | 4/2.0 (+1) | 1,768 (+12%) | 2mo | $549,000 | $311 | 60 |
| 2171 NW 93rd Ln | 0.56mi | 3/2.0 | 1,433 (-9%) | 6mo | $430,000 | $300 | 54 |
| 8390 NW 24th St | 0.34mi | 4/2.0 (+1) | 1,768 (+12%) | 10mo | $500,000 | $283 | 51 |
| 9362 NW 24th Pl | 0.52mi | 3/2.0 | 1,432 (-9%) | 11mo | $599,000 | $418 | 51 |
Match score weights: distance 35% · size 25% · config 20% · recency 20%. Top-matched comps best support the ARV.
Projected returns pro-forma
-3.0% appreciation · 0.6% rent growth · sell at horizon
- IRR
- -28.6%
- Equity multiple
- 0.07×
- Total profit
- $-128,221
- Equity at exit
- $73,031
- IRR
- -40.7%
- Equity multiple
- -0.43×
- Total profit
- $-195,914
- Equity at exit
- $42,349
Cash invested: $137,144 (down + closing). Projections, not guarantees.
Landlord ↔ Tenant lean methodology
- Overall (STATE)
- 87 Strongly Landlord-Friendly
- State Florida
- 87 Strongly Landlord-Friendly · R+3
- County
- — inherits STATE
- City
- — inherits STATE
ZIP-level market 33322
- Home prices YoY
- -33.3%
- Rents YoY
- 0.6%
- Active inventory
- 559
- Price-to-rent
- 0.1×
Monthly cashflow live
- Estimated rent
- $3,476 high interval (Pro) →
- Mortgage (P&I)
- −$2,569
- Tax est. 1.5%
- −$612 /mo · $7,347/yr
- Insurance
- −$204
- HOA
- −$0
- Vacancy / Maint / Mgmt
- −$730
- Net cashflow
- $-639
Break-even live
UW: 25.0% down · 7.5% · 30yr · 1.5% tax · 5.0% vac · 8.0% maint · 8.0% mgmt
Financing live
Cash to close
- Down payment
- $122,450
- Closing costs
- $14,694
- Reserves months
- —
- Total cash needed
- —
Loan-product check · same deal, 3 products live
Conventional
25% down · 7.5% · 30yr
- Down + closing
- —
- Monthly P&I
- —
- Monthly cashflow
- —
- DSCR
- —
- Eligible?
- —
Personal DTI + credit; lowest rate.
DSCR
20% down · 8.5% · 30yr
- Down + closing
- —
- Monthly P&I
- —
- Monthly cashflow
- —
- DSCR
- —
- Eligible?
- —
No personal income docs; deal must DSCR.
Hard money
10% down · 12.0% · 12mo
- Down + closing
- —
- Monthly P&I
- —
- Monthly cashflow
- —
- DSCR
- —
- Eligible?
- —
Short-term bridge; refi at stabilization.
Rent comps 40 comps
| Address | Beds | Baths | Sqft | Rent | $/sqft | DOM | Units | Dist |
|---|---|---|---|---|---|---|---|---|
| 8690 NW 24th Pl Sunrise, FL | 4.0 | 2.0 | 1360 | $4,000 | $2.94 | 24d | 1 | 0.07mi |
| 8421 NW 21st Ct Sunrise, FL | 3.0 | 2.0 | 1915 | $3,250 | $1.70 | 11d | 1 | 0.32mi |
| 8460 NW 21st St Sunrise, FL | 3.0 | 2.0 | 1520 | $4,000 | $2.63 | 22d | 1 | 0.34mi |
| 8460 NW 21st St Sunrise, FL | 3.0 | 2.0 | 1520 | $4,000 | $2.63 | 12d | 1 | 0.34mi |
| 8550 NW 27th Pl Unit 8550 Sunrise, FL | 2.0 | 2.0 | 1360 | $2,600 | $1.91 | 15d | 1 | 0.37mi |
| 2377 NW 83rd Ave Sunrise, FL | 4.0 | 2.5 | 2085 | $5,500 | $2.64 | 15d | 1 | 0.38mi |
| 8401 NW 20th Ct Sunrise, FL | 3.0 | 2.0 | 1580 | $4,000 | $2.53 | 8d | 1 | 0.39mi |
| 8401 NW 20th Ct Sunrise, FL | 3.0 | 2.0 | 1580 | $4,300 | $2.72 | 24d | 1 | 0.39mi |
| 9015 W Sunrise Blvd Plantation, FL | 3.0 | 3.0 | 1318 | $3,200 | $2.43 | 13d | 1 | 0.43mi |
| 2490 NW 83rd Ave Sunrise, FL | 4.0 | 2.0 | 1596 | $3,700 | $2.32 | 24d | 1 | 0.51mi |
| 9151 W Sunrise Blvd #9151 Plantation, FL | 3.0 | 2.0 | 1482 | $2,750 | $1.86 | 24d | 1 | 0.57mi |
| 8361 NW 28th Pl Sunrise, FL | 3.0 | 2.0 | 1360 | $3,200 | $2.35 | 4d | 1 | 0.58mi |
| 2631 NW 94th Ave Sunrise, FL | 2.0 | 2.0 | 1350 | $3,456 | $2.56 | 5d | 1 | 0.65mi |
| 9321 W Sunrise Blvd Plantation, FL | 2.0 | 2.0 | 1342 | $2,700 | $2.01 | 2d | 1 | 0.66mi |
| 9521 NW 25th St Sunrise, FL | 3.0 | 2.0 | 1616 | $2,965 | $1.83 | 8d | 1 | 0.67mi |
| 2650 NW 94th Way Sunrise, FL | 2.0 | 2.0 | 1200 | $2,900 | $2.42 | 2d | 1 | 0.68mi |
| 1711 N University Dr Plantation, FL | 1.0–3.0 | 1.0–2.0 | 986 | $3,252 | $3.30 | 2d | 41 | 0.72mi |
| 9571 Sunset Strip Sunrise, FL | 3.0 | 2.0 | 1418 | $3,450 | $2.43 | 22d | 1 | 0.73mi |
| 9571 Sunset Strip Sunrise, FL | 3.0 | 2.0 | 1418 | $3,450 | $2.43 | 24d | 1 | 0.73mi |
| 9551 NW 19th Pl Fort Lauderdale, FL | 3.0 | 2.0 | 1577 | $3,700 | $2.35 | 22d | 1 | 0.74mi |
| 3100 N Pine Island Rd Sunrise, FL | 1.0–2.0 | 1.5–2.0 | 1002 | $2,300 | $2.29 | 24d | 2 | 0.78mi |
| 9650 NW 24th St Sunrise, FL | 3.0 | 2.0 | 1542 | $3,500 | $2.27 | 8d | 1 | 0.78mi |
| 9650 NW 24th St Sunrise, FL | 3.0 | 2.0 | 1542 | $3,500 | $2.27 | 24d | 1 | 0.78mi |
| 3220 NW 84th Ave Sunrise, FL | 2.0 | 2.0 | 1115 | $2,150 | $1.93 | 24d | 1 | 0.84mi |
| 8085 NW 21st St Sunrise, FL | 3.0 | 2.0 | 1548 | $4,200 | $2.71 | 24d | 1 | 0.88mi |
| 8030 Sunset Strip Sunrise, FL | 4.0 | 2.0 | 1537 | $2,650 | $1.72 | 8d | 1 | 0.89mi |
| 3244 NW 84th Ave Sunrise, FL | 2.0 | 2.0 | 1115 | $2,300 | $2.06 | 24d | 1 | 0.89mi |
| 2590 NW 98th Ave Sunrise, FL | 2.0 | 2.0 | 1247 | $3,000 | $2.41 | 2d | 1 | 0.91mi |
| 2590 NW 98th Ave Sunrise, FL | 2.0 | 2.0 | 1247 | $3,000 | $2.41 | 24d | 1 | 0.91mi |
| 3232 NW 84th Ave Sunrise, FL | 2.0 | 2.0 | 1115 | $2,000 | $1.79 | 24d | 1 | 0.91mi |
| 3200 NW 84th Ave Sunrise, FL | 2.0 | 2.0 | 1115 | $2,100 | $1.88 | 24d | 1 | 0.91mi |
| 8001 NW 21st St Unit 1258747P Sunrise, FL | 4.0 | 2.0 | 1689 | $10,136 | $6.00 | 22d | 1 | 0.94mi |
| 8101 NW 14th St Plantation, FL | 1.0–2.0 | 1.5–2.0 | 1123 | $2,619 | $2.33 | 2d | 11 | 0.95mi |
| 8536 NW 12th Ct Plantation, FL | 2.0 | 2.0 | 1138 | $2,625 | $2.31 | 17d | 1 | 0.96mi |
| 9831 NW 24th St Sunrise, FL | 3.0 | 2.5 | 1887 | $3,250 | $1.72 | 8d | 1 | 0.97mi |
| 9831 NW 24th St Unit 9831 Sunrise, FL | 3.0 | 2.5 | 1887 | $3,500 | $1.85 | 24d | 1 | 0.97mi |
| 9840 NW 19th Pl Sunrise, FL | 3.0 | 2.5 | 1727 | $3,395 | $1.97 | 24d | 1 | 1.01mi |
| 2440 NW 99th Way Sunrise, FL | 3.0 | 2.5 | 1887 | $3,495 | $1.85 | 17d | 1 | 1.01mi |
| 8601 NW 34th Pl Apt A102 Sunrise, FL | 2.0 | 2.0 | 1080 | $2,200 | $2.04 | 24d | 1 | 1.04mi |
| 7620 S Aragon Blvd Sunrise, FL | 3.0 | 2.0 | 1452 | $3,250 | $2.24 | 24d | 1 | 1.06mi |
Listing history 6 events
-
2026-06-18days on market $5,000 Active 7 DOM
-
2026-06-17days on market $5,000 Active 6 DOM
-
2026-06-16days on market $5,000 Active 5 DOM
-
2026-06-15days on market $5,000 Active 4 DOM
-
2026-06-13remarks 295-char remark
-
2026-06-13$5,000 Active 2 DOM
ⓘ Source: listings_history table (triggers on properties + properties_extension) + one-shot
backfill from property_details.listing_events for pre-trigger history.
Climate risk First Street
- Flood 1/10 Low FEMA zone X (shaded) · 0% chance over 30 yrs
- Wildfire 1/10 Low
- Heat 10/10 Extreme 7 d/yr ≥105°F today · 27 d/yr by 30 yrs out
- Wind 10/10 Extreme 99% chance of damaging wind over 30 yrs
- Air quality 3/10 Moderate 2 unhealthy d/yr today · 3 by 30 yrs out
Nearby sold comps map
Loading sold comps map…
Walkable amenities ~0.75 mi
Loading nearby amenities…
Taxation est. · year 1
- Rental income
- $41,707
- − Mortgage interest
- −$27,436
- − Property taxes
- −$7,347
- − Insurance
- −$2,449
- − Repairs & maintenance
- −$3,337
- − Management
- −$3,337
- − Depreciation
- −$14,249
- Taxable loss
- −$16,447
- Est. tax savings @ 24.0%
- +$3,947
- After-tax cash flow
- $-3,723/yr
For passive investors: Depreciation is non-cash, so a rental often shows a tax loss while cash-flowing — sheltering income. Rental losses are passive: they offset passive income freely, and up to $25,000/yr can offset ordinary (W-2) income if you actively participate and your MAGI is under $100k (phasing out to $0 by $150k); unused losses carry forward. On sale, claimed depreciation is recaptured at up to 25%, and gains may owe capital-gains tax (a 1031 exchange can defer both). Figures are a year-1 estimate at your 24.0% rate — not tax advice; consult a CPA.
Schools (NCES district)
- District
- Broward
- NCES district ID
- 1200180
- Math proficiency
- 42% ▼ -18.00%
- Reading proficiency
- 53% ▼ -5.00%
- Median HH income
- $52,139
- Composite
- 40.88/100
- National rank
- #3621
- State rank
- #46 of 73 in FL
Livability — Sunrise
- Score
- 83/100
- State rank
- #56
- US rank
- #986
Category grades
Schools grade is shown separately in the Schools card above.
Census & demographics
- Census place
- Sunrise, FL
- County
- Broward County · 1,963,430 people
- City population
- 77,492
- Metro
- Miami-Fort Lauderdale-Pompano Beach, FL
- Population (ZIP)
- 41,128
- Household income
- $71,755
- Rent vs Own
- Severe rent burden
- 931.0
Population outlook (Broward County) Hauer SSP2
- Today (2025)
- 2,207,033 people
- By 2030
- 2,360,704 · +7.0%
- By 2040
- 2,661,208 · +20.6%
- By 2050
- 2,946,698 · +33.5%
- By 2075
- 3,602,273 · +63.2%
- By 2100
- 3,970,984 · +79.9%
Race, ethnicity, and origin ACS 2023
- Neighborhood character
- Highly diverse neighborhood (Simpson 0.72)
- Race & ethnicity
- Hispanic / Latino 35% White 32% Black 24% Two or more races 22% Asian 4%
- Hispanic origin (detail)
- Puerto Rican 5% Cuban 6% Dominican 2% Salvadoran 1%
- Common ancestry
- Hispanic 5% Romanian 2% Scotch-Irish 2%
- Foreign-born
- 41% · Canada, Jamaica, South Korea
- Languages at home
- 58% English-only · Spanish 30% French/Haitian/Cajun 6% Other Indo-European 1%
Political lean MEDSL · Broward
- 2024 margin
- D (+17.0) · D 58.0% · R 41.0%
- 2008→2024 swing
- -17.8pp toward R · 2008: 34.7pp · 2024: 17.0pp
- All cycles
- 2024: D+17.0 2020: D+29.8 2016: D+35.0 2012: D+34.9 2008: D+34.7
Not yet ingested
- Civics
- —
Market trends
- HPI YoY
- ▼ -203.34%
- Current HPI
- 407.5452
- Rent YoY
- ▲ 0.60%
- Metro
- Miami-Fort Lauderdale-Pompano Beach, FL
- State GDP YoY
- ▲ 3.28%
- F500 in state
- 36
Industry mix (Fortune 500 HQ in FL)
| Industry | F500 HQs | Revenue |
|---|---|---|
| Industrial Technology | 2 | $29B |
|
||
| Insurance | 2 | $17B |
|
||
| Retail | 1 | $60B |
|
||
| Technology Distribution | 1 | $58B |
|
||
| Homebuilding | 1 | $35B |
|
||
| Technology Manufacturing | 1 | $35B |
|
||
Price history
-94.2% since first listed4 events — show timeline
- 2026-06-11 Listed $5,000 HAOR as distributed by MLS GRID
- 1999-01-29 Sold (Public Records) $121,500 Public Records
- 1984-07-01 Sold (Public Records) $85,000 Public Records
- 1980-12-01 Sold (Public Records) $86,500 Public Records
Property tax history
+2.8%/yrLatest (2025): $2,478 · +4.1% YoY. Source: county tax records.
Cash-flow waterfall
monthlySold comps — $/sqft
last 12 mo · ≤1 miLoading sold comps…