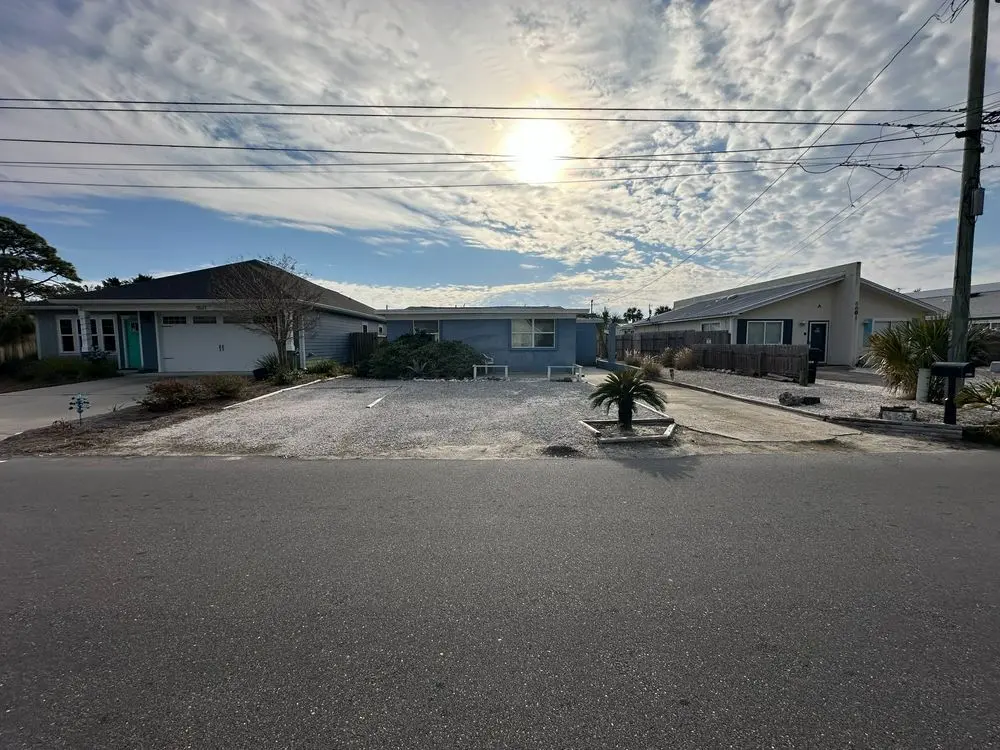
5525 Pinetree Ave · Lower Grand Lagoon, FL
Flood risk 6/10 · Moderate
- FEMA flood zone
- X (unshaded)
- Chance of flooding over 30 yrs
- 0.72%
- Est. flood insurance / yr
- $507 – $1,088
Fire risk 1/10 · Minimal
- Est. fire insurance / yr
- $947 – $1,759
Heat risk 10/10 · Severe
- Hot days now (above 106°F)
- 7 days/yr
- Hot days in 30 yrs
- 21 days/yr
Wind risk 9/10 · Severe
- Chance of severe wind over 30 yrs
- 99.0%
Air-quality risk 1/10 · Minimal
- Unhealthy air days now
- 0 days/yr
- Unhealthy air days in 30 yrs
- 0 days/yr
Risk factors via First Street. Map © Google.
Why this score? — see what drove the C- grade
The composite is a weighted blend of 9 inputs, each scored 0–100. Each bar is that input's sub-score; the figure is the points it added to the 100-point composite (weight × sub-score).
- Cash flow +15.4/30.0
- ARV discount +15.0/15.0
- DSCR +4.7/10.0
- Schools +4.3/10.0
- Livability +3.4/5.0
- Rent growth +3.1/5.0
- 1% rule +3.0/10.0
- Condition / age +2.5/5.0
- Appreciation +0.0/10.0
$225,000
🖨 Deal sheet (PDF) 📄 Offer letter ✓ Due diligence
Listing remarks MLS
The potential here is undeniable for the right buyer. This house is a renovation opportunity. Two blocks from the lagoon, three blocks from Beach access 12.
Key facts
- 5,968 sq ft lot
- Built 1954
- Listed 140 days
Tags
Neighborhood map
What this means for you Summary
Snapshot
- This is a 3-bed/1.0-bath single-family listed at $225k.
Deal economics
- At list price, monthly cash flow is $86 ($1k/yr) — positive.
- The deal already cash-flows at list — no discount required.
- To meet the 1% rule (rent ≥ 1% of price), the offer needs to be $180k (19.9% below list).
- Recommended offer: $180k (19.9% below list) — sets the bar for 1% rule.
- Cap rate 6.8% vs local median 2.1% in Lower Grand Lagoon — top-decile yield for the area; either an underpriced asset or a hidden risk that comps aren't pricing in. Stress-test before assuming the spread holds.
Location & tenants
- Location reads 68/100 on livability (#518 in FL) — a middle-class / working-renter tenant base. Strengths: crime A+, housing A+, employment B; Watch: amenities F, commute F, health & safety F.
- Bay (suburban): math 51% / reading 51% proficiency, ranked #29 of 73 in FL (top 40%) — acceptable for families but not a draw, mixed tenant base, ~2y average lease.
- Zoned schools: Patronis Elementary School (math 70% / reading 70%, grade A-, #345 of 2,144 statewide, top 17%, 648 students, 42% FRL); Surfside Middle School (math 58% / reading 59%, grade B, #148 of 571 statewide, top 26%, 843 students, 48% FRL); J.R. Arnold High School (math 41% / reading 54%, grade D, #204 of 667 statewide, top 31%, 1,617 students, 36% FRL).
- Market conditions: Rents rising (+2.5%/yr); 1032 active listings in the ZIP; 10 comparable units currently listed for rent nearby; rentals at typical pace (median 23d on market — plan ~3-4 weeks tenant-placement turnaround); solid renter incomes; 2,473 units permitted in Bay County in 2024 (559 in 5+ unit buildings).
Forward outlook
- Local home prices are declining (-3.0%/yr); year-one equity from $2k of loan paydown is wiped out by about $7k of value loss. Plan a longer hold.
- Bay County population projected at +24% by 2050 — long-run rental-demand tailwind backs the buy-and-hold thesis.
Negotiation context
- It's been on market 140 days — a 12% lower offer ($198k) is reasonable based on typical stale-listing flexibility.
- 2 sale attempts since 27y ago with the ask held roughly flat each time — persistent listings suggest the price (not the market) is what's stuck; bring a comps-based counter.
Risks & watch-outs
- Watch-outs: built in 1954 — expect roof / HVAC / electrical / plumbing capex.
- Climate carrying-cost: major flood risk; severe wind risk, 99% chance of damaging wind over 30y; extreme-heat days projected 7→21/yr by 2055 (HVAC capex compounding) — expect insurance premiums to compound above CPI over the hold.
Questions for the listing agent
- It's been on market 140 days. Have you received any prior offers? Is the seller open to a 20% concession, seller financing, or rate buy-down credit?
- Built in 1954 — when were the roof, HVAC, electrical panel, plumbing, and water heater last replaced?
- Why hasn't it sold? Are there any deal-killer items the seller is aware of (foundation, flood, title, zoning, code violations)?
- Is there a deadline driving the sale (1031 exchange, divorce, estate, relocation)? That informs how much negotiation room exists.
- Schools are D-rated, which usually means shorter tenancies and higher turnover. Who's the typical renter profile here, and what's been the actual vacancy rate?
- What's the average days-on-market for RENTAL listings here right now (not sales)? A rising rental-DOM trend means longer vacancies and softer asking-rent achievability than the comps imply.
- What's the recent tenant-quality profile in this submarket — average credit score on applications, eviction rate, late-payment / NSF rate, and stable-employment percentage? A property-management company in the area should have these aggregated.
- How much new for-sale + rental construction is in the pipeline within 1–3 miles? Heavy new supply typically softens prices + rents 12–24 months out; constrained supply supports both.
Investment metrics
- 1% rule
- 0.80% ✗
- Cap rate
- 6.75%
- Cash-on-cash
- 1.64%
- DSCR
- 1.07
- GRM
- 10.4
CMA / ARV
- ARV (median comp)
- $331,578
- List price
- $225,000
- Delta
- -32.14%
- Verdict
- UNDERPRICED
- Comps
- 20 within 1.0 mi
Show comp detail 12 sales within ~0.75 mi
| Address | Dist | Beds/Ba | Sqft | Sold | Price | $/sf | Match |
|---|---|---|---|---|---|---|---|
| 5910 Pinetree Ave | 0.29mi | 2/2.0 (-1) | 936 (+4%) | 7mo | $270,000 | $288 | 65 |
| 5020 Beach Dr | 0.46mi | 2/2.0 (-1) | 936 (+4%) | 3mo | $390,000 | $417 | 60 |
| 5727 Hilltop Ave | 0.18mi | 3/2.0 | 988 (+10%) | 14mo | $395,000 | $400 | 60 |
| 6016 Sunset Ave | 0.41mi | 2/1.0 (-1) | 965 (+7%) | 8mo | $393,000 | $407 | 57 |
| 3917 Oriole St | 0.37mi | 2/1.0 (-1) | 966 (+7%) | 15mo | $312,500 | $323 | 53 |
| 599 Seabreeze Dr | 0.67mi | 3/2.0 | 947 (+5%) | 8mo | $530,000 | $560 | 50 |
| 3807 Mystic St | 0.13mi | 2/2.0 (-1) | 1,030 (+14%) | 14mo | $225,000 | $218 | 49 |
| 6121 Orange Plz | 0.64mi | 2/2.0 (-1) | 936 (+4%) | 11mo | $209,900 | $224 | 46 |
| 2603 Cypress St | 0.72mi | 2/2.0 (-1) | 954 (+6%) | 4mo | $292,500 | $307 | 45 |
| 344 Amberjack Dr | 0.72mi | 2/2.0 (-1) | 840 (-7%) | 13mo | $490,000 | $583 | 36 |
| 3924 Treasure Cir | 0.47mi | 2/2.0 (-1) | 1,009 (+12%) | 20mo | $205,000 | $203 | 32 |
| 6220 Sunset Ave | 0.55mi | 2/2.0 (-1) | 1,026 (+14%) | 20mo | $455,000 | $443 | 26 |
Match score weights: distance 35% · size 25% · config 20% · recency 20%. Top-matched comps best support the ARV.
Projected returns pro-forma
-3.0% appreciation · 2.55% rent growth · sell at horizon
- IRR
- -14.2%
- Equity multiple
- 0.49×
- Total profit
- $-31,885
- Equity at exit
- $33,548
- IRR
- -6.1%
- Equity multiple
- 0.61×
- Total profit
- $-24,426
- Equity at exit
- $19,454
Cash invested: $63,000 (down + closing). Projections, not guarantees.
Landlord ↔ Tenant lean methodology
- Overall (STATE)
- 87 Strongly Landlord-Friendly
- State Florida
- 87 Strongly Landlord-Friendly · R+3
- County
- — inherits STATE
- City
- — inherits STATE
ZIP-level market 32408
- Rents YoY
- 2.5%
- Active inventory
- 1032
- Price-to-rent
- 10.4×
Monthly cashflow live
- Estimated rent
- $1,802 high interval (Pro) →
- Mortgage (P&I)
- −$1,180
- Tax from tax record
- −$63 /mo · $760/yr
- Insurance
- −$94
- HOA
- −$0
- Vacancy / Maint / Mgmt
- −$378
- Net cashflow
- $86
Break-even live
Sensitivity live
| Price | -10% $214 | -5% $150 | +0% $86 | +5% $23 | +10% $-41 |
|---|---|---|---|---|---|
| Rent | -10% $-56 | -5% $15 | +0% $86 | +5% $157 | +10% $229 |
| Rate | -1.0pp $200 | -0.5pp $143 | base $86 | +0.5pp $28 | +1.0pp $-31 |
UW: 25.0% down · 7.5% · 30yr · 1.5% tax · 5.0% vac · 8.0% maint · 8.0% mgmt
Financing live
Cash to close
- Down payment
- $56,250
- Closing costs
- $6,750
- Reserves months
- —
- Total cash needed
- —
Loan-product check · same deal, 3 products live
Conventional
25% down · 7.5% · 30yr
- Down + closing
- —
- Monthly P&I
- —
- Monthly cashflow
- —
- DSCR
- —
- Eligible?
- —
Personal DTI + credit; lowest rate.
DSCR
20% down · 8.5% · 30yr
- Down + closing
- —
- Monthly P&I
- —
- Monthly cashflow
- —
- DSCR
- —
- Eligible?
- —
No personal income docs; deal must DSCR.
Hard money
10% down · 12.0% · 12mo
- Down + closing
- —
- Monthly P&I
- —
- Monthly cashflow
- —
- DSCR
- —
- Eligible?
- —
Short-term bridge; refi at stabilization.
Rent comps 10 comps
| Address | Beds | Baths | Sqft | Rent | $/sqft | DOM | Units | Dist |
|---|---|---|---|---|---|---|---|---|
| 5710 Sunset Ave Unit 1523314P Panama City Beach, FL | 2.0 | 2.0 | 1087 | $8,246 | $7.59 | 22d | 1 | 0.13mi |
| 5409 Hilltop Ave Panama City, FL | 2.0 | 1.0 | 800 | $1,300 | $1.62 | 22d | 1 | 0.14mi |
| 5931 Pinetree Ave Panama City, FL | 2.0 | 1.0 | 900 | $1,600 | $1.78 | 22d | 1 | 0.34mi |
| 5111 Flint Ave Panama City, FL | 2.0 | 1.5 | 1020 | $1,350 | $1.32 | 22d | 1 | 0.40mi |
| 5104 Gulf Dr Unit B Panama City Beach, FL | 2.0 | 2.0 | 900 | $1,850 | $2.06 | 22d | 1 | 0.45mi |
| 6427 Sunset Ave Unit 2 Panama City, FL | 2.0 | 1.0 | 900 | $1,225 | $1.36 | 22d | 1 | 0.74mi |
| 7205 Thomas Dr Unit 1354970P Panama City Beach, FL | 2.0 | 2.0 | 1044 | $3,227 | $3.09 | 22d | 1 | 1.35mi |
| 7813 N Lagoon Dr Panama City, FL | 2.0 | 2.0 | 1060 | $1,900 | $1.79 | 22d | 1 | 1.37mi |
| 2103 Bent Oak Ct Panama City, FL | 3.0 | 2.0 | 1000 | $1,800 | $1.80 | 22d | 1 | 1.38mi |
| 447 Water Oak Cir Panama City, FL | 2.0 | 2.0 | 980 | $1,800 | $1.84 | 22d | 1 | 1.44mi |
Listing history 25 events
-
2026-06-21days on market $225,000 Active 140 DOM
-
2026-06-19days on market $225,000 Active 138 DOM
-
2026-06-18days on market $225,000 Active 137 DOM
-
2026-06-17days on market $225,000 Active 136 DOM
-
2026-06-16days on market $225,000 Active 135 DOM
-
2026-06-15days on market $225,000 Active 134 DOM
-
2026-06-14days on market $225,000 Active 132 DOM
-
2026-06-13days on market $225,000 Active 131 DOM
-
2026-06-10days on market $225,000 Active 129 DOM
-
2026-06-09days on market $225,000 Active 128 DOM
-
2026-06-08days on market $225,000 Active 127 DOM
-
2026-06-07days on market $225,000 Active 126 DOM
-
2026-06-05days on market $225,000 Active 123 DOM
-
2026-06-03days on market $225,000 Active 122 DOM
-
2026-06-02days on market $225,000 Active 121 DOM
-
2026-06-01days on market $225,000 Active 120 DOM
-
2026-05-31days on market $225,000 Active 119 DOM
-
2026-05-30days on market $225,000 Active 118 DOM
-
2026-03-06soldstatus $220,000
-
2026-02-05soldstatus $150,000
-
2026-02-01$225,000 Active 156-char remark
Show marketing remark (156 chars)
The potential here is undeniable for the right buyer. This house is a renovation opportunity. Two blocks from the lagoon, three blocks from Beach access 12.
-
2017-07-24soldstatus $102,000
-
2000-05-17soldstatus $65,000
-
2000-05-15soldstatus $65,000 205-char remark
Show marketing remark (205 chars)
Walking distance to both the beach and the lagoon. Cute beach cottage with lots of potential. New roof 1 year ago, new A/C 6 months ago, new hot water heater, 1 year ago. Seller Licensed real estate agent.
-
1999-12-22$65,000 205-char remark
Show marketing remark (205 chars)
Walking distance to both the beach and the lagoon. Cute beach cottage with lots of potential. New roof 1 year ago, new A/C 6 months ago, new hot water heater, 1 year ago. Seller Licensed real estate agent.
ⓘ Source: listings_history table (triggers on properties + properties_extension) + one-shot
backfill from property_details.listing_events for pre-trigger history.
Tax reassessment forecast FL · Resets to sale price
- Current annual tax
- $760 · $63/mo
- Projected year-2 tax
- $1,868 · $156/mo
- Expected delta
- +$1,107/yr (+$92/mo · 145.7%)
ⓘ Screening estimate from a state-policy table — verify with the county assessor before closing.
Climate risk First Street
- Flood 6/10 Major FEMA zone X (unshaded) · 72% chance over 30 yrs
- Wildfire 1/10 Low
- Heat 10/10 Extreme 7 d/yr ≥106°F today · 21 d/yr by 30 yrs out
- Wind 9/10 Extreme 99% chance of damaging wind over 30 yrs
- Air quality 1/10 Low 0 unhealthy d/yr today · 0 by 30 yrs out
Nearby sold comps map
Loading sold comps map…
Walkable amenities ~0.75 mi
Loading nearby amenities…
Taxation est. · year 1
- Rental income
- $21,619
- − Mortgage interest
- −$12,603
- − Property taxes
- −$760
- − Insurance
- −$1,125
- − Repairs & maintenance
- −$1,730
- − Management
- −$1,730
- − Depreciation
- −$6,545
- Taxable loss
- −$2,874
- Est. tax savings @ 24.0%
- +$690
- After-tax cash flow
- $1,725/yr
For passive investors: Depreciation is non-cash, so a rental often shows a tax loss while cash-flowing — sheltering income. Rental losses are passive: they offset passive income freely, and up to $25,000/yr can offset ordinary (W-2) income if you actively participate and your MAGI is under $100k (phasing out to $0 by $150k); unused losses carry forward. On sale, claimed depreciation is recaptured at up to 25%, and gains may owe capital-gains tax (a 1031 exchange can defer both). Figures are a year-1 estimate at your 24.0% rate — not tax advice; consult a CPA.
Schools (NCES district)
- District
- Bay
- NCES district ID
- 1200090
- Math proficiency
- 51% ▼ -8.00%
- Reading proficiency
- 51% ▼ -7.00%
- Median HH income
- $47,740
- Composite
- 43.41/100
- National rank
- #3014
- State rank
- #29 of 73 in FL
Livability — Lower Grand Lagoon
- Score
- 68/100
- State rank
- #518
- US rank
- #9567
Category grades
Schools grade is shown separately in the Schools card above.
Census & demographics
- Census place
- Lower Grand Lagoon, FL
- County
- Bay County · 163,593 people
- Metro
- Panama City, FL
- Population (ZIP)
- 18,832
- Household income
- $80,822
- Rent vs Own
- Severe rent burden
- 817.0
Population outlook (Bay County) Hauer SSP2
- Today (2025)
- 206,264 people
- By 2030
- 217,740 · +5.6%
- By 2040
- 238,738 · +15.7%
- By 2050
- 255,545 · +23.9%
- By 2075
- 288,295 · +39.8%
- By 2100
- 288,638 · +39.9%
Race, ethnicity, and origin ACS 2023
- Neighborhood character
- Predominantly White (81%)
- Race & ethnicity
- White 81% Hispanic / Latino 7% Two or more races 6% Black 3% Asian 2%
- Hispanic origin (detail)
- Mexican 2% Puerto Rican 2%
- Common ancestry
- Romanian 4% Lithuanian 4% Italian 2%
- Foreign-born
- 11% · Canada, South Korea
- Languages at home
- 88% English-only · Spanish 5% Russian/Polish/Slavic 4% Tagalog/Filipino 1%
Political lean MEDSL · Bay
- 2024 margin
- Solid R (+47.4) · D 25.8% · R 73.1% · Other 1.1%
- 2008→2024 swing
- -6.6pp toward R · 2008: -40.7pp · 2024: -47.4pp
- All cycles
- 2024: R+47.4 2020: R+43.5 2016: R+46.3 2012: R+43.6 2008: R+40.7
Not yet ingested
- Civics
- —
Market trends
- HPI YoY
- ▼ -202.52%
- Current HPI
- 246.9126
- Rent YoY
- ▲ 2.55%
- Metro
- Panama City, FL
- State GDP YoY
- ▲ 3.28%
- F500 in state
- 36
Industry mix (Fortune 500 HQ in FL)
| Industry | F500 HQs | Revenue |
|---|---|---|
| Industrial Technology | 2 | $29B |
|
||
| Insurance | 2 | $17B |
|
||
| Retail | 1 | $60B |
|
||
| Technology Distribution | 1 | $58B |
|
||
| Homebuilding | 1 | $35B |
|
||
| Technology Manufacturing | 1 | $35B |
|
||
Price history
+238.5% since first listed7 events — show timeline
- 2026-03-06 Sold (Public Records) $220,000 Public Records
- 2026-02-05 Sold (Public Records) $150,000 Public Records
- 2026-02-01 Listed $225,000 ForSaleByOwner.com
- 2017-07-24 Sold (Public Records) $102,000 Public Records
- 2000-05-17 Sold (Public Records) $65,000 Public Records
- 2000-05-15 Sold (MLS) $65,000 CPARMLS
- 1999-12-22 Listed $65,000 CPARMLS
Property tax history
+3.6%/yrLatest (2025): $760 · +4.3% YoY. Source: county tax records.
Cash-flow waterfall
monthlySold comps — $/sqft
last 12 mo · ≤1 miLoading sold comps…