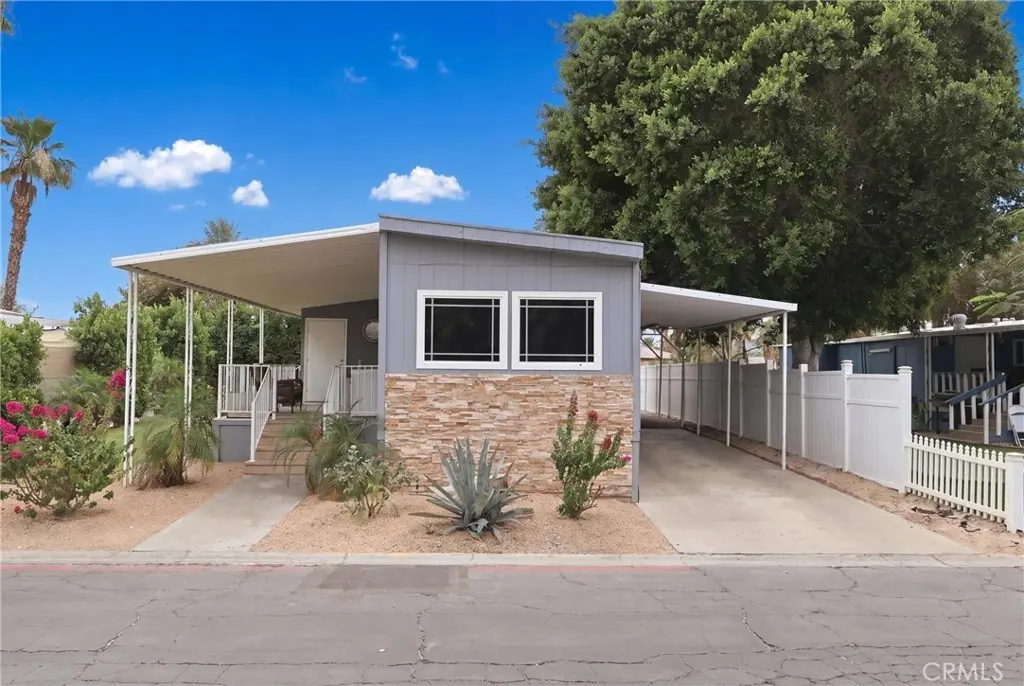
80000 Avenue 48 #6 · Indio, CA
Flood risk 1/10 · Minimal
- FEMA flood zone
- X (shaded)
- Chance of flooding over 30 yrs
- 0.0%
- Est. flood insurance / yr
- $507 – $1,088
Fire risk 3/10 · Minor
- Est. fire insurance / yr
- $659 – $1,223
Heat risk 10/10 · Severe
- Hot days now (above 114°F)
- 7 days/yr
- Hot days in 30 yrs
- 18 days/yr
Wind risk 1/10 · Minimal
- Chance of severe wind over 30 yrs
- —
Air-quality risk 4/10 · Minor
- Unhealthy air days now
- 4 days/yr
- Unhealthy air days in 30 yrs
- 5 days/yr
Risk factors via First Street. Map © Google.
Why this score? — see what drove the B- grade
The composite is a weighted blend of 9 inputs, each scored 0–100. Each bar is that input's sub-score; the figure is the points it added to the 100-point composite (weight × sub-score).
- Cash flow +30.0/30.0
- DSCR +10.0/10.0
- 1% rule +7.7/10.0
- ARV discount +7.5/15.0
- Schools +3.8/10.0
- Rent growth +3.3/5.0
- Livability +2.7/5.0
- Condition / age +2.5/5.0
- Appreciation +0.0/10.0
$165,000
🖨 Deal sheet 📄 Offer letter ✓ Due diligence
Listing remarks
Welcome home to this charming residence located in the desirable Las Palmas de la Quinta Mobile Home Park. Featuring 960 sq ft of comfortable living space, this home features 2 bedrooms and 2 bathrooms with a comfortable and functional layout perfect for everyday living. As you step onto the front porch and enter the home, you’re welcomed by a brightly lit living room that flows seamlessly into the dining area and kitchen, creating an open and inviting space. Down the hallway, you’ll find a cozy family room, ideal for relaxing or entertaining. Across from it is a conveniently located bathroom, followed by the primary bedroom with its own private bathroom. The second bedroom offe
Key facts
- Front porch
- Cozy family room
- Private bathroom
Tags
Property features AI
Finance
- Other: Living area per assessor's data; Park name: Las Palmas de la Quinta
- HOA & community: Land lease community (Las Palmas de la Quinta); Monthly land lease: $1,300; Manager approval required
Exterior
- Parking: Carport; 1 parking space; 1 garage space
- Utilities: Natural gas connected; Electricity connected; Water connected (District/Public); Public sewer
- Home design: Single-story mobile home (double wide); Mobile home remains on site; Entry at ground level
- Construction: Mobile home (12' x 56'); Total of 1 story; Year built source: public records
- Exterior features: Covered front porch; Community pool; Brick wall fencing; Paved road frontage; Suburban neighborhood with curbs, sidewalks and street lighting; Has a view
Interior
- Kitchen: Gas cooktop
- Bedrooms: Primary bedroom; All bedrooms on the main level
- Bathrooms: 2 full bathrooms; Walk-in shower; Bathtub
- Heating & cooling: Central furnace heating; Central cooling
- Interior features: Ceiling fan; One-level living, ground-level entry
- Laundry & utility: No laundry hookups on record
Neighborhood map
What this means for you Summary
Snapshot
- This is a 2-bed/1.0-bath manufactured listed at $165k.
Deal economics
- At list price, monthly cash flow is $684 ($8k/yr) — positive.
- The deal already cash-flows at list — no discount required.
- Meets the 1% rule at list price ($2k rent vs $165k).
- Recommended offer: $160k (3.0% below list) — sets the bar for market timing.
- Cap rate 11.3% vs local median 4.3% in Indio — top-decile yield for the area; either an underpriced asset or a hidden risk that comps aren't pricing in. Stress-test before assuming the spread holds.
Location & tenants
- Location reads 53/100 on livability (#927 in CA) — a working-class tenant base; expect higher turnover. Strengths: housing B+; Watch: employment D, crime F, amenities F.
- Desert Sands Unified (suburban): math 31% / reading 56% proficiency, ranked #199 of 517 in CA (top 38%) — families likely to look elsewhere, expect single-tenant / working-renter base with shorter leases.
- Zoned schools: La Quinta Middle (math 24% / reading 24%, grade F, #277 of 498 statewide, top 73%, 754 students, 83% FRL); Indio High (math 15% / reading 42%, grade F, #774 of 1,170 statewide, top 66%, 2,143 students, 92% FRL) — zoned schools average 87% FRL vs 56% district-wide (31 pts higher); higher-poverty schools than district average — tighter screening recommended.
- Zoned-school proficiency averages 26% at this address vs 44% district-wide (-17 pts) — the specific schools serving this property underperform the Desert Sands Unified average; the district grade overstates school quality for this exact location.
- Market conditions: Rents rising (+3.3%/yr); 514 active listings in the ZIP; 5 comparable units currently listed for rent nearby; rentals at typical pace (median 15d on market — plan ~3-4 weeks tenant-placement turnaround); 40% of comp listings sitting > 30 days — soft ceiling on asking rent; 9,195 units permitted in Riverside County in 2024 (1,512 in 5+ unit buildings).
- This rent runs 38% of the median local income ($67k/yr) — at the standard rent-burdened threshold; future hikes will face affordability resistance.
Forward outlook
- Local home prices are declining (-3.0%/yr); year-one equity from $1k of loan paydown is wiped out by about $5k of value loss. Plan a longer hold.
- Riverside County population projected at +22% by 2050 — long-run rental-demand tailwind backs the buy-and-hold thesis.
- At projected returns (-3.0% appreciation + 3.3% rent growth), your $46k cash investment doubles in ~7 years — after that, you're playing with house money.
Negotiation context
- It's been on market 44 days — a 3% lower offer ($160k) is reasonable based on typical stale-listing flexibility.
- 7 sale attempts since 4y ago with the ask held roughly flat each time — persistent listings suggest the price (not the market) is what's stuck; bring a comps-based counter.
Risks & watch-outs
- Climate carrying-cost: extreme-heat days projected 7→18/yr by 2055 (HVAC capex compounding) — expect insurance premiums to compound above CPI over the hold.
Questions for the listing agent
- It's been on market 44 days. Have you received any prior offers? Is the seller open to a 3% concession, seller financing, or rate buy-down credit?
- Built in 1974 — when were the roof, HVAC, electrical panel, plumbing, and water heater last replaced?
- Is there a deadline driving the sale (1031 exchange, divorce, estate, relocation)? That informs how much negotiation room exists.
- Schools are F-rated, which usually means shorter tenancies and higher turnover. Who's the typical renter profile here, and what's been the actual vacancy rate?
- Crime grade is F in this area — have there been break-ins, vandalism, or insurance claims at this property in the last 3 years? What carrier currently insures it and at what premium?
- What's the average days-on-market for RENTAL listings here right now (not sales)? A rising rental-DOM trend means longer vacancies and softer asking-rent achievability than the comps imply.
- What's the recent tenant-quality profile in this submarket — average credit score on applications, eviction rate, late-payment / NSF rate, and stable-employment percentage? A property-management company in the area should have these aggregated.
- How much new for-sale + rental construction is in the pipeline within 1–3 miles? Heavy new supply typically softens prices + rents 12–24 months out; constrained supply supports both.
Investment metrics
- 1% rule
- 1.27% ✓
- Cap rate
- 11.27%
- Cash-on-cash
- 17.76%
- DSCR
- 1.79
- GRM
- 6.6
CMA / ARV
- ARV (median comp)
- $75,000
- List price
- $165,000
- Delta
- 120.00%
- Verdict
- OVERPRICED
- Comps
- 5 within 1.0 mi
Show comp detail 1 sale within ~0.75 mi
| Address | Dist | Beds/Ba | Sqft | Sold | Price | $/sf | Match |
|---|---|---|---|---|---|---|---|
| 80000 Ave 48 #291 | 0.00mi | 2/2.0 | 840 (-12%) | 6mo | $130,000 | $155 | 70 |
Match score weights: distance 35% · size 25% · config 20% · recency 20%. Top-matched comps best support the ARV.
Projected returns pro-forma
-3.0% appreciation · 3.34% rent growth · sell at horizon
- IRR
- 9.6%
- Equity multiple
- 1.38×
- Total profit
- $17,455
- Equity at exit
- $24,602
- IRR
- 18.9%
- Equity multiple
- 2.60×
- Total profit
- $73,953
- Equity at exit
- $14,266
Cash invested: $46,200 (down + closing). Projections, not guarantees.
Landlord ↔ Tenant lean methodology
- Overall (STATE)
- 18 Strongly Tenant-Friendly
- State California
- 18 Strongly Tenant-Friendly · D+13
- County
- — inherits STATE
- City
- — inherits STATE
ZIP-level market 92201
- Home prices YoY
- -28.4%
- Rents YoY
- 3.3%
- Active inventory
- 514
- Price-to-rent
- 6.6×
Monthly cashflow live
- Estimated rent
- $2,097 medium interval (Pro) →
- Mortgage (P&I)
- −$865
- Tax from tax record
- −$39 /mo · $465/yr
- Insurance
- −$69
- HOA
- −$0
- Vacancy / Maint / Mgmt
- −$440
- Net cashflow
- $684
Break-even live
UW: 25.0% down · 7.5% · 30yr · 1.5% tax · 5.0% vac · 8.0% maint · 8.0% mgmt
Financing live
Cash to close
- Down payment
- $41,250
- Closing costs
- $4,950
- Reserves months
- —
- Total cash needed
- —
Loan-product check · same deal, 3 products live
Conventional
25% down · 7.5% · 30yr
- Down + closing
- —
- Monthly P&I
- —
- Monthly cashflow
- —
- DSCR
- —
- Eligible?
- —
Personal DTI + credit; lowest rate.
DSCR
20% down · 8.5% · 30yr
- Down + closing
- —
- Monthly P&I
- —
- Monthly cashflow
- —
- DSCR
- —
- Eligible?
- —
No personal income docs; deal must DSCR.
Hard money
10% down · 12.0% · 12mo
- Down + closing
- —
- Monthly P&I
- —
- Monthly cashflow
- —
- DSCR
- —
- Eligible?
- —
Short-term bridge; refi at stabilization.
Rent comps 5 comps
| Address | Beds | Baths | Sqft | Rent | $/sqft | DOM | Units | Dist |
|---|---|---|---|---|---|---|---|---|
| 46896 Jefferson St Indio, CA | 2.0 | 2.0 | 1100 | $2,075 | $1.89 | 3d | 2 | 0.48mi |
| 47750 Adams St La Quinta, CA | 1.0–2.0 | 1.0–2.0 | 956 | $2,220 | $2.32 | 43d | 1 | 1.05mi |
| 80886 Avenue 50 Unit 2 Indio, CA | 2.0 | 1.0 | 729 | $4,000 | $5.49 | 14d | 1 | 1.19mi |
| 46725 Clinton St Indio, CA | 1.0–2.0 | 1.0–2.0 | 610 | $1,650 | $2.70 | 5d | 1 | 1.42mi |
| 46675 Desert Villa St Indio, CA | 2.0 | 1.0–1.5 | 881 | $1,590 | $1.80 | 43d | 1 | 1.48mi |
Listing history 26 events
-
2026-06-18days on market $165,000 Active 44 DOM
-
2026-06-17days on market $165,000 Active 43 DOM
-
2026-06-16days on market $165,000 Active 42 DOM
-
2026-06-15days on market $165,000 Active 41 DOM
-
2026-06-13days on market $165,000 Active 39 DOM
-
2026-06-09days on market $165,000 Active 35 DOM
-
2026-06-08days on market $165,000 Active 34 DOM
-
2026-06-07days on market $165,000 Active 33 DOM
-
2026-06-04days on market $165,000 Active 30 DOM
-
2026-06-03days on market $165,000 Active 29 DOM
-
2026-06-02days on market $165,000 Active 28 DOM
-
2026-06-01days on market $165,000 Active 27 DOM
-
2026-05-31days on market $165,000 Active 26 DOM
-
2026-05-05$165,000 Active 994-char remark
-
2026-04-16historical
-
2026-04-07$199,900 Active
-
2024-10-22$174,000 Active
-
2024-10-08historical
-
2024-04-09historical
-
2024-03-16status Active
-
2024-01-08$105,000 Active
-
2023-12-05historical
-
2023-06-05$165,000 Active
-
2022-03-25status Pending
-
2022-02-12price $80,000
-
2022-02-01$95,000 Active
ⓘ Source: listings_history table (triggers on properties + properties_extension) + one-shot
backfill from property_details.listing_events for pre-trigger history.
Tax reassessment forecast CA · Resets to sale price
- Current annual tax
- $465 · $39/mo
- Projected year-2 tax
- $1,254 · $104/mo
- Expected delta
- +$789/yr (+$66/mo · 169.8%)
ⓘ Screening estimate from a state-policy table — verify with the county assessor before closing.
Climate risk First Street
- Flood 1/10 Low FEMA zone X (shaded) · 0% chance over 30 yrs
- Wildfire 3/10 Moderate
- Heat 10/10 Extreme 7 d/yr ≥114°F today · 18 d/yr by 30 yrs out
- Wind 1/10 Low
- Air quality 4/10 Moderate 4 unhealthy d/yr today · 5 by 30 yrs out
Nearby sold comps map
Loading sold comps map…
Walkable amenities ~0.75 mi
Loading nearby amenities…
Taxation est. · year 1
- Rental income
- $25,161
- − Mortgage interest
- −$9,243
- − Property taxes
- −$465
- − Insurance
- −$825
- − Repairs & maintenance
- −$2,013
- − Management
- −$2,013
- − Depreciation
- −$4,800
- Taxable income
- $5,803
- Est. tax owed @ 24.0%
- −$1,393
- After-tax cash flow
- $6,811/yr
For passive investors: Depreciation is non-cash, so a rental often shows a tax loss while cash-flowing — sheltering income. Rental losses are passive: they offset passive income freely, and up to $25,000/yr can offset ordinary (W-2) income if you actively participate and your MAGI is under $100k (phasing out to $0 by $150k); unused losses carry forward. On sale, claimed depreciation is recaptured at up to 25%, and gains may owe capital-gains tax (a 1031 exchange can defer both). Figures are a year-1 estimate at your 24.0% rate — not tax advice; consult a CPA.
Schools (NCES district)
- District
- Desert Sands Unified
- NCES district ID
- 0611110
- Math proficiency
- 31% ▼ -4.00%
- Reading proficiency
- 56% ▲ 7.00%
- Median HH income
- $54,957
- Composite
- 37.77/100
- National rank
- #4346
- State rank
- #199 of 517 in CA
Livability — Indio
- Score
- 53/100
- State rank
- #927
- US rank
- #24244
Category grades
Schools grade is shown separately in the Schools card above.
Census & demographics
- Census place
- Indio, CA
- County
- Riverside County · 2,287,001 people
- City population
- 100,560
- Metro
- Riverside-San Bernardino-Ontario, CA
- Population (ZIP)
- 65,825
- Household income
- $66,758
- Rent vs Own
- Severe rent burden
- 2036.0
Population outlook (Riverside County) Hauer SSP2
- Today (2025)
- 2,664,475 people
- By 2030
- 2,802,692 · +5.2%
- By 2040
- 3,050,904 · +14.5%
- By 2050
- 3,256,783 · +22.2%
- By 2075
- 3,655,058 · +37.2%
- By 2100
- 3,766,594 · +41.4%
Race, ethnicity, and origin ACS 2023
- Neighborhood character
- Predominantly Hispanic (74%)
- Race & ethnicity
- Hispanic / Latino 74% Two or more races 39% White 19% Black 3% Asian 3% Native American 1%
- Hispanic origin (detail)
- Mexican 69%
- Common ancestry
- Romanian 1% Iranian 1%
- Foreign-born
- 29% · Canada, Vietnam, Jamaica
- Languages at home
- 41% English-only · Spanish 55% Arabic 1% Tagalog/Filipino 1%
Political lean MEDSL · Riverside
- 2024 margin
- Toss-up / Even · D 48.0% · R 49.3% · Other 2.6%
- 2008→2024 swing
- -3.6pp toward R · 2008: 2.3pp · 2024: -1.3pp
- All cycles
- 2024: R+1.3 2020: D+8.0 2016: D+4.3 2012: R+0.4 2008: D+2.3
Not yet ingested
- Civics
- —
Market trends
- HPI YoY
- ▼ -138.46%
- Current HPI
- 348.6605
- Rent YoY
- ▲ 3.34%
- Metro
- Riverside-San Bernardino-Ontario, CA
- State GDP YoY
- ▲ 3.21%
- F500 in state
- 116
Industry mix (Fortune 500 HQ in CA)
| Industry | F500 HQs | Revenue |
|---|---|---|
| Technology | 27 | $1,492B |
|
||
| Financial Services | 3 | $174B |
|
||
| Retail | 3 | $44B |
|
||
| Insurance | 3 | $26B |
|
||
| Media / Entertainment | 2 | $115B |
|
||
| Pharmaceuticals / Biotech | 2 | $62B |
|
||
Price history
+73.7% since first listed13 events — show timeline
- 2026-05-05 Listed $165,000 CRMLS
- 2026-04-16 Listing Removed — CRMLS
- 2026-04-07 Listed $199,900 CRMLS
- 2024-10-22 Listed $174,000 GPSMLS
- 2024-10-08 Coming Soon — GPSMLS
- 2024-04-09 Listing Removed — CRMLS
- 2024-03-16 Relisted — CRMLS
- 2024-01-08 Listed $105,000 CRMLS
- 2023-12-05 Listing Removed — CRMLS
- 2023-06-05 Listed $165,000 CRMLS
- 2022-03-25 Pending — GPSMLS
- 2022-02-12 Price Changed $80,000 GPSMLS
- 2022-02-01 Listed $95,000 GPSMLS
Property tax history
+6.1%/yrLatest (2025): $465 · -4.8% YoY. Source: county tax records.
Cash-flow waterfall
monthlySold comps — $/sqft
last 12 mo · ≤1 miLoading sold comps…