 🏗️ New Construction
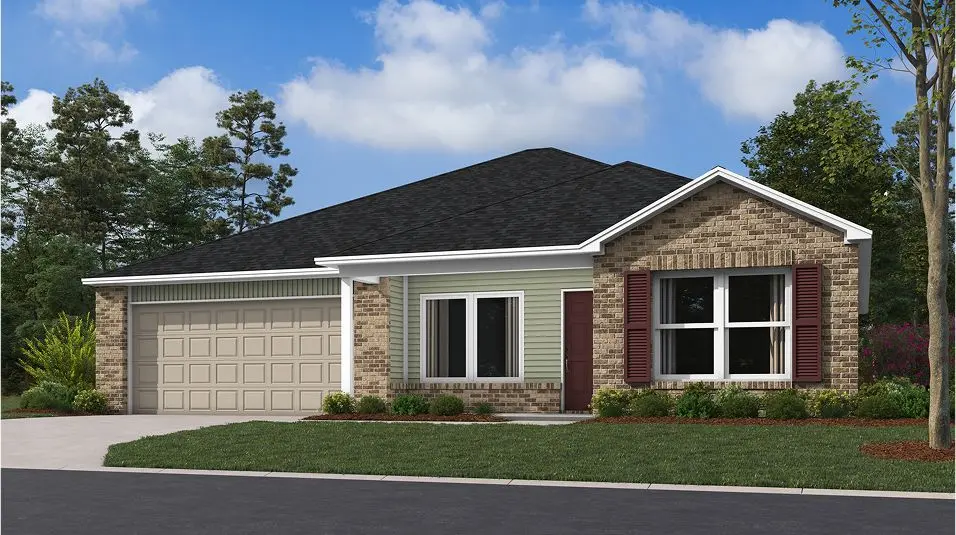
Rc Carnegie II Plan · Mayflower, AR
Flood risk No data
- FEMA flood zone
- —
- Chance of flooding over 30 yrs
- —
- Est. flood insurance / yr
- —
Fire risk No data
- Est. fire insurance / yr
- —
Heat risk No data
- Hot days now (above threshold)
- —
- Hot days in 30 yrs
- —
Wind risk No data
- Chance of severe wind over 30 yrs
- —
Air-quality risk No data
- Unhealthy air days now
- —
- Unhealthy air days in 30 yrs
- —
Risk factors via First Street. Map © Google.
Why this score? — see what drove the D grade
The composite is a weighted blend of 9 inputs, each scored 0–100. Each bar is that input's sub-score; the figure is the points it added to the 100-point composite (weight × sub-score).
- Appreciation +9.8/10.0
- Cash flow +7.8/30.0
- ARV discount +7.5/15.0
- Condition / age +4.0/5.0
- Schools +2.8/10.0
- Livability +2.8/5.0
- Rent growth +2.5/5.0
- 1% rule +2.3/10.0
- DSCR +1.9/10.0
$214,900
🖨 Deal sheet 📄 Offer letter ✓ Due diligence
Listing remarks MLS
This new single-story home is ready for modern lifestyles. An open-concept floorplan shared between the kitchen and living room encourages simple everyday transitions and multitasking. Three secondary bedrooms are tucked away to the side of the home, opposite from the luxurious owner's suite with a full bathroom and walk-in closet.
Key facts
- Full bathroom
- Walk-in closet
- Owner's suite
Tags
Neighborhood map
What this means for you Summary
Snapshot
- This is a 4-bed/2.0-bath single-family listed at $215k. Condition is rated good.
Deal economics
- At list price, monthly cash flow is $-268 ($-3k/yr) — negative.
- To cash-flow at today's rent, offer at most $200k (6.8% below list).
- To meet the 1% rule (rent ≥ 1% of price), the offer needs to be $175k (18.5% below list).
- Recommended offer: $175k (18.5% below list) — sets the bar for 1% rule.
Location & tenants
- Location reads 56/100 on livability (#390 in AR) — a working-class tenant base; expect higher turnover. Strengths: cost of living A+, housing B+; Watch: schools F, crime F, amenities F.
- Mayflower School District (rural): math 32% / reading 34% proficiency, ranked #127 of 238 in AR (top 53%) — families likely to look elsewhere, expect single-tenant / working-renter base with shorter leases.
- Market conditions: 110 active listings in the ZIP; 8 comparable units currently listed for rent nearby; rentals lingering (median 44d on market — plan ~5-8 weeks vacancy on turnover, expect pricing pressure); 50% of comp listings sitting > 30 days — soft ceiling on asking rent; 865 units permitted in Faulkner County in 2024 (451 in 5+ unit buildings).
Forward outlook
- In year one you build about $25k of equity ($2k loan paydown + $23k appreciation (9.6% local appreciation)).
- Faulkner County population projected at +32% by 2050 — long-run rental-demand tailwind backs the buy-and-hold thesis.
- By year 2, paydown + projected appreciation supports a ~$40k cash-out refi (75% LTV) — recoverable capital for the next deal without selling this one.
Negotiation context
- It's been on market 57 days — a 3% lower offer ($208k) is reasonable based on typical stale-listing flexibility.
Questions for the listing agent
- What do current leases actually rent for vs. the listed asking? Can we see a recent rent roll and the last 12 months of T-12 income?
- It's been on market 57 days. Have you received any prior offers? Is the seller open to a 18% concession, seller financing, or rate buy-down credit?
- Is there a deadline driving the sale (1031 exchange, divorce, estate, relocation)? That informs how much negotiation room exists.
- Schools are F-rated, which usually means shorter tenancies and higher turnover. Who's the typical renter profile here, and what's been the actual vacancy rate?
- Crime grade is F in this area — have there been break-ins, vandalism, or insurance claims at this property in the last 3 years? What carrier currently insures it and at what premium?
- The area grade is low — what's the realistic commute time and amenity access for the typical tenant pool here? Any planned neighborhood developments (good or bad) we should know about?
- What's the average days-on-market for RENTAL listings here right now (not sales)? A rising rental-DOM trend means longer vacancies and softer asking-rent achievability than the comps imply.
- What's the recent tenant-quality profile in this submarket — average credit score on applications, eviction rate, late-payment / NSF rate, and stable-employment percentage? A property-management company in the area should have these aggregated.
- How much new for-sale + rental construction is in the pipeline within 1–3 miles? Heavy new supply typically softens prices + rents 12–24 months out; constrained supply supports both.
Investment metrics
- 1% rule
- 0.73% ✗
- Cap rate
- 4.95%
- Cash-on-cash
- -4.80%
- DSCR
- 0.79
- GRM
- 11.4
CMA / ARV
- ARV (median comp)
- $239,062
- List price
- $214,900
- Delta
- -10.11%
- Verdict
- UNDERPRICED
- Comps
- 20 within 1.0 mi
Show comp detail 12 sales within ~0.75 mi
| Address | Dist | Beds/Ba | Sqft | Sold | Price | $/sf | Match |
|---|---|---|---|---|---|---|---|
| 13 Vineyard Dr | 0.06mi | 4/2.0 | 1,476 (+0%) | 2mo | $196,000 | $133 | 95 |
| 16 E Reliance Ct | 0.01mi | 3/2.0 (-1) | 1,472 (+0%) | 0mo | $222,900 | $151 | 94 |
| 13 E Reliance Ct | 0.04mi | 3/2.0 (-1) | 1,472 (+0%) | 0mo | $219,900 | $149 | 92 |
| 15 E Reliance Ct | 0.21mi | 3/2.0 (-1) | 1,523 (+4%) | 1mo | $220,900 | $145 | 78 |
| 5 Vineyard Dr | 0.11mi | 3/2.0 (-1) | 1,364 (-7%) | 3mo | $191,000 | $140 | 75 |
| 14 Cross St | 0.16mi | 4/1.0 | 1,352 (-8%) | 1mo | $159,000 | $118 | 75 |
| 4 Concord Rd | 0.16mi | 3/2.0 (-1) | 1,600 (+9%) | 1mo | $269,900 | $169 | 72 |
| 3 Vineyard Dr | 0.12mi | 4/2.0 | 1,655 (+13%) | 2mo | $211,000 | $127 | 72 |
| 17 E Reliance Ct | 0.22mi | 3/2.0 (-1) | 1,355 (-8%) | 1mo | $212,400 | $157 | 71 |
| 101 E Fredonia Ct | 0.17mi | 4/2.0 | 1,655 (+13%) | 1mo | $232,000 | $140 | 70 |
| 18 Wheeler St | 0.36mi | 3/2.0 (-1) | 1,354 (-8%) | 2mo | $205,000 | $151 | 63 |
| 22 Ledrick Cir | 0.38mi | 3/2.0 (-1) | 1,648 (+12%) | 3mo | $264,400 | $160 | 55 |
Match score weights: distance 35% · size 25% · config 20% · recency 20%. Top-matched comps best support the ARV.
Projected returns pro-forma
9.62% appreciation · 3.0% rent growth · sell at horizon
- IRR
- 20.0%
- Equity multiple
- 2.60×
- Total profit
- $106,931
- Equity at exit
- $208,733
- IRR
- 18.4%
- Equity multiple
- 5.88×
- Total profit
- $326,812
- Equity at exit
- $443,262
Cash invested: $66,937 (down + closing). Projections, not guarantees.
Landlord ↔ Tenant lean methodology
- Overall (STATE)
- 92 Strongly Landlord-Friendly
- State Arkansas
- 92 Strongly Landlord-Friendly · R+14
- County
- — inherits STATE
- City
- — inherits STATE
ZIP-level market 72106
- Home prices YoY
- 4.2%
- Active inventory
- 110
- Price-to-rent
- 10.2×
Monthly cashflow live
- Estimated rent
- $1,752 high interval (Pro) →
- Mortgage (P&I)
- −$1,254
- Tax est. 1.5%
- −$299 /mo · $3,586/yr
- Insurance
- −$100
- HOA
- −$0
- Vacancy / Maint / Mgmt
- −$368
- Net cashflow
- $-268
Break-even live
UW: 25.0% down · 7.5% · 30yr · 1.5% tax · 5.0% vac · 8.0% maint · 8.0% mgmt
Financing live
Cash to close
- Down payment
- $59,766
- Closing costs
- $7,172
- Reserves months
- —
- Total cash needed
- —
Loan-product check · same deal, 3 products live
Conventional
25% down · 7.5% · 30yr
- Down + closing
- —
- Monthly P&I
- —
- Monthly cashflow
- —
- DSCR
- —
- Eligible?
- —
Personal DTI + credit; lowest rate.
DSCR
20% down · 8.5% · 30yr
- Down + closing
- —
- Monthly P&I
- —
- Monthly cashflow
- —
- DSCR
- —
- Eligible?
- —
No personal income docs; deal must DSCR.
Hard money
10% down · 12.0% · 12mo
- Down + closing
- —
- Monthly P&I
- —
- Monthly cashflow
- —
- DSCR
- —
- Eligible?
- —
Short-term bridge; refi at stabilization.
Rent comps 8 comps
| Address | Beds | Baths | Sqft | Rent | $/sqft | DOM | Units | Dist |
|---|---|---|---|---|---|---|---|---|
| 17 Vineyard Dr Mayflower, AR | 4.0 | 2.0 | 1655 | $1,850 | $1.12 | 14d | 1 | 0.04mi |
| 11 Vineyard Dr Mayflower, AR | 3.0 | 2.0 | 1364 | $1,650 | $1.21 | 43d | 1 | 0.07mi |
| 7 Vineyard Dr Mayflower, AR | 4.0 | 2.0 | 1476 | $1,750 | $1.19 | 43d | 1 | 0.10mi |
| 5 Vineyard Dr Mayflower, AR | 3.0 | 2.0 | 1364 | $1,650 | $1.21 | 43d | 1 | 0.11mi |
| 3 Vineyard Dr Mayflower, AR | 4.0 | 2.0 | 1655 | $1,850 | $1.12 | 14d | 1 | 0.12mi |
| 104 E Fredonia Ct Mayflower, AR | 4.0 | 2.0 | 1476 | $1,750 | $1.19 | 43d | 1 | 0.16mi |
| 103 E Fredonia Ct Mayflower, AR | 3.0 | 2.0 | 1364 | $1,650 | $1.21 | 14d | 1 | 0.17mi |
| 101 E Fredonia Ct Mayflower, AR | 4.0 | 2.0 | 1655 | $1,923 | $1.16 | 14d | 1 | 0.18mi |
Listing history 16 events
-
2026-06-18days on market $214,900 Active 57 DOM
-
2026-06-17days on market $214,900 Active 56 DOM
-
2026-06-16days on market $214,900 Active 55 DOM
-
2026-06-15days on market $214,900 Active 54 DOM
-
2026-06-14days on market $214,900 Active 52 DOM
-
2026-06-10days on market $214,900 Active 49 DOM
-
2026-06-09days on market $214,900 Active 48 DOM
-
2026-06-08days on market $214,900 Active 47 DOM
-
2026-06-07days on market $214,900 Active 46 DOM
-
2026-06-05days on market $214,900 Active 43 DOM
-
2026-06-03days on market $214,900 Active 42 DOM
-
2026-06-02days on market $214,900 Active 41 DOM
-
2026-06-01days on market $214,900 Active 40 DOM
-
2026-05-31days on market $214,900 Active 39 DOM
-
2026-05-31days on market $214,900 Active 38 DOM
-
2026-04-22$214,900 Active 333-char remark
Show marketing remark (333 chars)
This new single-story home is ready for modern lifestyles. An open-concept floorplan shared between the kitchen and living room encourages simple everyday transitions and multitasking. Three secondary bedrooms are tucked away to the side of the home, opposite from the luxurious owner's suite with a full bathroom and walk-in closet.
ⓘ Source: listings_history table (triggers on properties + properties_extension) + one-shot
backfill from property_details.listing_events for pre-trigger history.
Nearby sold comps map
Loading sold comps map…
Walkable amenities ~0.75 mi
Loading nearby amenities…
Taxation est. · year 1
- Rental income
- $21,027
- − Mortgage interest
- −$13,391
- − Property taxes
- −$3,586
- − Insurance
- −$1,195
- − Repairs & maintenance
- −$1,682
- − Management
- −$1,682
- − Depreciation
- −$6,955
- Taxable loss
- −$7,465
- Est. tax savings @ 24.0%
- +$1,792
- After-tax cash flow
- $-1,423/yr
For passive investors: Depreciation is non-cash, so a rental often shows a tax loss while cash-flowing — sheltering income. Rental losses are passive: they offset passive income freely, and up to $25,000/yr can offset ordinary (W-2) income if you actively participate and your MAGI is under $100k (phasing out to $0 by $150k); unused losses carry forward. On sale, claimed depreciation is recaptured at up to 25%, and gains may owe capital-gains tax (a 1031 exchange can defer both). Figures are a year-1 estimate at your 24.0% rate — not tax advice; consult a CPA.
Condition & rehab AI · 12 photos
This modern single-story home is move-in ready with a good condition score and a fresh, inviting interior. It offers a good return on investment with potential for further value increases through minor updates and improvements.
Value-add opportunities
- Both Painting the exterior and interior walls — Fresh paint can enhance curb appeal and interior aesthetics.
- Both Landscaping improvements — Enhanced landscaping can increase curb appeal and property value.
- Resale Upgrading the kitchen appliances — Modern appliances can attract more buyers and renters.
- Both Adding smart home features — Smart home features can increase convenience and appeal to tech-savvy buyers and renters.
- Both Upgrading the HVAC system — A more efficient HVAC system can improve comfort and reduce energy costs.
Renovation cost estimate screening
Value-add ROI direction
- Both Painting the exterior and interior walls — Fresh paint can enhance curb appeal and interior aesthetics. ↑
- Both Landscaping improvements — Enhanced landscaping can increase curb appeal and property value. ↑
- Resale Upgrading the kitchen appliances — Modern appliances can attract more buyers and renters. ↑
- Both Adding smart home features — Smart home features can increase convenience and appeal to tech-savvy buyers and renters. ↑
- Both Upgrading the HVAC system — A more efficient HVAC system can improve comfort and reduce energy costs. ↑
ⓘ Cost ranges are severity-bucket heuristics (US national rule-of-thumb). Get contractor quotes + a written scope before underwriting a rehab budget.
Schools (NCES district)
- District
- Mayflower School District
- NCES district ID
- 0509540
- Math proficiency
- 32% ▼ -9.00%
- Reading proficiency
- 34% ▼ -6.00%
- Median HH income
- $47,119
- Composite
- 28.41/100
- National rank
- #6760
- State rank
- #127 of 238 in AR
Livability — Mayflower
- Score
- 56/100
- State rank
- #390
- US rank
- #22893
Category grades
Schools grade is shown separately in the Schools card above.
Census & demographics
- Census place
- Mayflower, AR
- Population (ZIP)
- 5,719
Population outlook (Faulkner County) Hauer SSP2
- Today (2025)
- 138,985 people
- By 2030
- 148,264 · +6.7%
- By 2040
- 166,010 · +19.4%
- By 2050
- 183,362 · +31.9%
- By 2075
- 224,593 · +61.6%
- By 2100
- 250,603 · +80.3%
Race, ethnicity, and origin ACS 2023
- Neighborhood character
- Predominantly White (86%)
- Race & ethnicity
- White 86% Two or more races 7% Black 6% Hispanic / Latino 1%
- Common ancestry
- Slovak 3% Lithuanian 1% Italian 1%
- Foreign-born
- 6% · Canada
Political lean MEDSL · Faulkner
- 2024 margin
- Solid R (+32.3) · D 32.6% · R 64.9% · Other 2.5%
- 2008→2024 swing
- -7.1pp toward R · 2008: -25.3pp · 2024: -32.3pp
- All cycles
- 2024: R+32.3 2020: R+29.5 2016: R+31.6 2012: R+31.7 2008: R+25.3
Not yet ingested
- Civics
- —
Market trends
- HPI YoY
- ▲ 9.62%
- Current HPI
- 236.6197
- Rent YoY
- —
- Metro
- —
- State GDP YoY
- ▲ 3.80%
- F500 in state
- 10
Industry mix (Fortune 500 HQ in AR)
| Industry | F500 HQs | Revenue |
|---|---|---|
| Retail | 1 | $681B |
|
||
| Food / Agriculture | 1 | $53B |
|
||
| Retail / Energy | 1 | $22B |
|
||
| Transportation / Logistics | 1 | $12B |
|
||
| Energy | 1 | $4B |
|
||
Price history
1 event — show timeline
- 2026-04-22 Listed $214,900 Zillow
Cash-flow waterfall
monthlySold comps — $/sqft
last 12 mo · ≤1 miLoading sold comps…