1239 Anderson Dr · Trenton, TX
Flood risk No data
- FEMA flood zone
- —
- Chance of flooding over 30 yrs
- —
- Est. flood insurance / yr
- —
Fire risk No data
- Est. fire insurance / yr
- —
Heat risk No data
- Hot days now (above threshold)
- —
- Hot days in 30 yrs
- —
Wind risk No data
- Chance of severe wind over 30 yrs
- —
Air-quality risk No data
- Unhealthy air days now
- —
- Unhealthy air days in 30 yrs
- —
Risk factors via First Street. Map © Google.
Why this score? — see what drove the D+ grade
The composite is a weighted blend of 9 inputs, each scored 0–100. Each bar is that input's sub-score; the figure is the points it added to the 100-point composite (weight × sub-score).
- ARV discount +12.3/15.0
- Cash flow +10.0/30.0
- Appreciation +10.0/10.0
- Schools +3.1/10.0
- Livability +3.0/5.0
- DSCR +2.9/10.0
- Rent growth +2.5/5.0
- Condition / age +2.5/5.0
- 1% rule +1.8/10.0
$294,790
🖨 Deal sheet 📄 Offer letter ✓ Due diligence
Listing remarks MLS
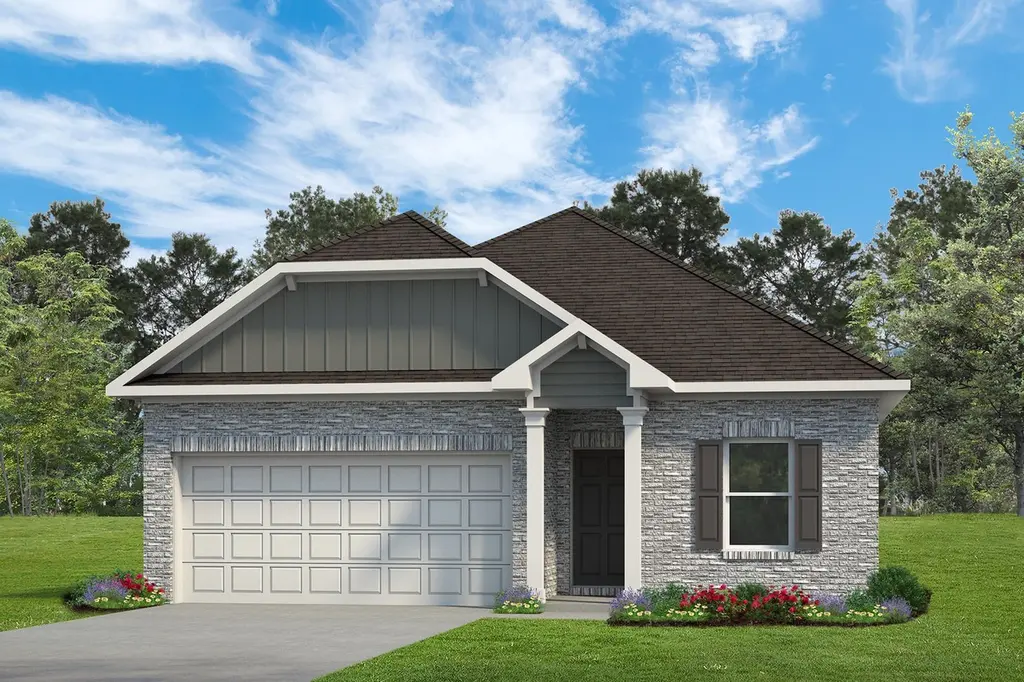
The Kettering II is a thoughtfully designed single-story home offering three bedrooms and two full baths. At the center, an open-concept kitchen, breakfast area, and family room create a seamless space for everyday living and gathering. Tucked away for added privacy, the secondary bedrooms are separate from the primary suite, which is located at the rear of the home for a quiet retreat. At the front of the home, a formal living room has been transformed into a private study with glass French doors, ideal for a work-from-home setup. A spacious covered patio extends the living space outdoors, making the Kettering II a perfect fit for families who want comfort, functionality, and room to enjoy it all.
Key facts
- Open-concept kitchen
- Private study
- 2 parking spots
Tags
Neighborhood map
What this means for you Summary
Snapshot
- This is a 3-bed/2.0-bath land listed at $295k.
Deal economics
- At list price, monthly cash flow is $-177 ($-2k/yr) — negative.
- To cash-flow at today's rent, offer at most $263k (10.6% below list).
- To meet the 1% rule (rent ≥ 1% of price), the offer needs to be $200k (32.2% below list).
- Recommended offer: $200k (32.2% below list) — sets the bar for 1% rule.
- Cap rate 5.6% vs local median 2.7% in Trenton — top-decile yield for the area; either an underpriced asset or a hidden risk that comps aren't pricing in. Stress-test before assuming the spread holds.
Location & tenants
- Location reads 59/100 on livability (#1,108 in TX) — a working-class tenant base; expect higher turnover. Strengths: cost of living A+, housing A+, employment B+; Watch: schools C-, crime D, amenities F.
- Trenton ISD (rural): math 27% / reading 43% proficiency, ranked #483 of 826 in TX (top 58%) — families likely to look elsewhere, expect single-tenant / working-renter base with shorter leases.
- Market conditions: 165 active listings in the ZIP; 1 comparable units currently listed for rent nearby; 82 units permitted in Fannin County in 2024 (0 in 5+ unit buildings).
Forward outlook
- In year one you build about $32k of equity ($2k loan paydown + $29k appreciation (10.0% local appreciation)).
- Fannin County population projected to shrink 6% by 2050 — rents likely to lag national; underwrite the cash flow, not the appreciation.
- By year 2, paydown + projected appreciation supports a ~$51k cash-out refi (75% LTV) — recoverable capital for the next deal without selling this one.
Negotiation context
- It's been on market 65 days — a 6% lower offer ($277k) is reasonable based on typical stale-listing flexibility.
Questions for the listing agent
- What do current leases actually rent for vs. the listed asking? Can we see a recent rent roll and the last 12 months of T-12 income?
- It's been on market 65 days. Have you received any prior offers? Is the seller open to a 32% concession, seller financing, or rate buy-down credit?
- Why hasn't it sold? Are there any deal-killer items the seller is aware of (foundation, flood, title, zoning, code violations)?
- Is there a deadline driving the sale (1031 exchange, divorce, estate, relocation)? That informs how much negotiation room exists.
- Crime grade is D in this area — have there been break-ins, vandalism, or insurance claims at this property in the last 3 years? What carrier currently insures it and at what premium?
- The area grade is low — what's the realistic commute time and amenity access for the typical tenant pool here? Any planned neighborhood developments (good or bad) we should know about?
- What's the average days-on-market for RENTAL listings here right now (not sales)? A rising rental-DOM trend means longer vacancies and softer asking-rent achievability than the comps imply.
- What's the recent tenant-quality profile in this submarket — average credit score on applications, eviction rate, late-payment / NSF rate, and stable-employment percentage? A property-management company in the area should have these aggregated.
- How much new for-sale + rental construction is in the pipeline within 1–3 miles? Heavy new supply typically softens prices + rents 12–24 months out; constrained supply supports both.
Investment metrics
- 1% rule
- 0.68% ✗
- Cap rate
- 5.57%
- Cash-on-cash
- -2.58%
- DSCR
- 0.89
- GRM
- 12.3
CMA / ARV
- ARV (median comp)
- $330,141
- List price
- $294,790
- Delta
- -10.71%
- Verdict
- UNDERPRICED
- Comps
- 20 within 1.0 mi
Projected returns pro-forma
10.0% appreciation · 3.0% rent growth · sell at horizon
- IRR
- 22.4%
- Equity multiple
- 2.81×
- Total profit
- $149,115
- Equity at exit
- $265,570
- IRR
- 20.1%
- Equity multiple
- 6.42×
- Total profit
- $447,719
- Equity at exit
- $572,712
Cash invested: $82,541 (down + closing). Projections, not guarantees.
Landlord ↔ Tenant lean methodology
- Overall (STATE)
- 87 Strongly Landlord-Friendly
- State Texas
- 87 Strongly Landlord-Friendly · R+5
- County
- — inherits STATE
- City
- — inherits STATE
ZIP-level market 75490
- Home prices YoY
- 5.6%
- Active inventory
- 165
- Price-to-rent
- 12.3×
Monthly cashflow live
- Estimated rent
- $2,000 medium interval (Pro) →
- Mortgage (P&I)
- −$1,546
- Tax from tax record
- −$89 /mo · $1,063/yr
- Insurance
- −$123
- HOA
- −$0
- Vacancy / Maint / Mgmt
- −$420
- Net cashflow
- $-177
Break-even live
UW: 25.0% down · 7.5% · 30yr · 1.5% tax · 5.0% vac · 8.0% maint · 8.0% mgmt
Financing live
Cash to close
- Down payment
- $73,698
- Closing costs
- $8,844
- Reserves months
- —
- Total cash needed
- —
Loan-product check · same deal, 3 products live
Conventional
25% down · 7.5% · 30yr
- Down + closing
- —
- Monthly P&I
- —
- Monthly cashflow
- —
- DSCR
- —
- Eligible?
- —
Personal DTI + credit; lowest rate.
DSCR
20% down · 8.5% · 30yr
- Down + closing
- —
- Monthly P&I
- —
- Monthly cashflow
- —
- DSCR
- —
- Eligible?
- —
No personal income docs; deal must DSCR.
Hard money
10% down · 12.0% · 12mo
- Down + closing
- —
- Monthly P&I
- —
- Monthly cashflow
- —
- DSCR
- —
- Eligible?
- —
Short-term bridge; refi at stabilization.
Rent comps 1 comps
| Address | Beds | Baths | Sqft | Rent | $/sqft | DOM | Units | Dist |
|---|---|---|---|---|---|---|---|---|
| 340 Sunnyside Dr Unit B Trenton, TX | 3.0 | 3.5 | 1673 | $2,000 | $1.20 | 1d | 1 | 0.43mi |
Listing history 15 events
-
2026-06-18days on market $294,790 Active 65 DOM
-
2026-06-17days on market $294,790 Active 64 DOM
-
2026-06-16days on market $294,790 Active 63 DOM
-
2026-06-15days on market $294,790 Active 62 DOM
-
2026-06-13days on market $294,790 Active 60 DOM
-
2026-06-09days on market $294,790 Active 56 DOM
-
2026-06-08days on market $294,790 Active 55 DOM
-
2026-06-07days on market $294,790 Active 54 DOM
-
2026-06-04days on market $294,790 Active 51 DOM
-
2026-06-03days on market $294,790 Active 50 DOM
-
2026-06-02days on market $294,790 Active 49 DOM
-
2026-06-01days on market $294,790 Active 48 DOM
-
2026-05-31days on market $294,790 Active 47 DOM
-
2026-05-09price $294,790 707-char remark
Show marketing remark (707 chars)
The Kettering II is a thoughtfully designed single-story home offering three bedrooms and two full baths. At the center, an open-concept kitchen, breakfast area, and family room create a seamless space for everyday living and gathering. Tucked away for added privacy, the secondary bedrooms are separate from the primary suite, which is located at the rear of the home for a quiet retreat. At the front of the home, a formal living room has been transformed into a private study with glass French doors, ideal for a work-from-home setup. A spacious covered patio extends the living space outdoors, making the Kettering II a perfect fit for families who want comfort, functionality, and room to enjoy it all.
-
2026-04-14$309,190 Active 707-char remark
Show marketing remark (707 chars)
The Kettering II is a thoughtfully designed single-story home offering three bedrooms and two full baths. At the center, an open-concept kitchen, breakfast area, and family room create a seamless space for everyday living and gathering. Tucked away for added privacy, the secondary bedrooms are separate from the primary suite, which is located at the rear of the home for a quiet retreat. At the front of the home, a formal living room has been transformed into a private study with glass French doors, ideal for a work-from-home setup. A spacious covered patio extends the living space outdoors, making the Kettering II a perfect fit for families who want comfort, functionality, and room to enjoy it all.
ⓘ Source: listings_history table (triggers on properties + properties_extension) + one-shot
backfill from property_details.listing_events for pre-trigger history.
Tax reassessment forecast TX · Resets to sale price
- Current annual tax
- $1,063 · $89/mo
- Projected year-2 tax
- $5,395 · $450/mo
- Expected delta
- +$4,332/yr (+$361/mo · 407.6%)
ⓘ Screening estimate from a state-policy table — verify with the county assessor before closing.
Nearby sold comps map
Loading sold comps map…
Walkable amenities ~0.75 mi
Loading nearby amenities…
Taxation est. · year 1
- Rental income
- $24,000
- − Mortgage interest
- −$16,513
- − Property taxes
- −$1,063
- − Insurance
- −$1,474
- − Repairs & maintenance
- −$1,920
- − Management
- −$1,920
- − Depreciation
- −$8,576
- Taxable loss
- −$7,465
- Est. tax savings @ 24.0%
- +$1,792
- After-tax cash flow
- $-336/yr
For passive investors: Depreciation is non-cash, so a rental often shows a tax loss while cash-flowing — sheltering income. Rental losses are passive: they offset passive income freely, and up to $25,000/yr can offset ordinary (W-2) income if you actively participate and your MAGI is under $100k (phasing out to $0 by $150k); unused losses carry forward. On sale, claimed depreciation is recaptured at up to 25%, and gains may owe capital-gains tax (a 1031 exchange can defer both). Figures are a year-1 estimate at your 24.0% rate — not tax advice; consult a CPA.
Schools (NCES district)
- District
- Trenton ISD
- NCES district ID
- 4843140
- Math proficiency
- 27% ▼ -16.00%
- Reading proficiency
- 43% ▼ -11.00%
- Median HH income
- $61,383
- Composite
- 31.38/100
- National rank
- #5993
- State rank
- #483 of 826 in TX
Livability — Trenton
- Score
- 59/100
- State rank
- #1108
- US rank
- #19614
Category grades
Schools grade is shown separately in the Schools card above.
Census & demographics
- Census place
- Trenton, TX
- Population (ZIP)
- 3,024
Population outlook (Fannin County) Hauer SSP2
- Today (2025)
- 33,423 people
- By 2030
- 33,035 · -1.2%
- By 2040
- 32,250 · -3.5%
- By 2050
- 31,462 · -5.9%
- By 2075
- 29,447 · -11.9%
- By 2100
- 25,459 · -23.8%
Race, ethnicity, and origin ACS 2023
- Neighborhood character
- Predominantly White (84%)
- Race & ethnicity
- White 84% Hispanic / Latino 10% Two or more races 8% Black 5%
- Hispanic origin (detail)
- Mexican 8%
- Common ancestry
- Slovak 1%
- Foreign-born
- 3% · Canada, Dominican Republic
- Languages at home
- 95% English-only · Spanish 5%
Political lean MEDSL · Fannin
- 2024 margin
- Solid R (+67.4) · D 15.9% · R 83.3%
- 2008→2024 swing
- -27.8pp toward R · 2008: -39.6pp · 2024: -67.4pp
- All cycles
- 2024: R+67.4 2020: R+63.4 2016: R+61.9 2012: R+52.5 2008: R+39.6
Not yet ingested
- Civics
- —
Market trends
- HPI YoY
- ▲ 16.09%
- Current HPI
- 301.2127
- Rent YoY
- —
- Metro
- —
- State GDP YoY
- ▲ 3.95%
- F500 in state
- 110
Industry mix (Fortune 500 HQ in TX)
| Industry | F500 HQs | Revenue |
|---|---|---|
| Energy | 16 | $1,198B |
|
||
| Technology | 5 | $198B |
|
||
| Engineering / Construction | 4 | $72B |
|
||
| Energy Services | 3 | $60B |
|
||
| Utilities | 3 | $41B |
|
||
| Healthcare | 2 | $330B |
|
||
Price history
-4.7% since first listed2 events — show timeline
- 2026-05-09 Price Changed $294,790 Zillow
- 2026-04-14 Listed $309,190 Zillow
Property tax history
-6.5%/yrLatest (2025): $1,063 · -6.5% YoY. Source: county tax records.
Cash-flow waterfall
monthlySold comps — $/sqft
last 12 mo · ≤1 miLoading sold comps…