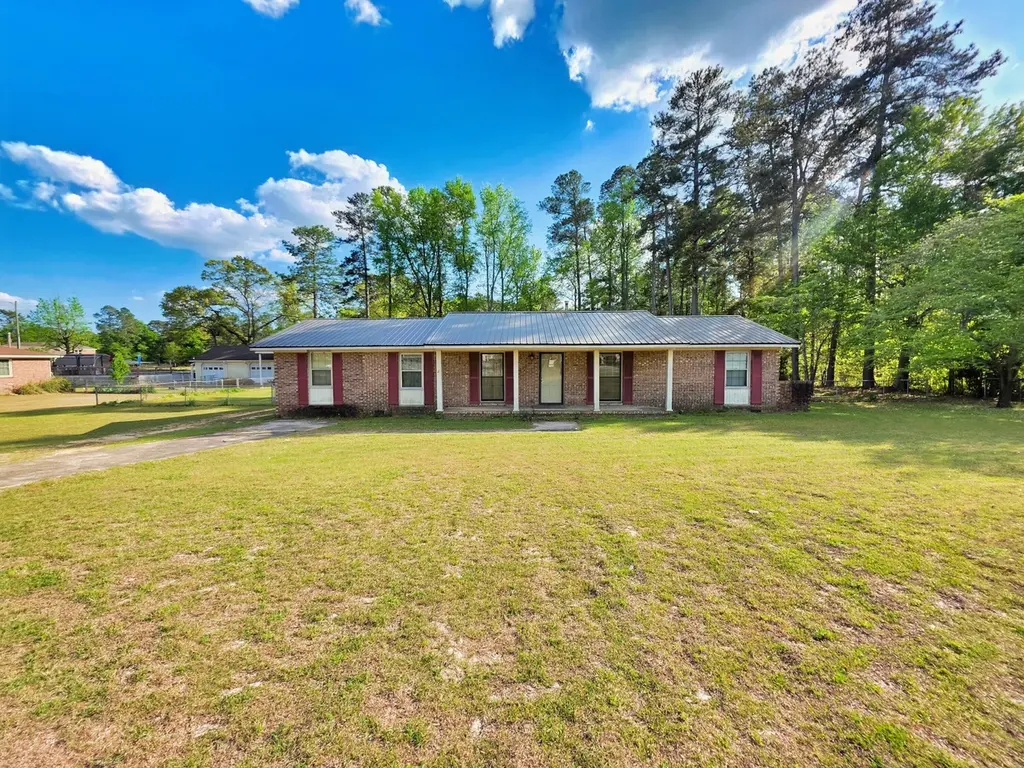
1803 Pine Log Rd · Aiken, SC
Flood risk 6/10 · Moderate
- FEMA flood zone
- X (unshaded)
- Chance of flooding over 30 yrs
- 0.72%
- Est. flood insurance / yr
- $507 – $1,088
Fire risk 4/10 · Minor
- Est. fire insurance / yr
- $783 – $1,453
Heat risk 7/10 · Major
- Hot days now (above 108°F)
- 7 days/yr
- Hot days in 30 yrs
- 17 days/yr
Wind risk 7/10 · Major
- Chance of severe wind over 30 yrs
- 78.0%
Air-quality risk 4/10 · Minor
- Unhealthy air days now
- 4 days/yr
- Unhealthy air days in 30 yrs
- 4 days/yr
Risk factors via First Street. Map © Google.
Why this score? — see what drove the B grade
The composite is a weighted blend of 9 inputs, each scored 0–100. Each bar is that input's sub-score; the figure is the points it added to the 100-point composite (weight × sub-score).
- Cash flow +28.3/30.0
- ARV discount +15.0/15.0
- DSCR +10.0/10.0
- 1% rule +6.6/10.0
- Rent growth +3.6/5.0
- Livability +3.4/5.0
- Schools +3.2/10.0
- Condition / age +2.5/5.0
- Appreciation +0.0/10.0
$150,000
🖨 Deal sheet 📄 Offer letter ✓ Due diligence
Listing remarks
Great southside location, convenient to shopping, churches, restaurants, and schools. Home has 4 bedrooms, 2 full baths, new metal roof, fenced back yard.
Key facts
- New metal roof
- Fenced back yard
- Southside location
Tags
Property features AI
Exterior
- Parking: 2-car garage; Driveway
- Utilities: Public water; Septic tank sewer; Electricity available; Natural gas available; Cable available; Phone available
- Home design: Single-family residence; One story; Brick exterior; Brick veneer exterior; Facing southside area of Aiken (southside)
- Construction: Metal roof (new in 2025); Brick/brick veneer construction; Brick/mortar foundation; Built as a ranch-style home
- Exterior features: Fenced yard; Storage building; Workshop
Interior
- Kitchen: Dishwasher; Cooktop; Microwave; Refrigerator
- Bedrooms: 4 bedrooms
- Flooring: Vinyl; Carpet; Hardwood
- Bathrooms: 2 full bathrooms
- Heating & cooling: Central air; Heat pump; Forced air heating; Natural gas heating; Hot water heating
- Interior features: Ceiling fans; Kitchen island; Eat-in kitchen; Crawl space basement
- Laundry & utility: Washer hookup; Electric dryer hookup; Gas water heater
Neighborhood map
What this means for you Summary
Snapshot
- This is a 4-bed/2.0-bath single-family listed at $150k.
Deal economics
- At list price, monthly cash flow is $483 ($6k/yr) — positive.
- The deal already cash-flows at list — no discount required.
- Meets the 1% rule at list price ($2k rent vs $150k).
- Cap rate 10.2% vs local median 4.1% in Aiken — top-decile yield for the area; either an underpriced asset or a hidden risk that comps aren't pricing in. Stress-test before assuming the spread holds.
Location & tenants
- Location reads 67/100 on livability (#93 in SC) — a middle-class / working-renter tenant base. Strengths: housing A+, health & safety A+, cost of living A; Watch: crime F, commute F.
- Aiken 01 (suburban): math 31% / reading 44% proficiency, ranked #36 of 80 in SC (top 45%) — families likely to look elsewhere, expect single-tenant / working-renter base with shorter leases.
- Market conditions: Rents rising fast (+4.4%/yr); 516 active listings in the ZIP; 5 comparable units currently listed for rent nearby; rentals at typical pace (median 14d on market — plan ~3-4 weeks tenant-placement turnaround); solid renter incomes; 2,500 units permitted in Aiken County in 2024 (1,023 in 5+ unit buildings).
Forward outlook
- Local home prices are declining (-3.0%/yr); year-one equity from $1k of loan paydown is wiped out by about $4k of value loss. Plan a longer hold.
- Aiken County population projected at +9% by 2050 — modest demand growth; plan on rents tracking national, not racing it.
- At projected returns (-3.0% appreciation + 4.4% rent growth), your $42k cash investment doubles in ~8 years — after that, you're playing with house money.
Negotiation context
- Only 9 days on market — expect competitive offers; lowballing is unlikely to land.
Risks & watch-outs
- Climate carrying-cost: major flood risk; major wind risk, 78% chance of damaging wind over 30y; extreme-heat days projected 7→17/yr by 2055 (HVAC capex compounding) — expect insurance premiums to compound above CPI over the hold.
Questions for the listing agent
- Built in 1966 — when were the roof, HVAC, electrical panel, plumbing, and water heater last replaced?
- Is there a deadline driving the sale (1031 exchange, divorce, estate, relocation)? That informs how much negotiation room exists.
- Schools are B-rated — typically a magnet for longer-tenancy family renters. What's the average tenant stay here, and is there a school-zone premium baked into asking?
- Crime grade is F in this area — have there been break-ins, vandalism, or insurance claims at this property in the last 3 years? What carrier currently insures it and at what premium?
- What's the average days-on-market for RENTAL listings here right now (not sales)? A rising rental-DOM trend means longer vacancies and softer asking-rent achievability than the comps imply.
- What's the recent tenant-quality profile in this submarket — average credit score on applications, eviction rate, late-payment / NSF rate, and stable-employment percentage? A property-management company in the area should have these aggregated.
- How much new for-sale + rental construction is in the pipeline within 1–3 miles? Heavy new supply typically softens prices + rents 12–24 months out; constrained supply supports both.
Investment metrics
- 1% rule
- 1.16% ✓
- Cap rate
- 10.16%
- Cash-on-cash
- 13.80%
- DSCR
- 1.61
- GRM
- 7.2
CMA / ARV
- ARV (on-the-fly)
- $243,729
- Comps found
- 10
Show comp detail 10 sales within ~0.75 mi
| Address | Dist | Beds/Ba | Sqft | Sold | Price | $/sf | Match |
|---|---|---|---|---|---|---|---|
| 10 Deerwood Dr | 0.15mi | 3/2.0 (-1) | 1,633 (+2%) | 9mo | $285,000 | $175 | 76 |
| 17 Buckhead Ct | 0.31mi | 3/2.0 (-1) | 1,580 (-1%) | 9mo | $265,000 | $168 | 72 |
| 40 Lundee Ct | 0.31mi | 3/2.0 (-1) | 1,692 (+6%) | 4mo | $255,000 | $151 | 66 |
| 1704 Pine Log Rd | 0.32mi | 3/2.0 (-1) | 1,768 (+11%) | 2mo | $270,000 | $153 | 60 |
| 2242 Shawnee Dr | 0.33mi | 3/2.0 (-1) | 1,552 (-3%) | 22mo | $340,000 | $219 | 57 |
| 1946 Lundee Dr | 0.36mi | 3/2.0 (-1) | 1,771 (+11%) | 14mo | $240,000 | $136 | 48 |
| 6 Troon Way | 0.37mi | 3/2.5 (-1) | 1,691 (+6%) | 23mo | $278,000 | $164 | 46 |
| 1964 Huntsman Dr | 0.37mi | 3/2.0 (-1) | 1,742 (+9%) | 22mo | $250,000 | $144 | 43 |
| 2065 Pine Log Rd | 0.65mi | 3/2.0 (-1) | 1,800 (+13%) | 5mo | $180,000 | $100 | 39 |
| 2512 Spring Valley Drive Dr | 0.67mi | 3/2.5 (-1) | 1,776 (+12%) | 15mo | $272,500 | $153 | 30 |
Match score weights: distance 35% · size 25% · config 20% · recency 20%. Top-matched comps best support the ARV.
Projected returns pro-forma
-3.0% appreciation · 4.43% rent growth · sell at horizon
- IRR
- 5.4%
- Equity multiple
- 1.21×
- Total profit
- $8,935
- Equity at exit
- $22,365
- IRR
- 16.0%
- Equity multiple
- 2.38×
- Total profit
- $57,900
- Equity at exit
- $12,969
Cash invested: $42,000 (down + closing). Projections, not guarantees.
Landlord ↔ Tenant lean methodology
- Overall (STATE)
- 90 Strongly Landlord-Friendly
- State South Carolina
- 90 Strongly Landlord-Friendly · R+6
- County
- — inherits STATE
- City
- — inherits STATE
ZIP-level market 29803
- Rents YoY
- 4.4%
- Active inventory
- 516
- Price-to-rent
- 7.2×
Monthly cashflow live
- Estimated rent
- $1,746 high interval (Pro) →
- Mortgage (P&I)
- −$787
- Tax from tax record
- −$47 /mo · $565/yr
- Insurance
- −$62
- HOA
- −$0
- Vacancy / Maint / Mgmt
- −$367
- Net cashflow
- $483
Break-even live
UW: 25.0% down · 7.5% · 30yr · 1.5% tax · 5.0% vac · 8.0% maint · 8.0% mgmt
Financing live
Cash to close
- Down payment
- $37,500
- Closing costs
- $4,500
- Reserves months
- —
- Total cash needed
- —
Loan-product check · same deal, 3 products live
Conventional
25% down · 7.5% · 30yr
- Down + closing
- —
- Monthly P&I
- —
- Monthly cashflow
- —
- DSCR
- —
- Eligible?
- —
Personal DTI + credit; lowest rate.
DSCR
20% down · 8.5% · 30yr
- Down + closing
- —
- Monthly P&I
- —
- Monthly cashflow
- —
- DSCR
- —
- Eligible?
- —
No personal income docs; deal must DSCR.
Hard money
10% down · 12.0% · 12mo
- Down + closing
- —
- Monthly P&I
- —
- Monthly cashflow
- —
- DSCR
- —
- Eligible?
- —
Short-term bridge; refi at stabilization.
Rent comps 5 comps
| Address | Beds | Baths | Sqft | Rent | $/sqft | DOM | Units | Dist |
|---|---|---|---|---|---|---|---|---|
| 101 Fairway Rdg Aiken, SC | 1.0–3.0 | 1.0–2.0 | 1005 | $1,285 | $1.28 | 14d | 15 | 0.66mi |
| 232 Kemper Downs Dr Aiken, SC | 4.0 | 2.0 | 1734 | $2,000 | $1.15 | 14d | 1 | 0.78mi |
| 2198 Pine Log Rd Warrenville, SC | 3.0 | 2.0 | 1225 | $1,500 | $1.22 | 23d | 1 | 1.18mi |
| 5 The Cors Aiken, SC | 3.0 | 2.5 | 1350 | $1,800 | $1.33 | 14d | 1 | 1.32mi |
| 100 Cody Ln Aiken, SC | 2.0–3.0 | 2.0–2.5 | 1163 | $1,326 | $1.14 | 14d | 11 | 1.37mi |
Listing history 8 events
-
2026-06-17statusdays on market $150,000 Pending 9 DOM
-
2026-06-16days on market $150,000 Active 8 DOM
-
2026-06-15days on market $150,000 Active 7 DOM
-
2026-06-14days on market $150,000 Active 5 DOM
-
2026-06-13days on market $150,000 Active 4 DOM
-
2026-06-10days on market $150,000 Active 2 DOM
-
2026-06-09remarks 154-char remark
-
2026-06-09$150,000 Active 1 DOM
ⓘ Source: listings_history table (triggers on properties + properties_extension) + one-shot
backfill from property_details.listing_events for pre-trigger history.
Tax reassessment forecast SC · Resets to sale price
- Current annual tax
- $565 · $47/mo
- Projected year-2 tax
- $855 · $71/mo
- Expected delta
- +$290/yr (+$24/mo · 51.4%)
ⓘ Screening estimate from a state-policy table — verify with the county assessor before closing.
Climate risk First Street
- Flood 6/10 Major FEMA zone X (unshaded) · 72% chance over 30 yrs
- Wildfire 4/10 Moderate
- Heat 7/10 Severe 7 d/yr ≥108°F today · 17 d/yr by 30 yrs out
- Wind 7/10 Severe 78% chance of damaging wind over 30 yrs
- Air quality 4/10 Moderate 4 unhealthy d/yr today · 4 by 30 yrs out
Nearby sold comps map
Loading sold comps map…
Walkable amenities ~0.75 mi
Loading nearby amenities…
Taxation est. · year 1
- Rental income
- $20,948
- − Mortgage interest
- −$8,402
- − Property taxes
- −$565
- − Insurance
- −$750
- − Repairs & maintenance
- −$1,676
- − Management
- −$1,676
- − Depreciation
- −$4,364
- Taxable income
- $3,515
- Est. tax owed @ 24.0%
- −$844
- After-tax cash flow
- $4,951/yr
For passive investors: Depreciation is non-cash, so a rental often shows a tax loss while cash-flowing — sheltering income. Rental losses are passive: they offset passive income freely, and up to $25,000/yr can offset ordinary (W-2) income if you actively participate and your MAGI is under $100k (phasing out to $0 by $150k); unused losses carry forward. On sale, claimed depreciation is recaptured at up to 25%, and gains may owe capital-gains tax (a 1031 exchange can defer both). Figures are a year-1 estimate at your 24.0% rate — not tax advice; consult a CPA.
Schools (NCES district)
- District
- Aiken 01
- NCES district ID
- 4500720
- Math proficiency
- 31% ▼ -11.00%
- Reading proficiency
- 44% ▼ -1.00%
- Median HH income
- $45,081
- Composite
- 31.91/100
- National rank
- #5857
- State rank
- #36 of 80 in SC
Livability — Aiken
- Score
- 67/100
- State rank
- #93
- US rank
- #10443
Category grades
Schools grade is shown separately in the Schools card above.
Census & demographics
- County
- Aiken County · 116,534 people
- City population
- 71,807
- Metro
- Augusta-Richmond County, GA-SC
- Population (ZIP)
- 40,699
- Household income
- $86,023
- Rent vs Own
- Severe rent burden
- 641.0
Population outlook (Aiken County) Hauer SSP2
- Today (2025)
- 178,003 people
- By 2030
- 182,876 · +2.7%
- By 2040
- 189,970 · +6.7%
- By 2050
- 193,840 · +8.9%
- By 2075
- 199,453 · +12.1%
- By 2100
- 192,403 · +8.1%
Race, ethnicity, and origin ACS 2023
- Neighborhood character
- Predominantly White (73%)
- Race & ethnicity
- White 73% Black 16% Two or more races 6% Hispanic / Latino 5% Asian 2%
- Common ancestry
- Slovak 3% Serbian 3% Lithuanian 3%
- Foreign-born
- 3% · Canada, Vietnam, China
- Languages at home
- 95% English-only · Spanish 3% Vietnamese 1%
Political lean MEDSL · Aiken
- 2024 margin
- Strong R (+25.9) · D 36.4% · R 62.2% · Other 1.4%
- 2008→2024 swing
- -1.9pp toward R · 2008: -24.0pp · 2024: -25.9pp
- All cycles
- 2024: R+25.9 2020: R+22.7 2016: R+27.5 2012: R+26.0 2008: R+24.0
Not yet ingested
- Civics
- —
Market trends
- HPI YoY
- ▼ -221.02%
- Current HPI
- 231.6908
- Rent YoY
- ▲ 4.43%
- Metro
- Augusta-Richmond County, GA-SC
- State GDP YoY
- ▲ 4.51%
- F500 in state
- 2
Industry mix (Fortune 500 HQ in SC)
| Industry | F500 HQs | Revenue |
|---|---|---|
| Packaging | 1 | $7B |
|
||
Price history
1 event — show timeline
- 2026-06-08 Listed $150,000 AMLS
Property tax history
+7.6%/yrLatest (2025): $565 · -0.2% YoY. Source: county tax records.
Cash-flow waterfall
monthlySold comps — $/sqft
last 12 mo · ≤1 miLoading sold comps…