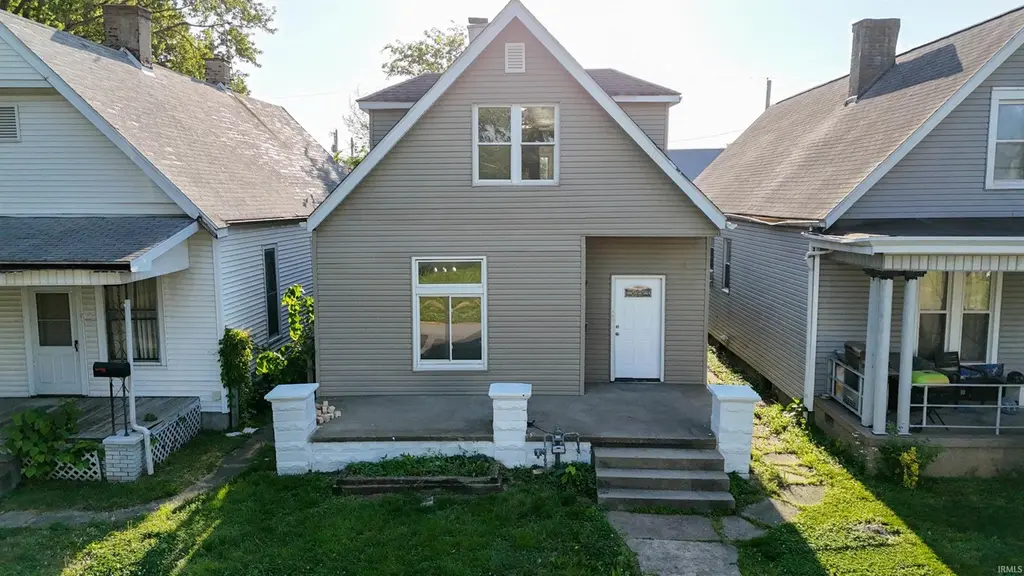
1105 Baker Ave · Evansville, IN
Flood risk 1/10 · Minimal
- FEMA flood zone
- X (unshaded)
- Chance of flooding over 30 yrs
- 0.0%
- Est. flood insurance / yr
- $473 – $860
Fire risk 1/10 · Minimal
- Est. fire insurance / yr
- $717 – $1,331
Heat risk 5/10 · Moderate
- Hot days now (above 106°F)
- 7 days/yr
- Hot days in 30 yrs
- 19 days/yr
Wind risk 2/10 · Minimal
- Chance of severe wind over 30 yrs
- 4.0%
Air-quality risk 4/10 · Minor
- Unhealthy air days now
- 3 days/yr
- Unhealthy air days in 30 yrs
- 5 days/yr
Risk factors via First Street. Map © Google.
Why this score? — see what drove the F grade
The composite is a weighted blend of 9 inputs, each scored 0–100. Each bar is that input's sub-score; the figure is the points it added to the 100-point composite (weight × sub-score).
- ARV discount +7.5/15.0
- Cash flow +5.7/30.0
- Schools +3.3/10.0
- Livability +3.2/5.0
- Rent growth +2.5/5.0
- Condition / age +2.5/5.0
- 1% rule +0.8/10.0
- DSCR +0.1/10.0
- Appreciation +0.0/10.0
$139,900
🖨 Deal sheet (PDF) 📄 Offer letter ✓ Due diligence
Listing remarks
Fully renovated and move-in ready, this spacious 4-bedroom, 1-bath home at 1105 Baker Avenue offers modern updates with classic charm. The home features a completely refreshed interior with new kitchen appliances, creating a clean and functional space perfect for everyday living and entertaining. Generously sized bedrooms provide flexibility for family, guests, home office, or additional living space. The updated finishes throughout give the home a fresh, cohesive feel while maintaining its character.
Key facts
- Move-in ready
- Fully renovated
- Updated finishes
Tags
Property features AI
Exterior
- Utilities: Public water; Public sewer
- Home design: Single-family, site-built home; 2 stories
- Construction: Shingle siding; Vinyl siding; Asphalt roofing
- Exterior features: Lot dimensions approximately 30 x 125
Interior
- Kitchen: Electric cooktop; Dishwasher; Refrigerator
- Bedrooms: Total of 4 rooms (includes bedrooms and living spaces); Laundry on main level
- Bathrooms: 1 full bathroom (located on the main level)
- Heating & cooling: Central air conditioning; Forced air heating; Hot water heating
- Interior features: Dishwasher; Refrigerator; Electric cooktop; Partial, unfinished basement
- Laundry & utility: Main-level laundry
Neighborhood map
What this means for you Summary
Snapshot
- This is a 3-bed/1.0-bath single-family listed at $140k.
Deal economics
- At list price, monthly cash flow is $-286 ($-3k/yr) — negative.
- To cash-flow at today's rent, offer at most $89k (36.1% below list).
- To meet the 1% rule (rent ≥ 1% of price), the offer needs to be $82k (41.6% below list).
- Recommended offer: $82k (41.6% below list) — sets the bar for 1% rule.
Location & tenants
- Location reads 63/100 on livability (#416 in IN) — a middle-class / working-renter tenant base. Strengths: cost of living A+, housing A+, health & safety A+; Watch: crime F, commute F, employment D-.
- Evansville Vanderburgh School Corporation (urban): math 36% / reading 43% proficiency, ranked #153 of 301 in IN (top 51%) — families likely to look elsewhere, expect single-tenant / working-renter base with shorter leases.
- Zoned schools: Delaware Elementary School (math 22% / reading 16%, grade F, #829 of 994 statewide, top 84%, 338 students, 90% FRL); North Junior High School (math 44% / reading 57%, grade C, #43 of 330 statewide, top 14%, 929 students, 42% FRL); North High School (math 57% / reading 74%, grade B, #29 of 369 statewide, top 8%, 1,674 students, 35% FRL).
- Market conditions: 88 active listings in the ZIP; 3 comparable units currently listed for rent nearby; rentals at typical pace (median 22d on market — plan ~3-4 weeks tenant-placement turnaround); 508 units permitted in Vanderburgh County in 2024 (32 in 5+ unit buildings).
Forward outlook
- Local home prices are declining (-3.0%/yr); year-one equity from $967 of loan paydown is wiped out by about $4k of value loss. Plan a longer hold.
Negotiation context
- It's been on market 56 days — a 3% lower offer ($136k) is reasonable based on typical stale-listing flexibility.
Risks & watch-outs
- Watch-outs: built in 1909 — expect roof / HVAC / electrical / plumbing capex.
- Climate carrying-cost: extreme-heat days projected 7→19/yr by 2055 (HVAC capex compounding) — expect insurance premiums to compound above CPI over the hold.
Questions for the listing agent
- What do current leases actually rent for vs. the listed asking? Can we see a recent rent roll and the last 12 months of T-12 income?
- It's been on market 56 days. Have you received any prior offers? Is the seller open to a 42% concession, seller financing, or rate buy-down credit?
- Built in 1909 — when were the roof, HVAC, electrical panel, plumbing, and water heater last replaced?
- Is there a deadline driving the sale (1031 exchange, divorce, estate, relocation)? That informs how much negotiation room exists.
- Schools are D-rated, which usually means shorter tenancies and higher turnover. Who's the typical renter profile here, and what's been the actual vacancy rate?
- Crime grade is F in this area — have there been break-ins, vandalism, or insurance claims at this property in the last 3 years? What carrier currently insures it and at what premium?
- The area grade is low — what's the realistic commute time and amenity access for the typical tenant pool here? Any planned neighborhood developments (good or bad) we should know about?
- What's the average days-on-market for RENTAL listings here right now (not sales)? A rising rental-DOM trend means longer vacancies and softer asking-rent achievability than the comps imply.
- What's the recent tenant-quality profile in this submarket — average credit score on applications, eviction rate, late-payment / NSF rate, and stable-employment percentage? A property-management company in the area should have these aggregated.
- How much new for-sale + rental construction is in the pipeline within 1–3 miles? Heavy new supply typically softens prices + rents 12–24 months out; constrained supply supports both.
Investment metrics
- 1% rule
- 0.58% ✗
- Cap rate
- 3.84%
- Cash-on-cash
- -8.77%
- DSCR
- 0.61
- GRM
- 14.3
CMA / ARV
- ARV (on-the-fly)
- $54,096
- Comps found
- 12
Show comp detail 12 sales within ~0.75 mi
| Address | Dist | Beds/Ba | Sqft | Sold | Price | $/sf | Match |
|---|---|---|---|---|---|---|---|
| 27 W Missouri St | 0.02mi | 3/2.0 | 2,288 (-3%) | 15mo | $35,000 | $15 | 78 |
| 1002 Edgar St | 0.39mi | 3/2.0 | 2,285 (-3%) | 6mo | $5,000 | $2 | 68 |
| 1110 N Main St | 0.08mi | 3/2.5 | 2,546 (+8%) | 12mo | $185,000 | $73 | 66 |
| 313 W Florida St | 0.21mi | 3/1.0 | 2,064 (-12%) | 8mo | $40,000 | $19 | 63 |
| 216 E Delaware St | 0.38mi | 3/2.0 | 2,184 (-7%) | 12mo | $215,000 | $98 | 56 |
| 404 E Iowa St | 0.50mi | 4/1.5 (+1) | 2,492 (+6%) | 6mo | $58,500 | $23 | 55 |
| 13 E Delaware St | 0.31mi | 4/2.0 (+1) | 2,504 (+6%) | 15mo | $185,000 | $74 | 53 |
| 908 W Maryland St | 0.62mi | 3/1.5 | 2,236 (-5%) | 12mo | $28,000 | $13 | 51 |
| 1913 N Heidelbach Ave | 0.60mi | 4/2.0 (+1) | 2,200 (-6%) | 4mo | $115,000 | $52 | 49 |
| 209 W Columbia St | 0.22mi | 4/2.0 (+1) | 2,034 (-14%) | 18mo | $45,000 | $22 | 44 |
| 909 W Maryland St | 0.62mi | 4/1.0 (+1) | 2,658 (+13%) | 12mo | $30,000 | $11 | 34 |
| 406 Keck Ave | 0.69mi | 3/2.0 | 2,000 (-15%) | 13mo | $131,500 | $66 | 28 |
Match score weights: distance 35% · size 25% · config 20% · recency 20%. Top-matched comps best support the ARV.
Projected returns pro-forma
-3.0% appreciation · 3.0% rent growth · sell at horizon
- IRR
- -31.8%
- Equity multiple
- -0.04×
- Total profit
- $-40,912
- Equity at exit
- $20,860
- IRR
- -36.4%
- Equity multiple
- -0.51×
- Total profit
- $-59,141
- Equity at exit
- $12,096
Cash invested: $39,172 (down + closing). Projections, not guarantees.
Landlord ↔ Tenant lean methodology
- Overall (STATE)
- 90 Strongly Landlord-Friendly
- State Indiana
- 90 Strongly Landlord-Friendly · R+11
- County
- — inherits STATE
- City
- — inherits STATE
ZIP-level market 47710
- Home prices YoY
- -29.7%
- Active inventory
- 88
- Price-to-rent
- 14.3×
Monthly cashflow live
- Estimated rent
- $817 medium interval (Pro) →
- Mortgage (P&I)
- −$734
- Tax from tax record
- −$139 /mo · $1,672/yr
- Insurance
- −$58
- HOA
- −$0
- Vacancy / Maint / Mgmt
- −$171
- Net cashflow
- $-286
Break-even live
Sensitivity live
| Price | -10% $-207 | -5% $-247 | +0% $-286 | +5% $-326 | +10% $-365 |
|---|---|---|---|---|---|
| Rent | -10% $-351 | -5% $-319 | +0% $-286 | +5% $-254 | +10% $-222 |
| Rate | -1.0pp $-216 | -0.5pp $-251 | base $-286 | +0.5pp $-323 | +1.0pp $-359 |
UW: 25.0% down · 7.5% · 30yr · 1.5% tax · 5.0% vac · 8.0% maint · 8.0% mgmt
Financing live
Cash to close
- Down payment
- $34,975
- Closing costs
- $4,197
- Reserves months
- —
- Total cash needed
- —
Loan-product check · same deal, 3 products live
Conventional
25% down · 7.5% · 30yr
- Down + closing
- —
- Monthly P&I
- —
- Monthly cashflow
- —
- DSCR
- —
- Eligible?
- —
Personal DTI + credit; lowest rate.
DSCR
20% down · 8.5% · 30yr
- Down + closing
- —
- Monthly P&I
- —
- Monthly cashflow
- —
- DSCR
- —
- Eligible?
- —
No personal income docs; deal must DSCR.
Hard money
10% down · 12.0% · 12mo
- Down + closing
- —
- Monthly P&I
- —
- Monthly cashflow
- —
- DSCR
- —
- Eligible?
- —
Short-term bridge; refi at stabilization.
Rent comps 3 comps
| Address | Beds | Baths | Sqft | Rent | $/sqft | DOM | Units | Dist |
|---|---|---|---|---|---|---|---|---|
| 121 E Florida St Evansville, IN | 4.0 | 2.0 | 1702 | $100 | $0.06 | 22d | 1 | 0.22mi |
| 1317 Harriet St Evansville, IN | 3.0 | 2.0 | 2000 | $995 | $0.50 | 14d | 1 | 0.28mi |
| 27 W Franklin St Evansville, IN | 4.0 | 2.5 | 2500 | $1,100 | $0.44 | 22d | 1 | 0.53mi |
Listing history 16 events
-
2026-06-18days on market $139,900 Active 56 DOM
-
2026-06-17days on market $139,900 Active 55 DOM
-
2026-06-16days on market $139,900 Active 54 DOM
-
2026-06-15days on market $139,900 Active 53 DOM
-
2026-06-14days on market $139,900 Active 51 DOM
-
2026-06-13days on market $139,900 Active 50 DOM
-
2026-06-10days on market $139,900 Active 48 DOM
-
2026-06-09days on market $139,900 Active 47 DOM
-
2026-06-08days on market $139,900 Active 46 DOM
-
2026-06-07days on market $139,900 Active 45 DOM
-
2026-06-02days on market $139,900 Active 40 DOM
-
2026-06-01days on market $139,900 Active 39 DOM
-
2026-05-31days on market $139,900 Active 38 DOM
-
2026-05-30days on market $139,900 Active 37 DOM
-
2026-05-14price $139,900
-
2026-04-23$149,900 Active
ⓘ Source: listings_history table (triggers on properties + properties_extension) + one-shot
backfill from property_details.listing_events for pre-trigger history.
Tax reassessment forecast IN · Partial reset (capped growth)
- Current annual tax
- $1,672 · $139/mo
- Projected year-2 tax
- $1,672 · $139/mo
- Expected delta
- $0/yr ($0/mo · 0.0%)
ⓘ Screening estimate from a state-policy table — verify with the county assessor before closing.
Climate risk First Street
- Flood 1/10 Low FEMA zone X (unshaded) · 0% chance over 30 yrs
- Wildfire 1/10 Low
- Heat 5/10 Major 7 d/yr ≥106°F today · 19 d/yr by 30 yrs out
- Wind 2/10 Low 4% chance of damaging wind over 30 yrs
- Air quality 4/10 Moderate 3 unhealthy d/yr today · 5 by 30 yrs out
Nearby sold comps map
Loading sold comps map…
Walkable amenities ~0.75 mi
Loading nearby amenities…
Taxation est. · year 1
- Rental income
- $9,798
- − Mortgage interest
- −$7,837
- − Property taxes
- −$1,672
- − Insurance
- −$700
- − Repairs & maintenance
- −$784
- − Management
- −$784
- − Depreciation
- −$4,070
- Taxable loss
- −$6,048
- Est. tax savings @ 24.0%
- +$1,451
- After-tax cash flow
- $-1,984/yr
For passive investors: Depreciation is non-cash, so a rental often shows a tax loss while cash-flowing — sheltering income. Rental losses are passive: they offset passive income freely, and up to $25,000/yr can offset ordinary (W-2) income if you actively participate and your MAGI is under $100k (phasing out to $0 by $150k); unused losses carry forward. On sale, claimed depreciation is recaptured at up to 25%, and gains may owe capital-gains tax (a 1031 exchange can defer both). Figures are a year-1 estimate at your 24.0% rate — not tax advice; consult a CPA.
Schools (NCES district)
- District
- Evansville Vanderburgh School Corporation
- NCES district ID
- 1803450
- Math proficiency
- 36% ▼ -7.00%
- Reading proficiency
- 43% ▼ -3.00%
- Median HH income
- $43,270
- Composite
- 33.41/100
- National rank
- #5471
- State rank
- #153 of 301 in IN
Livability — Evansville
- Score
- 63/100
- State rank
- #416
- US rank
- #15047
Category grades
Schools grade is shown separately in the Schools card above.
Census & demographics
- Census place
- Evansville, IN
- County
- Vanderburgh County · 146,793 people
- City population
- 146,793
- Metro
- Evansville, IN-KY
- Population (ZIP)
- 18,309
- Household income
- $47,292
- Rent vs Own
- Severe rent burden
- 722.0
Population outlook (Vanderburgh County) Hauer SSP2
- Today (2025)
- 187,038 people
- By 2030
- 188,907 · +1.0%
- By 2040
- 190,272 · +1.7%
- By 2050
- 188,871 · +1.0%
- By 2075
- 180,751 · -3.4%
- By 2100
- 163,015 · -12.8%
Race, ethnicity, and origin ACS 2023
- Neighborhood character
- Predominantly White (83%)
- Race & ethnicity
- White 83% Two or more races 7% Black 6% Hispanic / Latino 4%
- Common ancestry
- Scotch-Irish 2% Lithuanian 1% Slovak 1%
- Foreign-born
- 2% · Canada, China
- Languages at home
- 97% English-only · Spanish 3%
Political lean MEDSL · Vanderburgh
- 2024 margin
- R (+12.7) · D 43.0% · R 55.6% · Other 1.4%
- 2008→2024 swing
- -15.1pp toward R · 2008: 2.5pp · 2024: -12.7pp
- All cycles
- 2024: R+12.7 2020: R+9.6 2016: R+16.9 2012: R+10.8 2008: D+2.5
Not yet ingested
- Civics
- —
Market trends
- HPI YoY
- ▼ -91.84%
- Current HPI
- 217.586
- Rent YoY
- —
- Metro
- Evansville, IN-KY
- State GDP YoY
- ▲ 2.90%
- F500 in state
- 18
Industry mix (Fortune 500 HQ in IN)
| Industry | F500 HQs | Revenue |
|---|---|---|
| Industrial Machinery | 2 | $37B |
|
||
| Healthcare | 1 | $177B |
|
||
| Pharmaceuticals | 1 | $45B |
|
||
| Metals / Steel | 1 | $18B |
|
||
| Agriculture | 1 | $17B |
|
||
| Packaging | 1 | $12B |
|
||
Price history
-6.7% since first listed2 events — show timeline
- 2026-05-14 Price Changed $139,900 IRMLS
- 2026-04-23 Listed $149,900 IRMLS
Property tax history
+8.3%/yrLatest (2024): $1,672 · +246.9% YoY. Source: county tax records.
Cash-flow waterfall
monthlySold comps — $/sqft
last 12 mo · ≤1 miLoading sold comps…