 Triplex
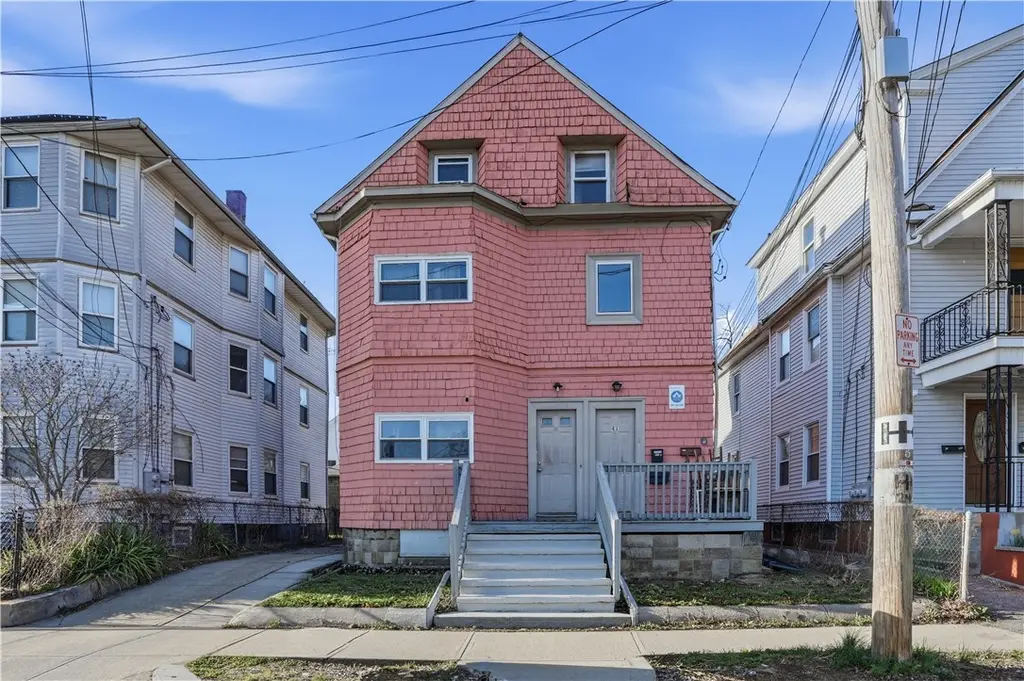
41 Carolina Ave · Providence, RI
Flood risk 1/10 · Minimal
- FEMA flood zone
- X (unshaded)
- Chance of flooding over 30 yrs
- 0.0%
- Est. flood insurance / yr
- $473 – $860
Fire risk 1/10 · Minimal
- Est. fire insurance / yr
- $835 – $1,551
Heat risk 5/10 · Moderate
- Hot days now (above 97°F)
- 7 days/yr
- Hot days in 30 yrs
- 15 days/yr
Wind risk 6/10 · Moderate
- Chance of severe wind over 30 yrs
- 74.0%
Air-quality risk 2/10 · Minimal
- Unhealthy air days now
- 1 days/yr
- Unhealthy air days in 30 yrs
- 2 days/yr
Risk factors via First Street. Map © Google.
Why this score? — see what drove the C+ grade
The composite is a weighted blend of 9 inputs, each scored 0–100. Each bar is that input's sub-score; the figure is the points it added to the 100-point composite (weight × sub-score).
- Cash flow +30.0/30.0
- DSCR +10.0/10.0
- 1% rule +7.9/10.0
- Livability +4.2/5.0
- ARV discount +4.0/15.0
- Rent growth +3.4/5.0
- Condition / age +2.5/5.0
- Schools +1.0/10.0
- Appreciation +0.0/10.0
$625,000
🖨 Deal sheet 📄 Offer letter ✓ Due diligence
Multi-family units
County records classify this as Multi-Family (2-4 Unit). Listing-text estimate: 3 units. confirmed
Listing remarks MLS
Great investment opportunity in Providence! This well-maintained 3-unit property is ideal for investors or owner-occupants seeking rental income. Each unit offers comfortable living space with solid upkeep throughout, providing immediate usability and long-term potential. The property features off-street parking for added convenience and an unfinished basement offering storage or future expansion possibilities. Located in the desirable Washington Park neighborhood, this property offers easy access to everyday amenities and a convenient urban lifestyle. Just minutes to Downtown Providence for dining, nightlife, and cultural attractions. Enjoy nearby outdoor recreation at Roger Williams Park. Close to Interstate 95 and Route 10 for easy commuting, and near Rhode Island Hospital and Hasbro Children's Hospital. All utilities separate, with tenants covering their own utilities. New boiler 2025-2026 for all 3, along with replaced 1st and 2nd floor windows 3-4 years ago.
Key facts
- Unfinished basement
- Off-street parking
- 3,485 sq ft lot
Tags
Neighborhood map
What this means for you Summary
Snapshot
- This is a 3 × 5-bed/3.0-bath units multifamily listed at $625k.
Deal economics
- At list price, monthly cash flow is $3k ($31k/yr) — positive. Per door: $853/mo.
- The deal already cash-flows at list — no discount required.
- Meets the 1% rule at list price ($8k rent vs $625k).
- Recommended offer: $588k (6.0% below list) — sets the bar for market timing.
- Cap rate 11.2% vs local median 4.2% in Providence — top-decile yield for the area; either an underpriced asset or a hidden risk that comps aren't pricing in. Stress-test before assuming the spread holds.
Location & tenants
- Location reads 84/100 on livability (#2 in RI, #794 nationally) — a professional / high-income tenant draw. Strengths: amenities A+, commute A+, housing A+; Watch: employment C-, schools F.
- Providence (urban): math 8% / reading 16% proficiency, ranked #34 of 39 in RI (top 87%) — low school quality limits family demand, transient renter base, plan for 1-2y turnover; 79% free/reduced lunch — lower-income household profile, screen leases tightly.
- Market conditions: Rents rising (+3.5%/yr); 75 active listings in the ZIP; 776 units permitted in Providence County in 2024 (229 in 5+ unit buildings).
- At $8,060/mo this rent would consume 154% of the median local household income ($63k/yr) (locally 1220% of renters already pay >50% of income on rent) — very limited rent-growth headroom before tenants either downsize or default.
Forward outlook
- Local home prices are declining (-3.0%/yr); year-one equity from $4k of loan paydown is wiped out by about $19k of value loss. Plan a longer hold.
- Providence County population projected at +5% by 2050 — modest demand growth; plan on rents tracking national, not racing it.
- At projected returns (-3.0% appreciation + 3.5% rent growth), your $175k cash investment doubles in ~7 years — after that, you're playing with house money.
Negotiation context
- It's been on market 65 days — a 6% lower offer ($588k) is reasonable based on typical stale-listing flexibility.
- 10 sale attempts since 30y ago with the ask held roughly flat each time — persistent listings suggest the price (not the market) is what's stuck; bring a comps-based counter.
- Current owner paid $30k; list at $625k implies a 1983% gain — meaningful room to come down on a strong offer.
Risks & watch-outs
- Watch-outs: built in 1920 — expect roof / HVAC / electrical / plumbing capex.
- Climate carrying-cost: major wind risk, 74% chance of damaging wind over 30y; extreme-heat days projected 7→15/yr by 2055 (HVAC capex compounding) — expect insurance premiums to compound above CPI over the hold.
Questions for the listing agent
- It's been on market 65 days. Have you received any prior offers? Is the seller open to a 6% concession, seller financing, or rate buy-down credit?
- Can we see the unit-by-unit rent roll, current vacancy, and any below-market leases? What's the average tenancy length?
- What capital expenditures (roof, boiler, parking lot, exteriors) have been made in the last 5 years, and what's planned in the next 2?
- Built in 1920 — when were the roof, HVAC, electrical panel, plumbing, and water heater last replaced?
- Why hasn't it sold? Are there any deal-killer items the seller is aware of (foundation, flood, title, zoning, code violations)?
- Is there a deadline driving the sale (1031 exchange, divorce, estate, relocation)? That informs how much negotiation room exists.
- Schools are F-rated, which usually means shorter tenancies and higher turnover. Who's the typical renter profile here, and what's been the actual vacancy rate?
- What's the average days-on-market for RENTAL listings here right now (not sales)? A rising rental-DOM trend means longer vacancies and softer asking-rent achievability than the comps imply.
- What's the recent tenant-quality profile in this submarket — average credit score on applications, eviction rate, late-payment / NSF rate, and stable-employment percentage? A property-management company in the area should have these aggregated.
- How much new apartment / multifamily construction is in the pipeline within 1–3 miles? Heavy new supply (>2% of stock underway) typically softens rents 12–24 months out; light construction supports rent growth.
Investment metrics
- 1% rule
- 1.29% ✓
- Cap rate
- 11.21%
- Cash-on-cash
- 17.56%
- DSCR
- 1.78
- GRM
- 6.5
CMA / ARV
- ARV (median comp)
- $580,000
- List price
- $625,000
- Delta
- 7.76%
- Verdict
- FAIR
- Comps
- 14 within 1.0 mi
Projected returns pro-forma
-3.0% appreciation · 3.45% rent growth · sell at horizon
- IRR
- 9.4%
- Equity multiple
- 1.37×
- Total profit
- $65,259
- Equity at exit
- $93,190
- IRR
- 18.9%
- Equity multiple
- 2.61×
- Total profit
- $281,193
- Equity at exit
- $54,039
Cash invested: $175,000 (down + closing). Projections, not guarantees.
Landlord ↔ Tenant lean methodology
- Overall (STATE)
- 31 Tenant-Leaning
- State Rhode Island
- 31 Tenant-Leaning · D+8
- County
- — inherits STATE
- City
- — inherits STATE
ZIP-level market 02905
- Rents YoY
- 3.5%
- Active inventory
- 75
- Price-to-rent
- 19.4×
Monthly cashflow live
- Estimated rent
- $8,060 medium interval (Pro) →
- Mortgage (P&I)
- −$3,278
- Tax from tax record
- −$269 /mo · $3,230/yr
- Insurance
- −$260
- HOA
- −$0
- Vacancy / Maint / Mgmt
- −$1,693
- Net cashflow
- $2,560
Break-even live
3-unit breakdown (identical units grouped — click to expand)
| Units | Beds | Baths | Est. rent |
|---|---|---|---|
| 3× units | 5 | 3 | $8,061 |
| #1 | 5 | 3 | $2,687 |
| #2 | 5 | 3 | $2,687 |
| #3 | 5 | 3 | $2,687 |
| Total (3 units) | $8,060 | ||
UW: 25.0% down · 7.5% · 30yr · 1.5% tax · 5.0% vac · 8.0% maint · 8.0% mgmt
Financing live
Cash to close
- Down payment
- $156,250
- Closing costs
- $18,750
- Reserves months
- —
- Total cash needed
- —
Loan-product check · same deal, 3 products live
Conventional
25% down · 7.5% · 30yr
- Down + closing
- —
- Monthly P&I
- —
- Monthly cashflow
- —
- DSCR
- —
- Eligible?
- —
Personal DTI + credit; lowest rate.
DSCR
20% down · 8.5% · 30yr
- Down + closing
- —
- Monthly P&I
- —
- Monthly cashflow
- —
- DSCR
- —
- Eligible?
- —
No personal income docs; deal must DSCR.
Hard money
10% down · 12.0% · 12mo
- Down + closing
- —
- Monthly P&I
- —
- Monthly cashflow
- —
- DSCR
- —
- Eligible?
- —
Short-term bridge; refi at stabilization.
Listing history 41 events
-
2026-06-17days on market $625,000 Active 65 DOM
-
2026-06-16days on market $625,000 Active 64 DOM
-
2026-06-15days on market $625,000 Active 63 DOM
-
2026-06-13days on market $625,000 Active 61 DOM
-
2026-06-09days on market $625,000 Active 57 DOM
-
2026-06-08days on market $625,000 Active 56 DOM
-
2026-06-07days on market $625,000 Active 55 DOM
-
2026-06-05days on market $625,000 Active 52 DOM
-
2026-06-03days on market $625,000 Active 51 DOM
-
2026-06-02days on market $625,000 Active 50 DOM
-
2026-06-01days on market $625,000 Active 49 DOM
-
2026-05-31days on market $625,000 Active 48 DOM
-
2026-05-13price $625,000 978-char remark
Show marketing remark (978 chars)
Great investment opportunity in Providence! This well-maintained 3-unit property is ideal for investors or owner-occupants seeking rental income. Each unit offers comfortable living space with solid upkeep throughout, providing immediate usability and long-term potential. The property features off-street parking for added convenience and an unfinished basement offering storage or future expansion possibilities. Located in the desirable Washington Park neighborhood, this property offers easy access to everyday amenities and a convenient urban lifestyle. Just minutes to Downtown Providence for dining, nightlife, and cultural attractions. Enjoy nearby outdoor recreation at Roger Williams Park. Close to Interstate 95 and Route 10 for easy commuting, and near Rhode Island Hospital and Hasbro Children's Hospital. All utilities separate, with tenants covering their own utilities. New boiler 2025-2026 for all 3, along with replaced 1st and 2nd floor windows 3-4 years ago.
-
2026-04-13$650,000 Active 978-char remark
Show marketing remark (978 chars)
Great investment opportunity in Providence! This well-maintained 3-unit property is ideal for investors or owner-occupants seeking rental income. Each unit offers comfortable living space with solid upkeep throughout, providing immediate usability and long-term potential. The property features off-street parking for added convenience and an unfinished basement offering storage or future expansion possibilities. Located in the desirable Washington Park neighborhood, this property offers easy access to everyday amenities and a convenient urban lifestyle. Just minutes to Downtown Providence for dining, nightlife, and cultural attractions. Enjoy nearby outdoor recreation at Roger Williams Park. Close to Interstate 95 and Route 10 for easy commuting, and near Rhode Island Hospital and Hasbro Children's Hospital. All utilities separate, with tenants covering their own utilities. New boiler 2025-2026 for all 3, along with replaced 1st and 2nd floor windows 3-4 years ago.
-
2019-11-26soldstatus $30,000
-
2016-11-08price $269,927
-
2016-05-31soldstatus $149,000 Sold
-
2016-05-31soldstatus $149,000
-
2016-02-24status Pending
-
2016-02-04$159,900 Active - New
-
2016-02-04historical
-
2016-01-22price $174,900
-
2016-01-04price $179,900
-
2015-12-05price $189,900
-
2015-11-12$199,900 Active - New
-
2010-02-05soldstatus $78,000
-
2009-12-04historical
-
2009-11-30historical
-
2009-11-19$75,000
-
2009-05-21$130,000
-
2007-12-29historical
-
2007-06-29$239,927
-
2007-06-22historical
-
2006-12-22$259,927
-
2006-09-25historical
-
2006-08-16$259,927
-
2006-08-15historical
-
2006-02-15$289,927
-
2004-08-18soldstatus $215,500
-
1996-07-23historical
-
1996-04-01$84,927
ⓘ Source: listings_history table (triggers on properties + properties_extension) + one-shot
backfill from property_details.listing_events for pre-trigger history.
Tax reassessment forecast RI · Partial reset (capped growth)
- Current annual tax
- $3,230 · $269/mo
- Projected year-2 tax
- $6,709 · $559/mo
- Expected delta
- +$3,479/yr (+$290/mo · 107.7%)
ⓘ Screening estimate from a state-policy table — verify with the county assessor before closing.
Climate risk First Street
- Flood 1/10 Low FEMA zone X (unshaded) · 0% chance over 30 yrs
- Wildfire 1/10 Low
- Heat 5/10 Major 7 d/yr ≥97°F today · 15 d/yr by 30 yrs out
- Wind 6/10 Major 74% chance of damaging wind over 30 yrs
- Air quality 2/10 Low 1 unhealthy d/yr today · 2 by 30 yrs out
Nearby sold comps map
Loading sold comps map…
Walkable amenities ~0.75 mi
Loading nearby amenities…
Taxation est. · year 1
- Rental income
- $96,720
- − Mortgage interest
- −$35,010
- − Property taxes
- −$3,230
- − Insurance
- −$3,125
- − Repairs & maintenance
- −$7,738
- − Management
- −$7,738
- − Depreciation
- −$18,182
- Taxable income
- $21,698
- Est. tax owed @ 24.0%
- −$5,208
- After-tax cash flow
- $25,515/yr
For passive investors: Depreciation is non-cash, so a rental often shows a tax loss while cash-flowing — sheltering income. Rental losses are passive: they offset passive income freely, and up to $25,000/yr can offset ordinary (W-2) income if you actively participate and your MAGI is under $100k (phasing out to $0 by $150k); unused losses carry forward. On sale, claimed depreciation is recaptured at up to 25%, and gains may owe capital-gains tax (a 1031 exchange can defer both). Figures are a year-1 estimate at your 24.0% rate — not tax advice; consult a CPA.
Schools (NCES district)
- District
- Providence
- NCES district ID
- 4400900
- Math proficiency
- 8% ▼ -4.00%
- Reading proficiency
- 16% ▼ -2.00%
- Median HH income
- $38,197
- Composite
- 10.12/100
- National rank
- #9803
- State rank
- #34 of 39 in RI
Livability — Providence
- Score
- 84/100
- State rank
- #2
- US rank
- #794
Category grades
Schools grade is shown separately in the Schools card above.
Census & demographics
- Census place
- Providence, RI
- County
- Providence County · 548,917 people
- City population
- 212,734
- Metro
- Providence-Warwick, RI-MA
- Population (ZIP)
- 25,012
- Household income
- $62,908
- Rent vs Own
- Severe rent burden
- 1220.0
Population outlook (Providence County) Hauer SSP2
- Today (2025)
- 653,469 people
- By 2030
- 660,819 · +1.1%
- By 2040
- 672,747 · +3.0%
- By 2050
- 683,741 · +4.6%
- By 2075
- 720,435 · +10.2%
- By 2100
- 741,582 · +13.5%
Race, ethnicity, and origin ACS 2023
- Neighborhood character
- Diverse neighborhood (Simpson 0.67)
- Race & ethnicity
- Hispanic / Latino 41% White 38% Black 15% Two or more races 15% Asian 3%
- Hispanic origin (detail)
- Puerto Rican 5% Dominican 30%
- Common ancestry
- Russian 4% Lithuanian 3% Romanian 2%
- Foreign-born
- 30% · Canada, China
- Languages at home
- 57% English-only · Spanish 34% Other Indo-European 4% French/Haitian/Cajun 1%
Political lean MEDSL · Providence
- 2024 margin
- D (+14.4) · D 56.1% · R 41.7% · Other 2.2%
- 2008→2024 swing
- -20.0pp toward R · 2008: 34.4pp · 2024: 14.4pp
- All cycles
- 2024: D+14.4 2020: D+22.9 2016: D+21.2 2012: D+34.9 2008: D+34.4
Not yet ingested
- Civics
- —
Market trends
- HPI YoY
- ▼ -396.84%
- Current HPI
- 387.2525
- Rent YoY
- ▲ 3.45%
- Metro
- Providence-Warwick, RI-MA
- State GDP YoY
- ▲ 2.25%
- F500 in state
- 10
Industry mix (Fortune 500 HQ in RI)
| Industry | F500 HQs | Revenue |
|---|---|---|
| Healthcare | 1 | $373B |
|
||
| Food Distribution | 1 | $31B |
|
||
| Aerospace / Defense | 1 | $14B |
|
||
| Financial Services | 1 | $8B |
|
||
| Consumer Goods | 1 | $4B |
|
||
Price history
+635.9% since first listed29 events — show timeline
- 2026-05-13 Price Changed $625,000 RIS
- 2026-04-13 Listed $650,000 RIS
- 2019-11-26 Sold (Public Records) $30,000 Public Records
- 2016-11-08 Price Changed $269,927 RIS
- 2016-05-31 Sold (Public Records) $149,000 Public Records
- 2016-05-31 Sold (MLS) $149,000 RIS
- 2016-02-24 Pending — RIS
- 2016-02-04 Listed $159,900 RIS
- 2016-02-04 Listing Removed — RIS
- 2016-01-22 Price Changed $174,900 RIS
- 2016-01-04 Price Changed $179,900 RIS
- 2015-12-05 Price Changed $189,900 RIS
- 2015-11-12 Listed $199,900 RIS
- 2010-02-05 Sold (MLS) $78,000 RIS
- 2009-12-04 Listing Removed — RIS
- 2009-11-30 Listing Removed — RIS
- 2009-11-19 Listed $75,000 RIS
- 2009-05-21 Listed $130,000 RIS
- 2007-12-29 Listing Removed — RIS
- 2007-06-29 Listed $239,927 RIS
- 2007-06-22 Listing Removed — RIS
- 2006-12-22 Listed $259,927 RIS
- 2006-09-25 Listing Removed — RIS
- 2006-08-16 Listed $259,927 RIS
- 2006-08-15 Listing Removed — RIS
- 2006-02-15 Listed $289,927 RIS
- 2004-08-18 Sold (Public Records) $215,500 Public Records
- 1996-07-23 Listing Removed — RIS
- 1996-04-01 Listed $84,927 RIS
Property tax history
-0.9%/yrLatest (2025): $3,230 · -40.7% YoY. Source: county tax records.
Cash-flow waterfall
monthlySold comps — $/sqft
last 12 mo · ≤1 miLoading sold comps…