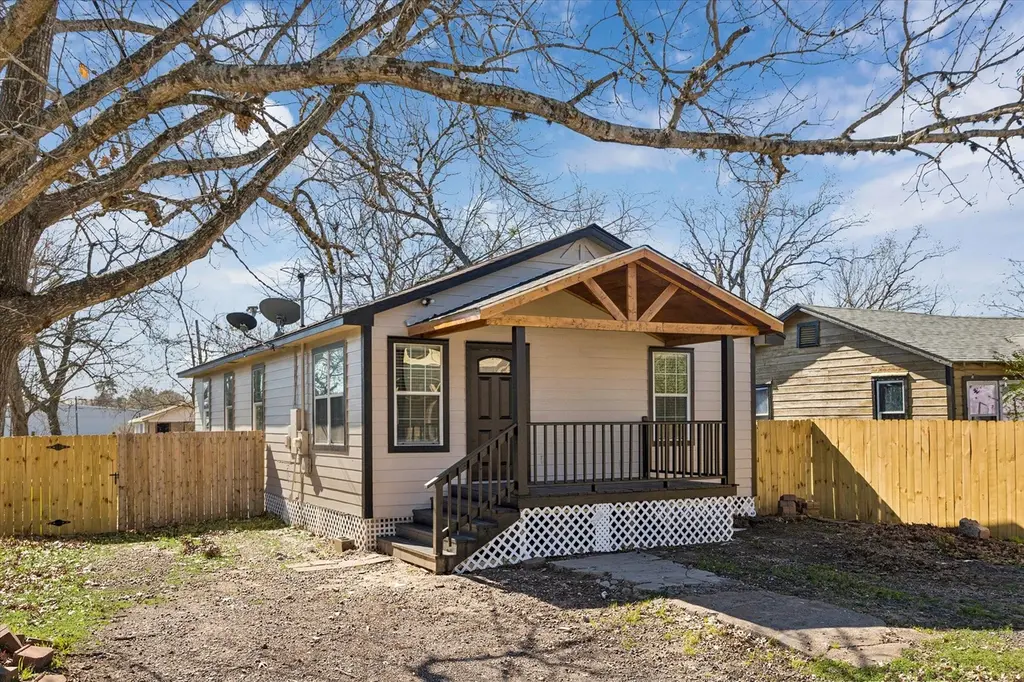
815 Fields St · Richmond, TX
Flood risk 1/10 · Minimal
- FEMA flood zone
- X (unshaded)
- Chance of flooding over 30 yrs
- 0.0%
- Est. flood insurance / yr
- $507 – $1,088
Fire risk 3/10 · Minor
- Est. fire insurance / yr
- $1,222 – $2,270
Heat risk 9/10 · Severe
- Hot days now (above 110°F)
- 7 days/yr
- Hot days in 30 yrs
- 24 days/yr
Wind risk 9/10 · Severe
- Chance of severe wind over 30 yrs
- 99.0%
Air-quality risk 2/10 · Minimal
- Unhealthy air days now
- 1 days/yr
- Unhealthy air days in 30 yrs
- 1 days/yr
Risk factors via First Street. Map © Google.
Why this score? — see what drove the B- grade
The composite is a weighted blend of 9 inputs, each scored 0–100. Each bar is that input's sub-score; the figure is the points it added to the 100-point composite (weight × sub-score).
- Cash flow +29.9/30.0
- DSCR +10.0/10.0
- 1% rule +9.1/10.0
- ARV discount +6.3/15.0
- Schools +4.6/10.0
- Livability +3.5/5.0
- Condition / age +2.5/5.0
- Rent growth +2.0/5.0
- Appreciation +0.0/10.0
$179,000
🖨 Deal sheet (PDF) 📄 Offer letter ✓ Due diligence
Listing remarks MLS
Cute 3 bedroom, 2 bath home with an open floor plan. Kitchen with breakfast nook, opens up into living room, formal dining could be 4th bedroom if needing more room. Rooms are nice size. Back yard has privacy fencing.
Key facts
- 4,499 sq ft lot
- Built 2002
- Listed 109 days
Neighborhood map
What this means for you Summary
Snapshot
- This is a 4-bed/2.0-bath single-family listed at $179k.
Deal economics
- At list price, monthly cash flow is $663 ($8k/yr) — positive.
- The deal already cash-flows at list — no discount required.
- Meets the 1% rule at list price ($3k rent vs $179k).
- Recommended offer: $163k (9.0% below list) — sets the bar for market timing.
- Cap rate 10.7% vs local median 2.6% in Richmond — top-decile yield for the area; either an underpriced asset or a hidden risk that comps aren't pricing in. Stress-test before assuming the spread holds.
Location & tenants
- Location reads 70/100 on livability (#363 in TX) — a middle-class / working-renter tenant base. Strengths: cost of living A+, housing A+, health & safety B+; Watch: schools C-, crime C-, amenities F.
- Lamar CISD (suburban): math 50% / reading 53% proficiency, ranked #116 of 826 in TX (top 14%) — acceptable for families but not a draw, mixed tenant base, ~2y average lease.
- Market conditions: Rents soft (-1.8%/yr); 1332 active listings in the ZIP; 2 comparable units currently listed for rent nearby; solid renter incomes; 12,093 units permitted in Fort Bend County in 2024 (815 in 5+ unit buildings).
Forward outlook
- Local home prices are declining (-3.0%/yr); year-one equity from $1k of loan paydown is wiped out by about $5k of value loss. Plan a longer hold.
- Fort Bend County population projected at +75% by 2050 — long-run rental-demand tailwind backs the buy-and-hold thesis.
Negotiation context
- It's been on market 110 days — a 9% lower offer ($163k) is reasonable based on typical stale-listing flexibility.
- 2 sale attempts since 10y ago; this cycle's ask has dropped $10k (5%) from the opening price — seller is motivated, your offer sets the floor, not the list.
Risks & watch-outs
- Climate carrying-cost: severe wind risk, 99% chance of damaging wind over 30y; extreme-heat days projected 7→24/yr by 2055 (HVAC capex compounding) — expect insurance premiums to compound above CPI over the hold.
Questions for the listing agent
- It's been on market 110 days. Have you received any prior offers? Is the seller open to a 9% concession, seller financing, or rate buy-down credit?
- Why hasn't it sold? Are there any deal-killer items the seller is aware of (foundation, flood, title, zoning, code violations)?
- Is there a deadline driving the sale (1031 exchange, divorce, estate, relocation)? That informs how much negotiation room exists.
- What's the average days-on-market for RENTAL listings here right now (not sales)? A rising rental-DOM trend means longer vacancies and softer asking-rent achievability than the comps imply.
- What's the recent tenant-quality profile in this submarket — average credit score on applications, eviction rate, late-payment / NSF rate, and stable-employment percentage? A property-management company in the area should have these aggregated.
- How much new for-sale + rental construction is in the pipeline within 1–3 miles? Heavy new supply typically softens prices + rents 12–24 months out; constrained supply supports both.
Investment metrics
- 1% rule
- 1.41% ✓
- Cap rate
- 10.74%
- Cash-on-cash
- 15.87%
- DSCR
- 1.71
- GRM
- 5.9
CMA / ARV
- ARV (median comp)
- $174,246
- List price
- $179,000
- Delta
- 2.73%
- Verdict
- FAIR
- Comps
- 20 within 1.0 mi
Show comp detail 9 sales within ~0.75 mi
| Address | Dist | Beds/Ba | Sqft | Sold | Price | $/sf | Match |
|---|---|---|---|---|---|---|---|
| 508 Center St | 0.14mi | 4/2.0 | 1,128 (-2%) | 24mo | $220,000 | $195 | 70 |
| 806 Center St | 0.26mi | 4/2.0 | 1,152 (0%) | 22mo | $184,900 | $161 | 69 |
| 419 Clay St | 0.39mi | 3/2.0 (-1) | 1,051 (-9%) | 3mo | $249,000 | $237 | 59 |
| 406 Collins Rd | 0.28mi | 4/2.0 | 1,279 (+11%) | 12mo | $150,000 | $117 | 58 |
| 1202 Fort St | 0.51mi | 3/2.0 (-1) | 1,217 (+6%) | 11mo | $250,000 | $205 | 53 |
| 1716 Carver Ave | 0.48mi | 3/2.0 (-1) | 1,190 (+3%) | 22mo | $160,000 | $134 | 48 |
| 1206 Fort St | 0.50mi | 3/2.0 (-1) | 1,241 (+8%) | 21mo | $240,000 | $193 | 41 |
| 809 Barrett St | 0.74mi | 3/1.0 (-1) | 1,134 (-2%) | 16mo | $135,000 | $119 | 41 |
| 1105 Yorktown St | 0.68mi | 3/1.0 (-1) | 988 (-14%) | 1mo | $164,900 | $167 | 35 |
Match score weights: distance 35% · size 25% · config 20% · recency 20%. Top-matched comps best support the ARV.
Projected returns pro-forma
-3.0% appreciation · 0.0% rent growth · sell at horizon
- IRR
- 3.2%
- Equity multiple
- 1.12×
- Total profit
- $5,929
- Equity at exit
- $26,689
- IRR
- 9.5%
- Equity multiple
- 1.63×
- Total profit
- $31,405
- Equity at exit
- $15,477
Cash invested: $50,120 (down + closing). Projections, not guarantees.
Landlord ↔ Tenant lean methodology
- Overall (STATE)
- 87 Strongly Landlord-Friendly
- State Texas
- 87 Strongly Landlord-Friendly · R+5
- County
- — inherits STATE
- City
- — inherits STATE
ZIP-level market 77469
- Home prices YoY
- -25.1%
- Rents YoY
- -1.8%
- Active inventory
- 1332
- Price-to-rent
- 5.9×
Monthly cashflow live
- Estimated rent
- $2,515 medium interval (Pro) →
- Mortgage (P&I)
- −$939
- Tax from tax record
- −$311 /mo · $3,733/yr
- Insurance
- −$75
- HOA
- −$0
- Vacancy / Maint / Mgmt
- −$528
- Net cashflow
- $663
Break-even live
Sensitivity live
| Price | -10% $764 | -5% $713 | +0% $663 | +5% $612 | +10% $561 |
|---|---|---|---|---|---|
| Rent | -10% $464 | -5% $563 | +0% $663 | +5% $762 | +10% $862 |
| Rate | -1.0pp $753 | -0.5pp $708 | base $663 | +0.5pp $616 | +1.0pp $569 |
UW: 25.0% down · 7.5% · 30yr · 1.5% tax · 5.0% vac · 8.0% maint · 8.0% mgmt
Financing live
Cash to close
- Down payment
- $44,750
- Closing costs
- $5,370
- Reserves months
- —
- Total cash needed
- —
Loan-product check · same deal, 3 products live
Conventional
25% down · 7.5% · 30yr
- Down + closing
- —
- Monthly P&I
- —
- Monthly cashflow
- —
- DSCR
- —
- Eligible?
- —
Personal DTI + credit; lowest rate.
DSCR
20% down · 8.5% · 30yr
- Down + closing
- —
- Monthly P&I
- —
- Monthly cashflow
- —
- DSCR
- —
- Eligible?
- —
No personal income docs; deal must DSCR.
Hard money
10% down · 12.0% · 12mo
- Down + closing
- —
- Monthly P&I
- —
- Monthly cashflow
- —
- DSCR
- —
- Eligible?
- —
Short-term bridge; refi at stabilization.
Rent comps 2 comps
| Address | Beds | Baths | Sqft | Rent | $/sqft | DOM | Units | Dist |
|---|---|---|---|---|---|---|---|---|
| 1108 Fort St Unit 1108 Richmond, TX | 3.0 | 1.0 | 1000 | $1,450 | $1.45 | 17d | 1 | 0.48mi |
| 4932 Vancouver Blvd Richmond, TX | 3.0 | 2.0 | 1321 | $3,500 | $2.65 | 13d | 1 | 1.28mi |
Listing history 23 events
-
2026-06-18days on market $179,000 Active 110 DOM
-
2026-06-17days on market $179,000 Active 109 DOM
-
2026-06-16days on market $179,000 Active 108 DOM
-
2026-06-15days on market $179,000 Active 107 DOM
-
2026-06-13days on market $179,000 Active 105 DOM
-
2026-06-10days on market $179,000 Active 101 DOM
-
2026-06-08days on market $179,000 Active 100 DOM
-
2026-06-07days on market $179,000 Active 99 DOM
-
2026-06-04days on market $179,000 Active 96 DOM
-
2026-06-03days on market $179,000 Active 95 DOM
-
2026-06-02days on market $179,000 Active 94 DOM
-
2026-06-01days on market $179,000 Active 93 DOM
-
2026-05-31days on market $179,000 Active 92 DOM
-
2026-03-25price $179,000
-
2026-02-28$189,000 Active
-
2022-11-28soldstatus
-
2022-03-02soldstatus
-
2016-12-29soldstatus
-
2016-12-28soldstatus Sold 217-char remark
Show marketing remark (217 chars)
Cute 3 bedroom, 2 bath home with an open floor plan. Kitchen with breakfast nook, opens up into living room, formal dining could be 4th bedroom if needing more room. Rooms are nice size. Back yard has privacy fencing.
-
2016-12-06status Pending, Continue to Show 217-char remark
Show marketing remark (217 chars)
Cute 3 bedroom, 2 bath home with an open floor plan. Kitchen with breakfast nook, opens up into living room, formal dining could be 4th bedroom if needing more room. Rooms are nice size. Back yard has privacy fencing.
-
2016-11-25status Option Pending 217-char remark
Show marketing remark (217 chars)
Cute 3 bedroom, 2 bath home with an open floor plan. Kitchen with breakfast nook, opens up into living room, formal dining could be 4th bedroom if needing more room. Rooms are nice size. Back yard has privacy fencing.
-
2016-11-09$81,500 Active 217-char remark
Show marketing remark (217 chars)
Cute 3 bedroom, 2 bath home with an open floor plan. Kitchen with breakfast nook, opens up into living room, formal dining could be 4th bedroom if needing more room. Rooms are nice size. Back yard has privacy fencing.
-
2002-04-08soldstatus
ⓘ Source: listings_history table (triggers on properties + properties_extension) + one-shot
backfill from property_details.listing_events for pre-trigger history.
Tax reassessment forecast TX · Resets to sale price
- Current annual tax
- $3,733 · $311/mo
- Projected year-2 tax
- $3,733 · $311/mo
- Expected delta
- $0/yr ($0/mo · -0.0%)
ⓘ Screening estimate from a state-policy table — verify with the county assessor before closing.
Climate risk First Street
- Flood 1/10 Low FEMA zone X (unshaded) · 0% chance over 30 yrs
- Wildfire 3/10 Moderate
- Heat 9/10 Extreme 7 d/yr ≥110°F today · 24 d/yr by 30 yrs out
- Wind 9/10 Extreme 99% chance of damaging wind over 30 yrs
- Air quality 2/10 Low 1 unhealthy d/yr today · 1 by 30 yrs out
Nearby sold comps map
Loading sold comps map…
Walkable amenities ~0.75 mi
Loading nearby amenities…
Taxation est. · year 1
- Rental income
- $30,185
- − Mortgage interest
- −$10,027
- − Property taxes
- −$3,733
- − Insurance
- −$895
- − Repairs & maintenance
- −$2,415
- − Management
- −$2,415
- − Depreciation
- −$5,207
- Taxable income
- $5,493
- Est. tax owed @ 24.0%
- −$1,318
- After-tax cash flow
- $6,635/yr
For passive investors: Depreciation is non-cash, so a rental often shows a tax loss while cash-flowing — sheltering income. Rental losses are passive: they offset passive income freely, and up to $25,000/yr can offset ordinary (W-2) income if you actively participate and your MAGI is under $100k (phasing out to $0 by $150k); unused losses carry forward. On sale, claimed depreciation is recaptured at up to 25%, and gains may owe capital-gains tax (a 1031 exchange can defer both). Figures are a year-1 estimate at your 24.0% rate — not tax advice; consult a CPA.
Schools (NCES district)
- District
- Lamar CISD
- NCES district ID
- 4826580
- Math proficiency
- 50% ▼ -12.00%
- Reading proficiency
- 53% ▼ -4.00%
- Median HH income
- $75,213
- Composite
- 46.43/100
- National rank
- #2452
- State rank
- #116 of 826 in TX
Livability — Richmond
- Score
- 70/100
- State rank
- #363
- US rank
- #7780
Category grades
Schools grade is shown separately in the Schools card above.
Census & demographics
- Census place
- Richmond, TX
- County
- Fort Bend County · 836,777 people
- Metro
- Houston-The Woodlands-Sugar Land, TX
- Population (ZIP)
- 69,826
- Household income
- $102,125
- Rent vs Own
- Severe rent burden
- 1292.0
Population outlook (Fort Bend County) Hauer SSP2
- Today (2025)
- 1,004,526 people
- By 2030
- 1,153,104 · +14.8%
- By 2040
- 1,453,718 · +44.7%
- By 2050
- 1,753,781 · +74.6%
- By 2075
- 2,455,772 · +144.5%
- By 2100
- 2,930,528 · +191.7%
Race, ethnicity, and origin ACS 2023
- Neighborhood character
- Highly diverse neighborhood (Simpson 0.76)
- Race & ethnicity
- Hispanic / Latino 29% White 27% Black 25% Two or more races 15% Asian 15%
- Hispanic origin (detail)
- Mexican 21%
- Common ancestry
- Romanian 1% Lithuanian 1%
- Foreign-born
- 24% · Canada, Vietnam, China
- Languages at home
- 65% English-only · Spanish 17% Other Indo-European 7% Other Asian/Pacific 2%
Political lean MEDSL · Fort Bend
- 2024 margin
- Toss-up / Even · D 49.5% · R 47.9% · Other 2.6%
- 2008→2024 swing
- +4.0pp toward D · 2008: -2.4pp · 2024: 1.6pp
- All cycles
- 2024: D+1.6 2020: D+10.6 2016: D+6.6 2012: R+6.8 2008: R+2.4
Not yet ingested
- Civics
- —
Market trends
- HPI YoY
- ▼ -78.66%
- Current HPI
- 234.9892
- Rent YoY
- ▼ -1.81%
- Metro
- Houston-The Woodlands-Sugar Land, TX
- State GDP YoY
- ▲ 3.95%
- F500 in state
- 110
Industry mix (Fortune 500 HQ in TX)
| Industry | F500 HQs | Revenue |
|---|---|---|
| Energy | 16 | $1,198B |
|
||
| Technology | 5 | $198B |
|
||
| Engineering / Construction | 4 | $72B |
|
||
| Energy Services | 3 | $60B |
|
||
| Utilities | 3 | $41B |
|
||
| Healthcare | 2 | $330B |
|
||
Price history
+119.6% since first listed10 events — show timeline
- 2026-03-25 Price Changed $179,000 HARMLS
- 2026-02-28 Listed $189,000 HARMLS
- 2022-11-28 Sold (Public Records) — Public Records
- 2022-03-02 Sold (Public Records) — Public Records
- 2016-12-29 Sold (Public Records) — Public Records
- 2016-12-28 Sold (MLS) — HARMLS
- 2016-12-06 Pending — HARMLS
- 2016-11-25 Pending — HARMLS
- 2016-11-09 Listed $81,500 HARMLS
- 2002-04-08 Sold (Public Records) — Public Records
Property tax history
+6.6%/yrLatest (2025): $3,733 · -27.2% YoY. Source: county tax records.
Cash-flow waterfall
monthlySold comps — $/sqft
last 12 mo · ≤1 miLoading sold comps…