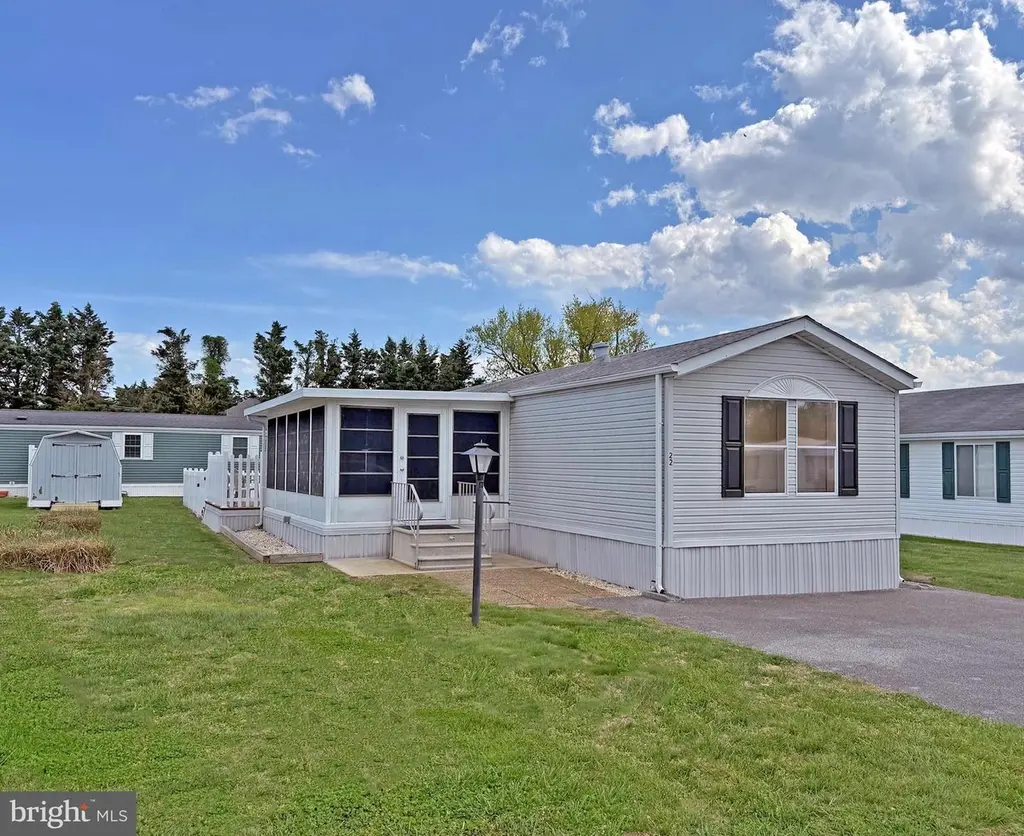
22 Sunnyfield Rd Unit E-13 · Rehoboth Beach, DE
Flood risk 6/10 · Moderate
- FEMA flood zone
- X (shaded)
- Chance of flooding over 30 yrs
- 0.7%
- Est. flood insurance / yr
- $473 – $860
Fire risk 1/10 · Minimal
- Est. fire insurance / yr
- $476 – $884
Heat risk 9/10 · Severe
- Hot days now (above 101°F)
- 7 days/yr
- Hot days in 30 yrs
- 18 days/yr
Wind risk 8/10 · Major
- Chance of severe wind over 30 yrs
- 80.0%
Air-quality risk 2/10 · Minimal
- Unhealthy air days now
- 1 days/yr
- Unhealthy air days in 30 yrs
- 1 days/yr
Risk factors via First Street. Map © Google.
Why this score? — see what drove the B grade
The composite is a weighted blend of 9 inputs, each scored 0–100. Each bar is that input's sub-score; the figure is the points it added to the 100-point composite (weight × sub-score).
- Cash flow +30.0/30.0
- 1% rule +10.0/10.0
- DSCR +10.0/10.0
- ARV discount +7.5/15.0
- Schools +4.2/10.0
- Condition / age +3.8/5.0
- Livability +3.6/5.0
- Rent growth +2.5/5.0
- Appreciation +0.0/10.0
$149,900
🖨 Deal sheet (PDF) 📄 Offer letter ✓ Due diligence
Listing remarks
3 miles to the Rehoboth boardwalk! And the DART Bus Park-n-Ride is just down the road if you don’t feel like hunting for parking at the beach. Make this your year-round home or your vacation get-away! This home features a rare fenced backyard. It also has a larger interior than most other singlewide homes. Plus, there is a 12’x20’ enclosed E-Z-Breeze VinylTech Porch for additional 3-season living space. Open floor plan with vaulted ceilings. The living room adjoins the kitchen, which is next to the dining area. Lots of kitchen cabinet space and a newer fridge. The laundry room has overhead cabinets and a full-size side-by-side washer & dryer set. Split bedroom plan.
Key facts
- Storage shed
- Second deck
- Fenced backyard
Tags
Property features AI
Finance
- Other: Park name: Silver View Farm, Inc.; Private road responsibility; Blacktop road surface; Bus stop within one mile
- Financial info: Monthly land lease (ground rent) $761; approximately 1 year of lease remaining; Annual ground rent noted in income/expense list
- HOA & community: HOA/association covers common area maintenance, road maintenance, snow removal, trash and water; Community pool available (fenced, in-ground); pool membership available
Exterior
- Parking: Asphalt driveway with two driveway spaces; Two total garage/parking spaces
- Utilities: 100 amp electric service with 220 volts; Electric heating and cooling fuel; Electric hot water; Community water; Public sewer; Municipal trash service; Cable and satellite internet available
- Home design: Manufactured home (single wide); Entry level on main floor; Skyline make; Not in a federal flood zone; Located in a land-lease community (ground rent exists)
- Construction: Vinyl siding; Shingle roof; Crawl space foundation with pillar/post/pier support; Built year source: Assessor
- Exterior features: Vinyl fencing; Enclosed outdoor living space; Deck(s); Porch(es); Shed
Interior
- Kitchen: Dishwasher; Electric oven/range; Range hood; Refrigerator
- Bedrooms: Three main-level bedrooms
- Flooring: Carpet; Vinyl
- Bathrooms: Two full bathrooms on the main level
- Heating & cooling: Forced air heating (electric); Central air conditioning; Ceiling fan(s); Electric hot water
- Interior features: Walk-in shower in bathroom; Tub with shower; Ceiling fan(s); Combination kitchen/dining and kitchen/living layouts; Master bathroom; Window treatments; Storm and insulated doors; Furnished
- Laundry & utility: Washer and dryer in unit (dryer electric); Has laundry on main floor
Neighborhood map
What this means for you Summary
Snapshot
- This is a 3-bed/2.0-bath manufactured listed at $150k. Condition is rated good.
Deal economics
- At list price, monthly cash flow is $785 ($9k/yr) — positive.
- The deal already cash-flows at list — no discount required.
- Meets the 1% rule at list price ($2k rent vs $150k).
- Cap rate 12.6% vs local median 1.5% in Rehoboth Beach — top-decile yield for the area; either an underpriced asset or a hidden risk that comps aren't pricing in. Stress-test before assuming the spread holds.
Location & tenants
- Location reads 71/100 on livability (#20 in DE) — a middle-class / working-renter tenant base. Strengths: amenities A+, employment A+, health & safety A+; Watch: crime F, commute F, cost of living F.
- Cape Henlopen School District (town): math 42% / reading 55% proficiency, ranked #5 of 26 in DE (top 19%) — families likely to look elsewhere, expect single-tenant / working-renter base with shorter leases.
- Zoned schools: Rehoboth Elementary School (math 51% / reading 60%, grade C, #8 of 105 statewide, top 8%, 525 students, 0% FRL); Beacon Middle School (math 49% / reading 62%, grade B-, #1 of 36 statewide, top 0%, 648 students, 0% FRL); Cape Henlopen High School (math 26% / reading 51%, grade F, #14 of 40 statewide, top 33%, 1,813 students, 0% FRL) — zoned schools average 0% FRL vs 41% district-wide (41 pts lower); this property's tenant base skews higher-income than the district average.
- Market conditions: 334 active listings in the ZIP; 4 comparable units currently listed for rent nearby; rentals lingering (median 46d on market — plan ~5-8 weeks vacancy on turnover, expect pricing pressure); 75% of comp listings sitting > 30 days — soft ceiling on asking rent; solid renter incomes; 4,354 units permitted in Sussex County in 2024 (344 in 5+ unit buildings).
Forward outlook
- Local home prices are declining (-3.0%/yr); year-one equity from $1k of loan paydown is wiped out by about $4k of value loss. Plan a longer hold.
- Sussex County population projected at +25% by 2050 — long-run rental-demand tailwind backs the buy-and-hold thesis.
- At projected returns (-3.0% appreciation + 3.0% rent growth), your $42k cash investment doubles in ~6 years — after that, you're playing with house money.
Negotiation context
- Only 4 days on market — expect competitive offers; lowballing is unlikely to land.
Risks & watch-outs
- Climate carrying-cost: major flood risk; severe wind risk, 80% chance of damaging wind over 30y; extreme-heat days projected 7→18/yr by 2055 (HVAC capex compounding) — expect insurance premiums to compound above CPI over the hold.
Questions for the listing agent
- Is there a deadline driving the sale (1031 exchange, divorce, estate, relocation)? That informs how much negotiation room exists.
- Schools are A-rated — typically a magnet for longer-tenancy family renters. What's the average tenant stay here, and is there a school-zone premium baked into asking?
- Crime grade is F in this area — have there been break-ins, vandalism, or insurance claims at this property in the last 3 years? What carrier currently insures it and at what premium?
- What's the average days-on-market for RENTAL listings here right now (not sales)? A rising rental-DOM trend means longer vacancies and softer asking-rent achievability than the comps imply.
- What's the recent tenant-quality profile in this submarket — average credit score on applications, eviction rate, late-payment / NSF rate, and stable-employment percentage? A property-management company in the area should have these aggregated.
- How much new for-sale + rental construction is in the pipeline within 1–3 miles? Heavy new supply typically softens prices + rents 12–24 months out; constrained supply supports both.
Investment metrics
- 1% rule
- 1.54% ✓
- Cap rate
- 12.57%
- Cash-on-cash
- 22.43%
- DSCR
- 2.00
- GRM
- 5.4
CMA / ARV
- ARV (on-the-fly)
- $50,400
- Comps found
- 2
Show comp detail 2 sales within ~0.75 mi
| Address | Dist | Beds/Ba | Sqft | Sold | Price | $/sf | Match |
|---|---|---|---|---|---|---|---|
| 19962 Center Ave #3125 | 0.59mi | 3/1.0 | 886 (-12%) | 13mo | $32,000 | $36 | 38 |
| 19900 Sea Air Ave Unit A-66 | 0.64mi | 2/1.0 (-1) | 1,150 (+14%) | 16mo | $58,000 | $50 | 24 |
Match score weights: distance 35% · size 25% · config 20% · recency 20%. Top-matched comps best support the ARV.
Projected returns pro-forma
-3.0% appreciation · 3.0% rent growth · sell at horizon
- IRR
- 15.3%
- Equity multiple
- 1.61×
- Total profit
- $25,712
- Equity at exit
- $22,351
- IRR
- 23.9%
- Equity multiple
- 3.07×
- Total profit
- $86,873
- Equity at exit
- $12,961
Cash invested: $41,972 (down + closing). Projections, not guarantees.
Landlord ↔ Tenant lean methodology
- Overall (STATE)
- 70 Landlord-Friendly
- State Delaware
- 70 Landlord-Friendly · D+7
- County
- — inherits STATE
- City
- — inherits STATE
ZIP-level market 19971
- Active inventory
- 334
- Price-to-rent
- 5.4×
Monthly cashflow live
- Estimated rent
- $2,304 medium interval (Pro) →
- Mortgage (P&I)
- −$786
- Tax est. 1.5%
- −$187 /mo · $2,248/yr
- Insurance
- −$62
- HOA
- −$0
- Lot rent leased land?
- −$0
- Vacancy / Maint / Mgmt
- −$484
- Net cashflow
- $785
Break-even live
Sensitivity live
| Price | -10% $888 | -5% $836 | +0% $785 | +5% $733 | +10% $681 |
|---|---|---|---|---|---|
| Rent | -10% $602 | -5% $694 | +0% $785 | +5% $876 | +10% $967 |
| Rate | -1.0pp $860 | -0.5pp $823 | base $785 | +0.5pp $746 | +1.0pp $706 |
UW: 25.0% down · 7.5% · 30yr · 1.5% tax · 5.0% vac · 8.0% maint · 8.0% mgmt
Financing live
Cash to close
- Down payment
- $37,475
- Closing costs
- $4,497
- Reserves months
- —
- Total cash needed
- —
Loan-product check · same deal, 3 products live
Conventional
25% down · 7.5% · 30yr
- Down + closing
- —
- Monthly P&I
- —
- Monthly cashflow
- —
- DSCR
- —
- Eligible?
- —
Personal DTI + credit; lowest rate.
DSCR
20% down · 8.5% · 30yr
- Down + closing
- —
- Monthly P&I
- —
- Monthly cashflow
- —
- DSCR
- —
- Eligible?
- —
No personal income docs; deal must DSCR.
Hard money
10% down · 12.0% · 12mo
- Down + closing
- —
- Monthly P&I
- —
- Monthly cashflow
- —
- DSCR
- —
- Eligible?
- —
Short-term bridge; refi at stabilization.
Rent comps 4 comps
| Address | Beds | Baths | Sqft | Rent | $/sqft | DOM | Units | Dist |
|---|---|---|---|---|---|---|---|---|
| 36400 Warwick Dr Rehoboth Beach, DE | 3.0 | 2.5 | 792 | $3,500 | $4.42 | 46d | 1 | 0.27mi |
| 3500 Sanibel Cir #3516 Rehoboth Beach, DE | 2.0 | 2.0 | 1150 | $2,000 | $1.74 | 23d | 1 | 0.67mi |
| 3300 Sanibel Cir #3301 Rehoboth Beach, DE | 3.0 | 2.0 | 1395 | $2,100 | $1.51 | 46d | 1 | 0.72mi |
| 107 Strawberry Way Rehoboth Beach, DE | 3.0 | 2.0 | 1025 | $2,750 | $2.68 | 46d | 1 | 1.38mi |
Listing history 2 events
-
2026-04-28historical Active Under Contract
-
2026-04-24$149,900 Active
ⓘ Source: listings_history table (triggers on properties + properties_extension) + one-shot
backfill from property_details.listing_events for pre-trigger history.
Climate risk First Street
- Flood 6/10 Major FEMA zone X (shaded) · 70% chance over 30 yrs
- Wildfire 1/10 Low
- Heat 9/10 Extreme 7 d/yr ≥101°F today · 18 d/yr by 30 yrs out
- Wind 8/10 Severe 80% chance of damaging wind over 30 yrs
- Air quality 2/10 Low 1 unhealthy d/yr today · 1 by 30 yrs out
Nearby sold comps map
Loading sold comps map…
Walkable amenities ~0.75 mi
Loading nearby amenities…
Taxation est. · year 1
- Rental income
- $27,653
- − Mortgage interest
- −$8,397
- − Property taxes
- −$2,248
- − Insurance
- −$750
- − Repairs & maintenance
- −$2,212
- − Management
- −$2,212
- − Depreciation
- −$4,361
- Taxable income
- $7,473
- Est. tax owed @ 24.0%
- −$1,793
- After-tax cash flow
- $7,621/yr
For passive investors: Depreciation is non-cash, so a rental often shows a tax loss while cash-flowing — sheltering income. Rental losses are passive: they offset passive income freely, and up to $25,000/yr can offset ordinary (W-2) income if you actively participate and your MAGI is under $100k (phasing out to $0 by $150k); unused losses carry forward. On sale, claimed depreciation is recaptured at up to 25%, and gains may owe capital-gains tax (a 1031 exchange can defer both). Figures are a year-1 estimate at your 24.0% rate — not tax advice; consult a CPA.
Condition & rehab AI · 12 photos
This single-family home is in good condition with a good condition score of 75. It has a cosmetic rehab level and requires minor repairs to the kitchen backsplash. The home is move-in ready with a fenced backyard and a large enclosed porch, making it an attractive option for both resale and rental.
Repairs flagged
- Minor Kitchen backsplash — Appears dated and could be replaced for a fresh look.
Value-add opportunities
- Resale Replace kitchen backsplash — Freshens up the kitchen and adds value.
- Rental Paint touch-ups — Maintains the home's curb appeal and rental appeal.
- Both Replace carpet with hardwood or tile — Improves both resale and rental value by modernizing the living areas.
Renovation cost estimate screening
| Repair item | Severity | Est. cost |
|---|---|---|
| Kitchen backsplash · Appears dated and could be replaced for a fresh look. | Minor | $500–3,000 |
| Total estimated repair cost · 1 items | $500–3,000 |
Value-add ROI direction
- Resale Replace kitchen backsplash — Freshens up the kitchen and adds value. ↑
- Rental Paint touch-ups — Maintains the home's curb appeal and rental appeal. ↑
- Both Replace carpet with hardwood or tile — Improves both resale and rental value by modernizing the living areas. ↑
ⓘ Cost ranges are severity-bucket heuristics (US national rule-of-thumb). Get contractor quotes + a written scope before underwriting a rehab budget.
Schools (NCES district)
- District
- Cape Henlopen School District
- NCES district ID
- 1000170
- Math proficiency
- 42% ▼ -14.00%
- Reading proficiency
- 55% ▼ -10.00%
- Median HH income
- $60,196
- Composite
- 42.47/100
- National rank
- #3214
- State rank
- #5 of 26 in DE
Livability — Rehoboth Beach
- Score
- 71/100
- State rank
- #20
- US rank
- #6520
Category grades
Schools grade is shown separately in the Schools card above.
Census & demographics
- County
- Sussex County · 82,708 people
- City population
- 14,886
- Metro
- Salisbury, MD-DE
- Population (ZIP)
- 14,886
- Household income
- $102,146
- Rent vs Own
- Severe rent burden
- 317.0
Population outlook (Sussex County) Hauer SSP2
- Today (2025)
- 248,853 people
- By 2030
- 264,464 · +6.3%
- By 2040
- 290,980 · +16.9%
- By 2050
- 311,259 · +25.1%
- By 2075
- 352,488 · +41.6%
- By 2100
- 367,406 · +47.6%
Race, ethnicity, and origin ACS 2023
- Neighborhood character
- Predominantly White (88%)
- Race & ethnicity
- White 88% Black 4% Two or more races 4% Hispanic / Latino 3% Asian 2%
- Common ancestry
- Romanian 5% Slovak 3% Italian 3%
- Foreign-born
- 6% · Canada, China
- Languages at home
- 95% English-only · Spanish 2% Russian/Polish/Slavic 1% French/Haitian/Cajun 1%
Political lean MEDSL · Sussex
- 2024 margin
- R (+11.0) · D 43.9% · R 54.9% · Other 1.2%
- 2008→2024 swing
- -2.4pp toward R · 2008: -8.6pp · 2024: -11.0pp
- All cycles
- 2024: R+11.0 2020: R+11.2 2016: R+22.0 2012: R+13.0 2008: R+8.6
Not yet ingested
- Civics
- —
Market trends
- HPI YoY
- ▼ -220.39%
- Current HPI
- 353.3977
- Rent YoY
- —
- Metro
- Salisbury, MD-DE
- State GDP YoY
- —
- F500 in state
- 0
Price history
2 events — show timeline
- 2026-04-28 Contingent — BRIGHT MLS
- 2026-04-24 Listed $149,900 BRIGHT MLS
Cash-flow waterfall
monthlySold comps — $/sqft
last 12 mo · ≤1 miLoading sold comps…