515 N 7th St · Louisiana, MO
Flood risk 3/10 · Minor
- FEMA flood zone
- X (unshaded)
- Chance of flooding over 30 yrs
- 0.2%
- Est. flood insurance / yr
- $473 – $860
Fire risk 2/10 · Minimal
- Est. fire insurance / yr
- $1,054 – $1,958
Heat risk 4/10 · Minor
- Hot days now (above 107°F)
- 7 days/yr
- Hot days in 30 yrs
- 19 days/yr
Wind risk 2/10 · Minimal
- Chance of severe wind over 30 yrs
- 0.0%
Air-quality risk 1/10 · Minimal
- Unhealthy air days now
- 0 days/yr
- Unhealthy air days in 30 yrs
- 0 days/yr
Risk factors via First Street. Map © Google.
Why this score? — see what drove the D grade
The composite is a weighted blend of 9 inputs, each scored 0–100. Each bar is that input's sub-score; the figure is the points it added to the 100-point composite (weight × sub-score).
- Cash flow +15.0/30.0
- ARV discount +7.5/15.0
- 1% rule +5.0/10.0
- DSCR +5.0/10.0
- Livability +3.6/5.0
- Schools +2.9/10.0
- Rent growth +2.5/5.0
- Condition / age +2.5/5.0
- Appreciation +0.3/10.0
$15,000
🖨 Deal sheet (PDF) 📄 Offer letter ✓ Due diligence
Listing remarks MLS
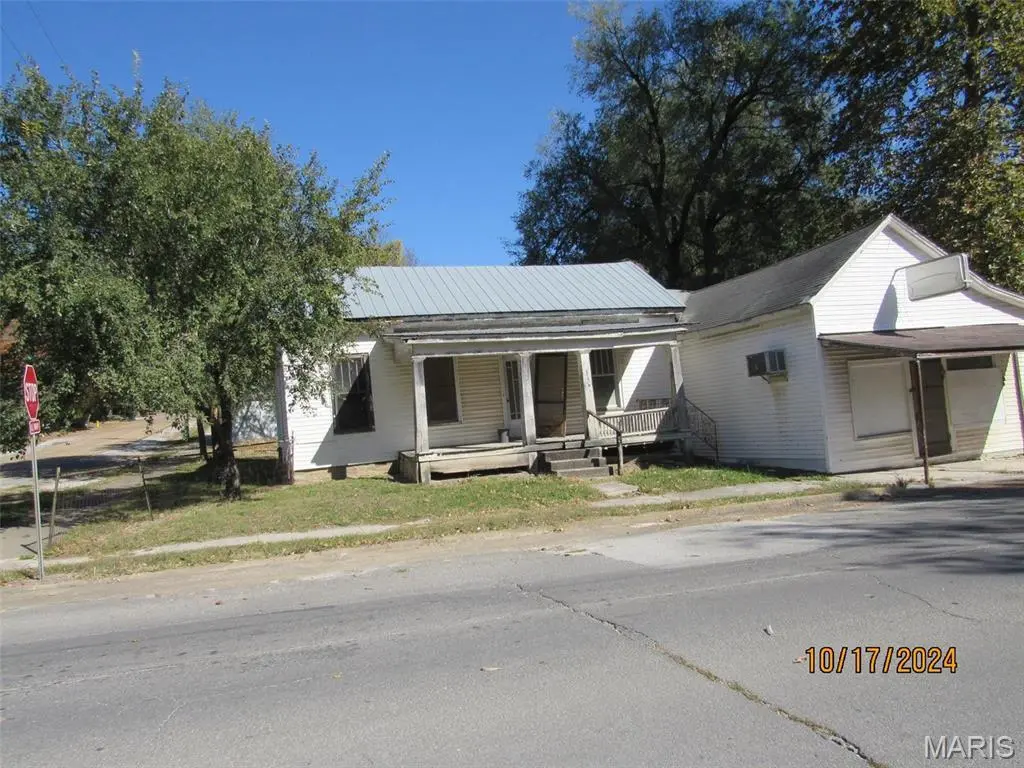
Let your imagination run wild! This property could possibly be residential and commercial?? Consists of home with attached building that used to be a market! And also includes parcel #08-04-18-003-011-002.0000 with 1949 older 474 sq ft home that should not be entered! selling as is where is!!
Key facts
- Parcel included
- 0.24 acre lot
- Built 1900
Tags
Neighborhood map
What this means for you Summary
Snapshot
- This is a 1-bed/1.0-bath other listed at $15k.
Deal economics
- At list price, monthly cash flow is $869 ($10k/yr) — positive.
- The deal already cash-flows at list — no discount required.
- Meets the 1% rule at list price ($1k rent vs $15k).
- Recommended offer: $13k (12.0% below list) — sets the bar for market timing.
- Cap rate 75.8% vs local median 9.2% in Louisiana — top-decile yield for the area; either an underpriced asset or a hidden risk that comps aren't pricing in. Stress-test before assuming the spread holds.
Location & tenants
- Location reads 71/100 on livability (#105 in MO) — a middle-class / working-renter tenant base. Strengths: cost of living A+, housing A+, crime A; Watch: schools D-, amenities F, commute F.
- Louisiana R-II (town): math 31% / reading 39% proficiency, ranked #227 of 324 in MO (top 70%) — families likely to look elsewhere, expect single-tenant / working-renter base with shorter leases.
- Market conditions: 32 active listings in the ZIP; 38 units permitted in Pike County in 2024 (0 in 5+ unit buildings).
Forward outlook
- Local home prices are declining (-3.0%/yr); year-one equity from $104 of loan paydown is wiped out by about $450 of value loss. Plan a longer hold.
- Pike County population projected to shrink 7% by 2050 — rents likely to lag national; underwrite the cash flow, not the appreciation.
- At projected returns (-3.0% appreciation + 3.0% rent growth), your $4k cash investment doubles in ~1 year — after that, you're playing with house money.
Negotiation context
- It's been on market 509 days — a 12% lower offer ($13k) is reasonable based on typical stale-listing flexibility.
- 2 sale attempts since 2y ago; this cycle's ask has dropped $10k (40%) from the opening price — seller is motivated, your offer sets the floor, not the list.
Risks & watch-outs
- Watch-outs: built in 1900 — expect roof / HVAC / electrical / plumbing capex.
Questions for the listing agent
- It's been on market 509 days. Have you received any prior offers? Is the seller open to a 12% concession, seller financing, or rate buy-down credit?
- Built in 1900 — when were the roof, HVAC, electrical panel, plumbing, and water heater last replaced?
- Why hasn't it sold? Are there any deal-killer items the seller is aware of (foundation, flood, title, zoning, code violations)?
- Is there a deadline driving the sale (1031 exchange, divorce, estate, relocation)? That informs how much negotiation room exists.
- Schools are D-rated, which usually means shorter tenancies and higher turnover. Who's the typical renter profile here, and what's been the actual vacancy rate?
- The area grade is low — what's the realistic commute time and amenity access for the typical tenant pool here? Any planned neighborhood developments (good or bad) we should know about?
- What's the average days-on-market for RENTAL listings here right now (not sales)? A rising rental-DOM trend means longer vacancies and softer asking-rent achievability than the comps imply.
- What's the recent tenant-quality profile in this submarket — average credit score on applications, eviction rate, late-payment / NSF rate, and stable-employment percentage? A property-management company in the area should have these aggregated.
- How much new for-sale + rental construction is in the pipeline within 1–3 miles? Heavy new supply typically softens prices + rents 12–24 months out; constrained supply supports both.
Investment metrics
- 1% rule
- 8.21% ✓
- Cap rate
- 75.79%
- Cash-on-cash
- 248.19%
- DSCR
- 12.04
- GRM
- 1.0
CMA / ARV
- ARV (median comp)
- $99,572
- List price
- $15,000
- Delta
- -84.94%
- Verdict
- UNDERPRICED
- Comps
- 12 within 1.0 mi
Projected returns pro-forma
-3.0% appreciation · 3.0% rent growth · sell at horizon
- IRR
- —
- Equity multiple
- 13.60×
- Total profit
- $52,915
- Equity at exit
- $2,237
- IRR
- —
- Equity multiple
- 28.95×
- Total profit
- $117,394
- Equity at exit
- $1,297
Cash invested: $4,200 (down + closing). Projections, not guarantees.
Landlord ↔ Tenant lean methodology
- Overall (STATE)
- 81 Strongly Landlord-Friendly
- State Missouri
- 81 Strongly Landlord-Friendly · R+10
- County
- — inherits STATE
- City
- — inherits STATE
ZIP-level market 63353
- Home prices YoY
- -5.0%
- Active inventory
- 32
- Price-to-rent
- 1.0×
Monthly cashflow live
- Estimated rent
- $1,231 medium interval (Pro) →
- Mortgage (P&I)
- −$79
- Tax est. 1.5%
- −$19 /mo · $225/yr
- Insurance
- −$6
- HOA
- −$0
- Vacancy / Maint / Mgmt
- −$258
- Net cashflow
- $869
Break-even live
Sensitivity live
| Price | -10% $879 | -5% $874 | +0% $869 | +5% $863 | +10% $858 |
|---|---|---|---|---|---|
| Rent | -10% $771 | -5% $820 | +0% $869 | +5% $917 | +10% $966 |
| Rate | -1.0pp $876 | -0.5pp $872 | base $869 | +0.5pp $865 | +1.0pp $861 |
UW: 25.0% down · 7.5% · 30yr · 1.5% tax · 5.0% vac · 8.0% maint · 8.0% mgmt
Financing live
Cash to close
- Down payment
- $3,750
- Closing costs
- $450
- Reserves months
- —
- Total cash needed
- —
Loan-product check · same deal, 3 products live
Conventional
25% down · 7.5% · 30yr
- Down + closing
- —
- Monthly P&I
- —
- Monthly cashflow
- —
- DSCR
- —
- Eligible?
- —
Personal DTI + credit; lowest rate.
DSCR
20% down · 8.5% · 30yr
- Down + closing
- —
- Monthly P&I
- —
- Monthly cashflow
- —
- DSCR
- —
- Eligible?
- —
No personal income docs; deal must DSCR.
Hard money
10% down · 12.0% · 12mo
- Down + closing
- —
- Monthly P&I
- —
- Monthly cashflow
- —
- DSCR
- —
- Eligible?
- —
Short-term bridge; refi at stabilization.
Listing history 22 events
-
2026-06-21days on market $15,000 Active 509 DOM
-
2026-06-21days on market $15,000 Active 508 DOM
-
2026-06-18days on market $15,000 Active 506 DOM
-
2026-06-17days on market $15,000 Active 505 DOM
-
2026-06-16days on market $15,000 Active 504 DOM
-
2026-06-15days on market $15,000 Active 503 DOM
-
2026-06-13days on market $15,000 Active 501 DOM
-
2026-06-12days on market $15,000 Active 500 DOM
-
2026-06-09days on market $15,000 Active 497 DOM
-
2026-06-08days on market $15,000 Active 496 DOM
-
2026-06-07days on market $15,000 Active 495 DOM
-
2026-06-07days on market $15,000 Active 494 DOM
-
2026-06-04days on market $15,000 Active 491 DOM
-
2026-06-02days on market $15,000 Active 490 DOM
-
2026-06-01days on market $15,000 Active 489 DOM
-
2026-05-31days on market $15,000 Active 488 DOM
-
2025-09-25price $15,000 295-char remark
Show marketing remark (295 chars)
Let your imagination run wild! This property could possibly be residential and commercial?? Consists of home with attached building that used to be a market! And also includes parcel #08-04-18-003-011-002.0000 with 1949 older 474 sq ft home that should not be entered! selling as is where is!!
-
2025-06-06price $19,000 295-char remark
Show marketing remark (295 chars)
Let your imagination run wild! This property could possibly be residential and commercial?? Consists of home with attached building that used to be a market! And also includes parcel #08-04-18-003-011-002.0000 with 1949 older 474 sq ft home that should not be entered! selling as is where is!!
-
2025-02-27status Active 295-char remark
Show marketing remark (295 chars)
Let your imagination run wild! This property could possibly be residential and commercial?? Consists of home with attached building that used to be a market! And also includes parcel #08-04-18-003-011-002.0000 with 1949 older 474 sq ft home that should not be entered! selling as is where is!!
-
2024-11-22status Pending 295-char remark
Show marketing remark (295 chars)
Let your imagination run wild! This property could possibly be residential and commercial?? Consists of home with attached building that used to be a market! And also includes parcel #08-04-18-003-011-002.0000 with 1949 older 474 sq ft home that should not be entered! selling as is where is!!
-
2024-10-23$25,000 Active 295-char remark
Show marketing remark (295 chars)
Let your imagination run wild! This property could possibly be residential and commercial?? Consists of home with attached building that used to be a market! And also includes parcel #08-04-18-003-011-002.0000 with 1949 older 474 sq ft home that should not be entered! selling as is where is!!
-
1988-12-01soldstatus
ⓘ Source: listings_history table (triggers on properties + properties_extension) + one-shot
backfill from property_details.listing_events for pre-trigger history.
Climate risk First Street
- Flood 3/10 Moderate FEMA zone X (unshaded) · 20% chance over 30 yrs
- Wildfire 2/10 Low
- Heat 4/10 Moderate 7 d/yr ≥107°F today · 19 d/yr by 30 yrs out
- Wind 2/10 Low 0% chance of damaging wind over 30 yrs
- Air quality 1/10 Low 0 unhealthy d/yr today · 0 by 30 yrs out
Nearby sold comps map
Loading sold comps map…
Walkable amenities ~0.75 mi
Loading nearby amenities…
Taxation est. · year 1
- Rental income
- $14,770
- − Mortgage interest
- −$840
- − Property taxes
- −$225
- − Insurance
- −$75
- − Repairs & maintenance
- −$1,182
- − Management
- −$1,182
- − Depreciation
- −$436
- Taxable income
- $10,830
- Est. tax owed @ 24.0%
- −$2,599
- After-tax cash flow
- $7,825/yr
For passive investors: Depreciation is non-cash, so a rental often shows a tax loss while cash-flowing — sheltering income. Rental losses are passive: they offset passive income freely, and up to $25,000/yr can offset ordinary (W-2) income if you actively participate and your MAGI is under $100k (phasing out to $0 by $150k); unused losses carry forward. On sale, claimed depreciation is recaptured at up to 25%, and gains may owe capital-gains tax (a 1031 exchange can defer both). Figures are a year-1 estimate at your 24.0% rate — not tax advice; consult a CPA.
Schools (NCES district)
- District
- Louisiana R-II
- NCES district ID
- 2919260
- Math proficiency
- 31% ▲ 1.00%
- Reading proficiency
- 39% ▬ 0.00%
- Median HH income
- $37,149
- Composite
- 29.1/100
- National rank
- #6595
- State rank
- #227 of 324 in MO
Livability — Louisiana
- Score
- 71/100
- State rank
- #105
- US rank
- #6899
Category grades
Schools grade is shown separately in the Schools card above.
Census & demographics
- Census place
- Louisiana, MO
- Population (ZIP)
- 4,935
Population outlook (Pike County) Hauer SSP2
- Today (2025)
- 17,895 people
- By 2030
- 17,591 · -1.7%
- By 2040
- 17,080 · -4.6%
- By 2050
- 16,589 · -7.3%
- By 2075
- 14,761 · -17.5%
- By 2100
- 11,606 · -35.1%
Race, ethnicity, and origin ACS 2023
- Neighborhood character
- Predominantly White (90%)
- Race & ethnicity
- White 90% Two or more races 6% Hispanic / Latino 3% Black 2%
- Common ancestry
- Romanian 3% Iranian 2% Lithuanian 1%
- Foreign-born
- 1% · Canada, China
- Languages at home
- 96% English-only · Spanish 3%
Political lean MEDSL · Pike
- 2024 margin
- Solid R (+57.9) · D 20.7% · R 78.6%
- 2008→2024 swing
- -48.0pp toward R · 2008: -9.9pp · 2024: -57.9pp
- All cycles
- 2024: R+57.9 2020: R+53.9 2016: R+47.0 2012: R+27.3 2008: R+9.9
Not yet ingested
- Civics
- —
Market trends
- HPI YoY
- ▼ -9.40%
- Current HPI
- 180.6084
- Rent YoY
- —
- Metro
- —
- State GDP YoY
- ▲ 1.84%
- F500 in state
- 20
Industry mix (Fortune 500 HQ in MO)
| Industry | F500 HQs | Revenue |
|---|---|---|
| Healthcare | 1 | $163B |
|
||
| Insurance | 1 | $21B |
|
||
| Industrial Technology | 1 | $17B |
|
||
| Retail | 1 | $16B |
|
||
| Industrial Distribution | 1 | $10B |
|
||
| Utilities | 1 | $9B |
|
||
Price history
-40.0% since first listed6 events — show timeline
- 2025-09-25 Price Changed $15,000 MARIS as Distributed by MLS Grid
- 2025-06-06 Price Changed $19,000 MARIS as Distributed by MLS Grid
- 2025-02-27 Relisted — MARIS as Distributed by MLS Grid
- 2024-11-22 Pending — MARIS as Distributed by MLS Grid
- 2024-10-23 Listed $25,000 MARIS as Distributed by MLS Grid
- 1988-12-01 Sold (Public Records) — Public Records
Property tax history
-9.8%/yrLatest (2025): $29 · -76.4% YoY. Source: county tax records.
Cash-flow waterfall
monthlySold comps — $/sqft
last 12 mo · ≤1 miLoading sold comps…