 Fourplex
165 Sandogardy Pond Rd #9 · Franklin, NH
Flood risk 1/10 · Minimal
- FEMA flood zone
- X (unshaded)
- Chance of flooding over 30 yrs
- 0.0%
- Est. flood insurance / yr
- $507 – $1,088
Fire risk 2/10 · Minimal
- Est. fire insurance / yr
- $507 – $941
Heat risk 3/10 · Minor
- Hot days now (above 93°F)
- 7 days/yr
- Hot days in 30 yrs
- 16 days/yr
Wind risk 4/10 · Minor
- Chance of severe wind over 30 yrs
- 12.0%
Air-quality risk 1/10 · Minimal
- Unhealthy air days now
- 0 days/yr
- Unhealthy air days in 30 yrs
- 0 days/yr
Risk factors via First Street. Map © Google.
Why this score? — see what drove the C- grade
The composite is a weighted blend of 9 inputs, each scored 0–100. Each bar is that input's sub-score; the figure is the points it added to the 100-point composite (weight × sub-score).
- Cash flow +17.9/30.0
- ARV discount +7.5/15.0
- DSCR +5.6/10.0
- 1% rule +4.8/10.0
- Appreciation +4.1/10.0
- Schools +3.4/10.0
- Livability +3.4/5.0
- Rent growth +2.5/5.0
- Condition / age +2.2/5.0
$750,000
🖨 Deal sheet (PDF) 📄 Offer letter ✓ Due diligence
Multi-family units
County records classify this as Multi-Family (2-4 Unit). Listing-text estimate: 4 units. confirmed
Listing remarks MLS
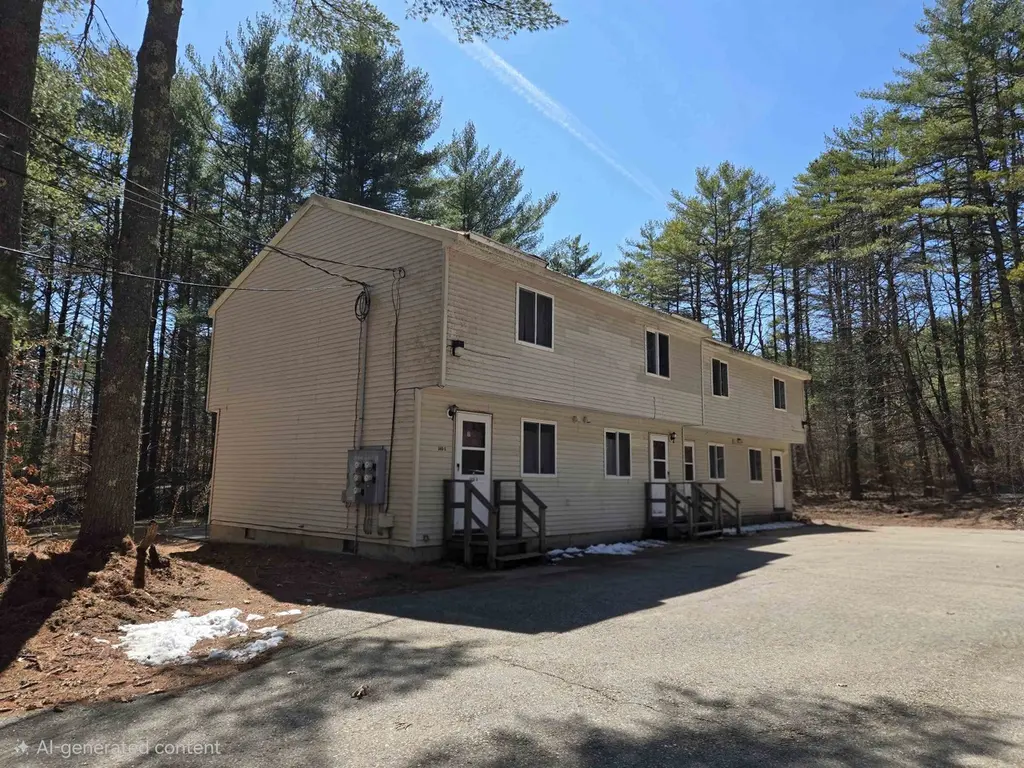
4 Unit Townhouse style 4 Plex located on 2.5 Acres across the street from Sandogardy Pond. Four long term leased tenants. Great investment property. Onsite common laundry room equipped with coin operated laundry machines. Wooded Lot. Broker Interest to seller.
Key facts
- Wooded lot
- 4 plex
- 2.5 acres
Tags
Neighborhood map
What this means for you Summary
Snapshot
- This is a 4 × 2-bed/1.0-bath units multifamily listed at $750k. Condition is rated fair.
Deal economics
- At list price, monthly cash flow is $634 ($8k/yr) — positive. Per door: $159/mo.
- The deal already cash-flows at list — no discount required.
- To meet the 1% rule (rent ≥ 1% of price), the offer needs to be $736k (1.8% below list).
- Recommended offer: $728k (3.0% below list) — sets the bar for market timing.
- Cap rate 7.3% vs local median 2.5% in Franklin — top-decile yield for the area; either an underpriced asset or a hidden risk that comps aren't pricing in. Stress-test before assuming the spread holds.
Location & tenants
- Location reads 68/100 on livability (#56 in NH) — a middle-class / working-renter tenant base. Strengths: crime A+, cost of living A+, housing A+; Watch: health & safety C-, amenities F, commute F.
- Winnisquam Regional School District (town): math 32% / reading 46% proficiency, ranked #64 of 98 in NH (top 65%) — families likely to look elsewhere, expect single-tenant / working-renter base with shorter leases.
- Zoned schools: Winnisquam Regional Middle School (math 27% / reading 44%, grade F, #56 of 96 statewide, top 59%, 398 students, 37% FRL); Winnisquam Regional High School (math 27% / reading 52%, grade F, #63 of 90 statewide, top 74%, 421 students, 30% FRL).
- Market conditions: 43 active listings in the ZIP; 380 units permitted in Merrimack County in 2024 (28 in 5+ unit buildings).
Forward outlook
- Local home prices are declining (-1.9%/yr); year-one equity from $5k of loan paydown is wiped out by about $14k of value loss. Plan a longer hold.
- Merrimack County population projected to shrink 5% by 2050 — rents likely to lag national; underwrite the cash flow, not the appreciation.
Negotiation context
- It's been on market 44 days — a 3% lower offer ($728k) is reasonable based on typical stale-listing flexibility.
Questions for the listing agent
- It's been on market 44 days. Have you received any prior offers? Is the seller open to a 3% concession, seller financing, or rate buy-down credit?
- Can we see the unit-by-unit rent roll, current vacancy, and any below-market leases? What's the average tenancy length?
- What capital expenditures (roof, boiler, parking lot, exteriors) have been made in the last 5 years, and what's planned in the next 2?
- Have any recent inspections been done? Can we get a copy of the seller's disclosures and any deferred-maintenance estimates?
- Is there a deadline driving the sale (1031 exchange, divorce, estate, relocation)? That informs how much negotiation room exists.
- Schools are F-rated, which usually means shorter tenancies and higher turnover. Who's the typical renter profile here, and what's been the actual vacancy rate?
- What's the average days-on-market for RENTAL listings here right now (not sales)? A rising rental-DOM trend means longer vacancies and softer asking-rent achievability than the comps imply.
- What's the recent tenant-quality profile in this submarket — average credit score on applications, eviction rate, late-payment / NSF rate, and stable-employment percentage? A property-management company in the area should have these aggregated.
- How much new apartment / multifamily construction is in the pipeline within 1–3 miles? Heavy new supply (>2% of stock underway) typically softens rents 12–24 months out; light construction supports rent growth.
Investment metrics
- 1% rule
- 0.98% ✗
- Cap rate
- 7.31%
- Cash-on-cash
- 3.63%
- DSCR
- 1.16
- GRM
- 8.5
CMA / ARV
No comps found within radius.
Projected returns pro-forma
-1.88% appreciation · 3.0% rent growth · sell at horizon
- IRR
- -5.3%
- Equity multiple
- 0.78×
- Total profit
- $-45,295
- Equity at exit
- $149,823
- IRR
- 2.6%
- Equity multiple
- 1.21×
- Total profit
- $45,093
- Equity at exit
- $132,027
Cash invested: $210,000 (down + closing). Projections, not guarantees.
Landlord ↔ Tenant lean methodology
- Overall (STATE)
- 56 Moderately Landlord-Leaning
- State New Hampshire
- 56 Moderately Landlord-Leaning · D+1
- County
- — inherits STATE
- City
- — inherits STATE
ZIP-level market 03276
- Home prices YoY
- -0.4%
- Active inventory
- 43
- Price-to-rent
- 34.0×
Monthly cashflow live
- Estimated rent
- $7,364 medium interval (Pro) →
- Mortgage (P&I)
- −$3,933
- Tax est. 1.5%
- −$938 /mo · $11,250/yr
- Insurance
- −$312
- HOA
- −$0
- Vacancy / Maint / Mgmt
- −$1,546
- Net cashflow
- $634
Break-even live
Sensitivity live
| Price | -10% $1,153 | -5% $894 | +0% $634 | +5% $375 | +10% $116 |
|---|---|---|---|---|---|
| Rent | -10% $53 | -5% $344 | +0% $634 | +5% $925 | +10% $1,216 |
| Rate | -1.0pp $1,012 | -0.5pp $825 | base $634 | +0.5pp $440 | +1.0pp $242 |
4-unit breakdown (identical units grouped — click to expand)
| Units | Beds | Baths | Est. rent |
|---|---|---|---|
| 4× units | 2 | 1 | $7,364 |
| #1 | 2 | 1 | $1,841 |
| #2 | 2 | 1 | $1,841 |
| #3 | 2 | 1 | $1,841 |
| #4 | 2 | 1 | $1,841 |
| Total (4 units) | $7,364 | ||
UW: 25.0% down · 7.5% · 30yr · 1.5% tax · 5.0% vac · 8.0% maint · 8.0% mgmt
Financing live
Cash to close
- Down payment
- $187,500
- Closing costs
- $22,500
- Reserves months
- —
- Total cash needed
- —
Loan-product check · same deal, 3 products live
Conventional
25% down · 7.5% · 30yr
- Down + closing
- —
- Monthly P&I
- —
- Monthly cashflow
- —
- DSCR
- —
- Eligible?
- —
Personal DTI + credit; lowest rate.
DSCR
20% down · 8.5% · 30yr
- Down + closing
- —
- Monthly P&I
- —
- Monthly cashflow
- —
- DSCR
- —
- Eligible?
- —
No personal income docs; deal must DSCR.
Hard money
10% down · 12.0% · 12mo
- Down + closing
- —
- Monthly P&I
- —
- Monthly cashflow
- —
- DSCR
- —
- Eligible?
- —
Short-term bridge; refi at stabilization.
Listing history 1 events
-
2026-04-06$750,000 Active 260-char remark
Show marketing remark (260 chars)
4 Unit Townhouse style 4 Plex located on 2.5 Acres across the street from Sandogardy Pond. Four long term leased tenants. Great investment property. Onsite common laundry room equipped with coin operated laundry machines. Wooded Lot. Broker Interest to seller.
ⓘ Source: listings_history table (triggers on properties + properties_extension) + one-shot
backfill from property_details.listing_events for pre-trigger history.
Climate risk First Street
- Flood 1/10 Low FEMA zone X (unshaded) · 0% chance over 30 yrs
- Wildfire 2/10 Low
- Heat 3/10 Moderate 7 d/yr ≥93°F today · 16 d/yr by 30 yrs out
- Wind 4/10 Moderate 12% chance of damaging wind over 30 yrs
- Air quality 1/10 Low 0 unhealthy d/yr today · 0 by 30 yrs out
Nearby sold comps map
Loading sold comps map…
Walkable amenities ~0.75 mi
Loading nearby amenities…
Taxation est. · year 1
- Rental income
- $88,368
- − Mortgage interest
- −$42,012
- − Property taxes
- −$11,250
- − Insurance
- −$3,750
- − Repairs & maintenance
- −$7,069
- − Management
- −$7,069
- − Depreciation
- −$21,818
- Taxable loss
- −$4,601
- Est. tax savings @ 24.0%
- +$1,104
- After-tax cash flow
- $8,718/yr
For passive investors: Depreciation is non-cash, so a rental often shows a tax loss while cash-flowing — sheltering income. Rental losses are passive: they offset passive income freely, and up to $25,000/yr can offset ordinary (W-2) income if you actively participate and your MAGI is under $100k (phasing out to $0 by $150k); unused losses carry forward. On sale, claimed depreciation is recaptured at up to 25%, and gains may owe capital-gains tax (a 1031 exchange can defer both). Figures are a year-1 estimate at your 24.0% rate — not tax advice; consult a CPA.
Condition & rehab AI · 10 photos
The property is in fair condition with some minor repairs and maintenance needed. Painting and landscaping can significantly improve its appearance and increase its value for both resale and rental.
Repairs flagged
- Minor Paint — The paint appears to be slightly worn and there are some minor signs of wear and tear on the walls, floors, and countertops.
- Minor Landscaping — The landscaping is sparse, with some trees and shrubs, but the overall appearance is somewhat unkempt.
Value-add opportunities
- Both Paint — Painting the interior and exterior of the property can significantly improve its appearance and increase its value for both resale and rental.
- Both Landscaping — Landscaping the property can improve its curb appeal and increase its value for both resale and rental.
Renovation cost estimate screening
| Repair item | Severity | Est. cost |
|---|---|---|
| Paint · The paint appears to be slightly worn and there are some minor signs of wear and tear on the walls, floors, and countertops. | Minor | $500–3,000 |
| Landscaping · The landscaping is sparse, with some trees and shrubs, but the overall appearance is somewhat unkempt. | Minor | $500–3,000 |
| Total estimated repair cost · 2 items | $1,000–6,000 |
Value-add ROI direction
- Both Paint — Painting the interior and exterior of the property can significantly improve its appearance and increase its value for both resale and rental. ↑
- Both Landscaping — Landscaping the property can improve its curb appeal and increase its value for both resale and rental. ↑
ⓘ Cost ranges are severity-bucket heuristics (US national rule-of-thumb). Get contractor quotes + a written scope before underwriting a rehab budget.
Schools (NCES district)
- District
- Winnisquam Regional School District
- NCES district ID
- 3307300
- Math proficiency
- 32% ▼ -9.00%
- Reading proficiency
- 46% ▼ -6.00%
- Median HH income
- $58,761
- Composite
- 34.45/100
- National rank
- #5194
- State rank
- #64 of 98 in NH
Livability — Franklin
- Score
- 68/100
- State rank
- #56
- US rank
- #9637
Category grades
Schools grade is shown separately in the Schools card above.
Census & demographics
- City population
- 8,843
- Population (ZIP)
- 9,046
Population outlook (Merrimack County) Hauer SSP2
- Today (2025)
- 151,287 people
- By 2030
- 151,867 · +0.4%
- By 2040
- 149,927 · -0.9%
- By 2050
- 144,081 · -4.8%
- By 2075
- 132,018 · -12.7%
- By 2100
- 111,733 · -26.1%
Race, ethnicity, and origin ACS 2023
- Neighborhood character
- Predominantly White (93%)
- Race & ethnicity
- White 93% Two or more races 4% Hispanic / Latino 2%
- Common ancestry
- Lithuanian 14% Slovak 2% Romanian 2%
- Foreign-born
- 3% · Canada
- Languages at home
- 96% English-only · Spanish 2% Other Indo-European 1% Russian/Polish/Slavic 1%
Political lean MEDSL · Merrimack
- 2024 margin
- Lean D (+5.2) · D 52.1% · R 46.9% · Other 1.0%
- 2008→2024 swing
- -8.7pp toward R · 2008: 13.9pp · 2024: 5.2pp
- All cycles
- 2024: D+5.2 2020: D+9.8 2016: D+3.1 2012: D+12.7 2008: D+13.9
Not yet ingested
- Civics
- —
Market trends
- HPI YoY
- ▼ -1.88%
- Current HPI
- 436.242
- Rent YoY
- —
- Metro
- —
- State GDP YoY
- —
- F500 in state
- 0
Price history
1 event — show timeline
- 2026-04-06 Listed $750,000 PrimeMLS
Cash-flow waterfall
monthlySold comps — $/sqft
last 12 mo · ≤1 miLoading sold comps…