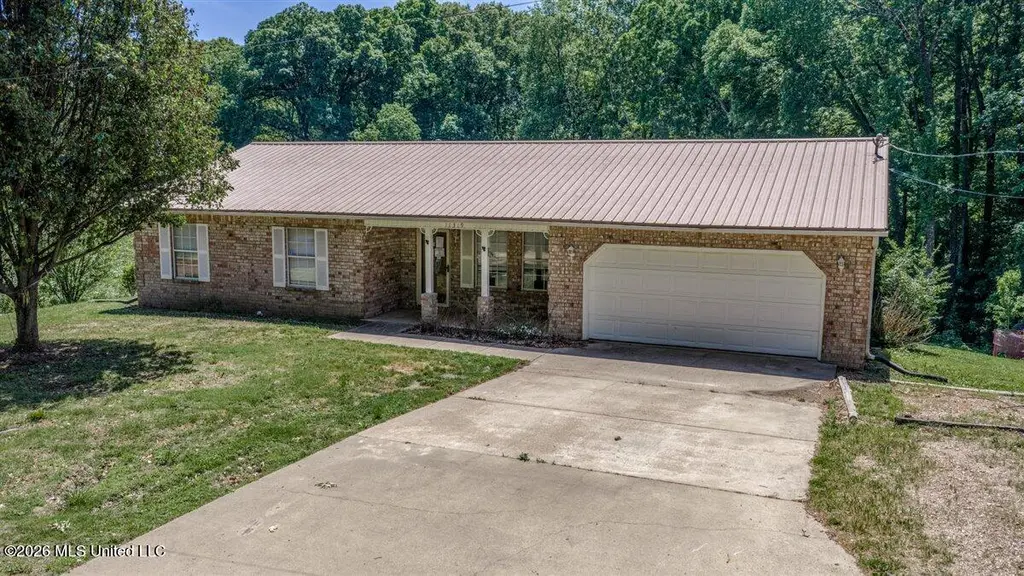
11319 Wren Dr · Eudora, MS
Flood risk 1/10 · Minimal
- FEMA flood zone
- X (unshaded)
- Chance of flooding over 30 yrs
- 0.0%
- Est. flood insurance / yr
- $507 – $1,088
Fire risk 3/10 · Minor
- Est. fire insurance / yr
- $1,241 – $2,305
Heat risk 6/10 · Moderate
- Hot days now (above 109°F)
- 7 days/yr
- Hot days in 30 yrs
- 21 days/yr
Wind risk 4/10 · Minor
- Chance of severe wind over 30 yrs
- 19.0%
Air-quality risk 2/10 · Minimal
- Unhealthy air days now
- 1 days/yr
- Unhealthy air days in 30 yrs
- 2 days/yr
Risk factors via First Street. Map © Google.
Why this score? — see what drove the B grade
The composite is a weighted blend of 9 inputs, each scored 0–100. Each bar is that input's sub-score; the figure is the points it added to the 100-point composite (weight × sub-score).
- Cash flow +28.8/30.0
- ARV discount +15.0/15.0
- DSCR +10.0/10.0
- 1% rule +7.4/10.0
- Schools +4.0/10.0
- Livability +2.5/5.0
- Condition / age +2.5/5.0
- Rent growth +2.4/5.0
- Appreciation +0.0/10.0
$175,000
🖨 Deal sheet (PDF) 📄 Offer letter ✓ Due diligence
Listing remarks
HUD home, sold "as is" HUD case# 281-547767Charming 3-bedroom, 2-bath brick home situated on a desirable corner lot in a peaceful lake community. This property spans approximately 0.63 acres across two lots, offering extra space and privacy. Inside, you'll find a spacious eat-in kitchen with durable tile flooring, perfect for everyday living and entertaining. The home also features a 2-car garage and a large back deck, ideal for relaxing or hosting gatherings while enjoying the outdoor setting. A great opportunity to enjoy comfortable living with added space in a scenic location
Key facts
- Large back deck
- Lake community
- Corner lot
Tags
Property features AI
Finance
- HOA & community: Homeowners association with an annual fee of $350 covering grounds maintenance; Community features: Lake
Exterior
- Parking: Attached garage; 2-car garage; Garage faces front; Concrete driveway/parking
- Utilities: Public water; Septic tank; Electricity connected; Water connected
- Home design: Single-family house; One story; Entry level: main
- Construction: Vinyl and brick veneer exterior; Metal roof; Slab foundation; Built (year source: assessor)
- Exterior features: Deck; Portable building; Sloped lot
Interior
- Kitchen: Dishwasher; Disposal; Electric range
- Flooring: Laminate; Tile
- Bathrooms: 2 full bathrooms
- Heating & cooling: Central electric heating; Central air conditioning; Ceiling fans for cooling
- Interior features: Ceiling fans; Eat-in kitchen; Breakfast bar
- Laundry & utility: Dedicated laundry room
Neighborhood map
What this means for you Summary
Snapshot
- This is a 3-bed/2.0-bath single-family listed at $175k.
Deal economics
- At list price, monthly cash flow is $588 ($7k/yr) — positive.
- The deal already cash-flows at list — no discount required.
- Meets the 1% rule at list price ($2k rent vs $175k).
- Recommended offer: $170k (3.0% below list) — sets the bar for market timing.
Location & tenants
- Location reads: area grade B — affects rentability + tenant quality, not the cash-flow math above.
- Desoto County School District (suburban): math 48% / reading 42% proficiency, ranked #20 of 130 in MS (top 15%) — families likely to look elsewhere, expect single-tenant / working-renter base with shorter leases.
- Zoned schools: Lake Cormorant Elementary (math 48% / reading 55%, grade C-, #56 of 375 statewide, top 15%, 647 students, 100% FRL); Lake Cormorant Middle (math 51% / reading 30%, grade F, #60 of 179 statewide, top 37%, 764 students, 100% FRL); Lake Cormorant High (math 29% / reading 42%, grade F, #66 of 197 statewide, top 34%, 969 students, 100% FRL) — zoned schools average 100% FRL vs 43% district-wide (56 pts higher); higher-poverty schools than district average — tighter screening recommended.
- Market conditions: Rents soft (-0.4%/yr); 407 active listings in the ZIP; solid renter incomes; 1,155 units permitted in DeSoto County in 2024 (0 in 5+ unit buildings).
Forward outlook
- Local home prices are declining (-3.0%/yr); year-one equity from $1k of loan paydown is wiped out by about $5k of value loss. Plan a longer hold.
- DeSoto County population projected at +33% by 2050 — long-run rental-demand tailwind backs the buy-and-hold thesis.
Negotiation context
- It's been on market 50 days — a 3% lower offer ($170k) is reasonable based on typical stale-listing flexibility.
- 7 sale attempts since 22y ago; this cycle's ask has dropped $55k (24%) from the opening price — seller is motivated, your offer sets the floor, not the list.
Risks & watch-outs
- Climate carrying-cost: extreme-heat days projected 7→21/yr by 2055 (HVAC capex compounding) — expect insurance premiums to compound above CPI over the hold.
Questions for the listing agent
- It's been on market 50 days. Have you received any prior offers? Is the seller open to a 3% concession, seller financing, or rate buy-down credit?
- What does the HOA fee cover, when was the last increase, and are there any pending special assessments or reserve-fund shortfalls?
- Is there a deadline driving the sale (1031 exchange, divorce, estate, relocation)? That informs how much negotiation room exists.
- What's the average days-on-market for RENTAL listings here right now (not sales)? A rising rental-DOM trend means longer vacancies and softer asking-rent achievability than the comps imply.
- What's the recent tenant-quality profile in this submarket — average credit score on applications, eviction rate, late-payment / NSF rate, and stable-employment percentage? A property-management company in the area should have these aggregated.
- How much new for-sale + rental construction is in the pipeline within 1–3 miles? Heavy new supply typically softens prices + rents 12–24 months out; constrained supply supports both.
Investment metrics
- 1% rule
- 1.24% ✓
- Cap rate
- 10.32%
- Cash-on-cash
- 14.39%
- DSCR
- 1.64
- GRM
- 6.7
CMA / ARV
- ARV (median comp)
- $239,758
- List price
- $175,000
- Delta
- -27.01%
- Verdict
- UNDERPRICED
- Comps
- 20 within 1.0 mi
Show comp detail 4 sales within ~0.75 mi
| Address | Dist | Beds/Ba | Sqft | Sold | Price | $/sf | Match |
|---|---|---|---|---|---|---|---|
| 3670 Glen Artney Cv | 0.37mi | 3/2.0 | 1,479 (-2%) | 5mo | $249,000 | $168 | 75 |
| 3211 Snow Downs Rdg | 0.73mi | 3/2.0 | 1,540 (+2%) | 11mo | $234,900 | $153 | 53 |
| 3248 Monans Rill Cv | 0.64mi | 3/2.0 | 1,700 (+13%) | 22mo | $279,000 | $164 | 31 |
| 3320 Snowdowns Rdg | 0.71mi | 2/2.0 (-1) | 1,287 (-15%) | 17mo | $230,000 | $179 | 23 |
Match score weights: distance 35% · size 25% · config 20% · recency 20%. Top-matched comps best support the ARV.
Projected returns pro-forma
-3.0% appreciation · 0.0% rent growth · sell at horizon
- IRR
- 1.5%
- Equity multiple
- 1.06×
- Total profit
- $2,706
- Equity at exit
- $26,093
- IRR
- 8.0%
- Equity multiple
- 1.53×
- Total profit
- $25,961
- Equity at exit
- $15,131
Cash invested: $49,000 (down + closing). Projections, not guarantees.
Landlord ↔ Tenant lean methodology
- Overall (STATE)
- 90 Strongly Landlord-Friendly
- State Mississippi
- 90 Strongly Landlord-Friendly · R+11
- County
- — inherits STATE
- City
- — inherits STATE
ZIP-level market 38632
- Home prices YoY
- -31.8%
- Rents YoY
- -0.4%
- Active inventory
- 407
- Price-to-rent
- 6.7×
Monthly cashflow live
- Estimated rent
- $2,163 medium interval (Pro) →
- Mortgage (P&I)
- −$918
- Tax from tax record
- −$101 /mo · $1,217/yr
- Insurance
- −$73
- HOA
- −$29
- Vacancy / Maint / Mgmt
- −$454
- Net cashflow
- $588
Break-even live
Sensitivity live
| Price | -10% $687 | -5% $637 | +0% $588 | +5% $538 | +10% $489 |
|---|---|---|---|---|---|
| Rent | -10% $417 | -5% $502 | +0% $588 | +5% $673 | +10% $758 |
| Rate | -1.0pp $676 | -0.5pp $632 | base $588 | +0.5pp $542 | +1.0pp $496 |
UW: 25.0% down · 7.5% · 30yr · 1.5% tax · 5.0% vac · 8.0% maint · 8.0% mgmt
Financing live
Cash to close
- Down payment
- $43,750
- Closing costs
- $5,250
- Reserves months
- —
- Total cash needed
- —
Loan-product check · same deal, 3 products live
Conventional
25% down · 7.5% · 30yr
- Down + closing
- —
- Monthly P&I
- —
- Monthly cashflow
- —
- DSCR
- —
- Eligible?
- —
Personal DTI + credit; lowest rate.
DSCR
20% down · 8.5% · 30yr
- Down + closing
- —
- Monthly P&I
- —
- Monthly cashflow
- —
- DSCR
- —
- Eligible?
- —
No personal income docs; deal must DSCR.
Hard money
10% down · 12.0% · 12mo
- Down + closing
- —
- Monthly P&I
- —
- Monthly cashflow
- —
- DSCR
- —
- Eligible?
- —
Short-term bridge; refi at stabilization.
HOA detail
- Monthly dues
- $29 · $348/yr
Listing history 25 events
-
2026-06-13status $175,000 Pending 50 DOM
-
2026-06-10days on market $175,000 Active 50 DOM
-
2026-06-09days on market $175,000 Active 49 DOM
-
2026-06-08days on market $175,000 Active 48 DOM
-
2026-06-07pricedays on market $175,000 Active 47 DOM
-
2026-06-03days on market $230,000 Active 43 DOM
-
2026-06-02days on market $230,000 Active 42 DOM
-
2026-06-01days on market $230,000 Active 41 DOM
-
2026-05-31days on market $230,000 Active 40 DOM
-
2026-04-21$230,000 Active 595-char remark
-
2025-12-11historical
-
2025-12-04soldstatus $200,900
-
2025-06-24$249,900 Active
-
2025-06-24$249,900 Active
-
2025-04-28historical
-
2025-04-11price $249,900
-
2025-01-22price $258,900
-
2024-10-28$259,900 Active
-
2024-02-21soldstatus Closed
-
2024-01-19status Pending
-
2024-01-15status Active
-
2024-01-11status Pending
-
2024-01-02$234,900 Active
-
2005-03-17soldstatus
-
2004-08-01$120,000
ⓘ Source: listings_history table (triggers on properties + properties_extension) + one-shot
backfill from property_details.listing_events for pre-trigger history.
Tax reassessment forecast MS · Resets to sale price
- Current annual tax
- $1,217 · $101/mo
- Projected year-2 tax
- $1,383 · $115/mo
- Expected delta
- +$165/yr (+$14/mo · 13.6%)
ⓘ Screening estimate from a state-policy table — verify with the county assessor before closing.
Climate risk First Street
- Flood 1/10 Low FEMA zone X (unshaded) · 0% chance over 30 yrs
- Wildfire 3/10 Moderate
- Heat 6/10 Major 7 d/yr ≥109°F today · 21 d/yr by 30 yrs out
- Wind 4/10 Moderate 19% chance of damaging wind over 30 yrs
- Air quality 2/10 Low 1 unhealthy d/yr today · 2 by 30 yrs out
Nearby sold comps map
Loading sold comps map…
Walkable amenities ~0.75 mi
Loading nearby amenities…
Taxation est. · year 1
- Rental income
- $25,954
- − Mortgage interest
- −$9,803
- − Property taxes
- −$1,217
- − Insurance
- −$875
- − Repairs & maintenance
- −$2,076
- − Management
- −$2,076
- − HOA
- −$348
- − Depreciation
- −$5,091
- Taxable income
- $4,468
- Est. tax owed @ 24.0%
- −$1,072
- After-tax cash flow
- $5,979/yr
For passive investors: Depreciation is non-cash, so a rental often shows a tax loss while cash-flowing — sheltering income. Rental losses are passive: they offset passive income freely, and up to $25,000/yr can offset ordinary (W-2) income if you actively participate and your MAGI is under $100k (phasing out to $0 by $150k); unused losses carry forward. On sale, claimed depreciation is recaptured at up to 25%, and gains may owe capital-gains tax (a 1031 exchange can defer both). Figures are a year-1 estimate at your 24.0% rate — not tax advice; consult a CPA.
Schools (NCES district)
- District
- Desoto County School District
- NCES district ID
- 2801320
- Math proficiency
- 48% ▼ -13.00%
- Reading proficiency
- 42% ▼ -6.00%
- Median HH income
- $59,272
- Composite
- 39.56/100
- National rank
- #3933
- State rank
- #20 of 130 in MS
Livability — Eudora
No livability data for this city. (Only ~50 U.S. cities are tracked.)
Census & demographics
- County
- DeSoto County · 176,513 people
- Metro
- Memphis, TN-MS-AR
- Population (ZIP)
- 31,374
- Household income
- $93,583
- Rent vs Own
- Severe rent burden
- 24.0
Population outlook (DeSoto County) Hauer SSP2
- Today (2025)
- 203,338 people
- By 2030
- 217,692 · +7.1%
- By 2040
- 245,320 · +20.6%
- By 2050
- 270,133 · +32.8%
- By 2075
- 323,341 · +59.0%
- By 2100
- 348,742 · +71.5%
Race, ethnicity, and origin ACS 2023
- Neighborhood character
- Predominantly White (81%)
- Race & ethnicity
- White 81% Black 13% Two or more races 4% Hispanic / Latino 2%
- Common ancestry
- Italian 2% Serbian 2% Slovak 1%
- Foreign-born
- 2% · Canada
- Languages at home
- 98% English-only · Spanish 1% Arabic 1%
Political lean MEDSL · DeSoto
- 2024 margin
- Strong R (+24.1) · D 36.7% · R 60.8% · Other 2.5%
- 2008→2024 swing
- +14.2pp toward D · 2008: -38.2pp · 2024: -24.1pp
- All cycles
- 2024: R+24.1 2020: R+23.9 2016: R+34.8 2012: R+33.5 2008: R+38.2
Not yet ingested
- Civics
- —
Market trends
- HPI YoY
- ▼ -82.49%
- Current HPI
- 176.8843
- Rent YoY
- ▼ -0.43%
- Metro
- Memphis, TN-MS-AR
- State GDP YoY
- —
- F500 in state
- 0
Price history
+45.8% since first listed18 events — show timeline
- 2026-06-10 Pending — MLSU
- 2026-06-05 Price Changed $175,000 MLSU
- 2026-04-21 Listed $230,000 MLSU
- 2025-12-11 Listing Removed — MLSU
- 2025-12-04 Sold (Public Records) $200,900 Public Records
- 2025-06-24 Listed $249,900 NCMBR
- 2025-06-24 Listed $249,900 MLSU
- 2025-04-28 Listing Removed — MLSU
- 2025-04-11 Price Changed $249,900 MLSU
- 2025-01-22 Price Changed $258,900 MLSU
- 2024-10-28 Listed $259,900 MLSU
- 2024-02-21 Sold (MLS) — MLSU
- 2024-01-19 Pending — MLSU
- 2024-01-15 Relisted — MLSU
- 2024-01-11 Pending — MLSU
- 2024-01-02 Listed $234,900 MLSU
- 2005-03-17 Sold (MLS) — MLSU
- 2004-08-01 Listed $120,000 MLSU
Property tax history
+5.3%/yrLatest (2025): $1,217 · +65.2% YoY. Source: county tax records.
Cash-flow waterfall
monthlySold comps — $/sqft
last 12 mo · ≤1 miLoading sold comps…