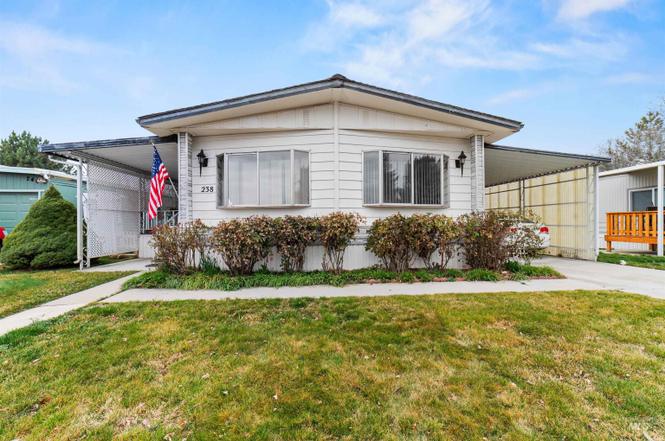
238 N Checola Cir · Boise City, ID
Flood risk No data
- FEMA flood zone
- —
- Chance of flooding over 30 yrs
- —
- Est. flood insurance / yr
- —
Fire risk No data
- Est. fire insurance / yr
- —
Heat risk No data
- Hot days now (above threshold)
- —
- Hot days in 30 yrs
- —
Wind risk No data
- Chance of severe wind over 30 yrs
- —
Air-quality risk No data
- Unhealthy air days now
- —
- Unhealthy air days in 30 yrs
- —
Risk factors via First Street. Map © Google.
Why this score? — see what drove the B+ grade
The composite is a weighted blend of 9 inputs, each scored 0–100. Each bar is that input's sub-score; the figure is the points it added to the 100-point composite (weight × sub-score).
- Cash flow +30.0/30.0
- ARV discount +14.1/15.0
- 1% rule +10.0/10.0
- DSCR +10.0/10.0
- Schools +5.2/10.0
- Rent growth +3.5/5.0
- Livability +2.5/5.0
- Condition / age +2.5/5.0
- Appreciation +0.0/10.0
$85,000
🖨 Deal sheet 📄 Offer letter ✓ Due diligence
Listing remarks
Welcome to this well maintained double-wide manufactured home in a prestigious 55+ community. Filled with natural light, the home offers a practical layout, generous storage, and a large covered front porch ideal for relaxing. The property also includes two storage sheds, providing additional space for tools, hobbies, or seasonal items. Enjoy close proximity to shopping, dining, entertainment, and daily conveniences. Community amenities include a clubhouse, library, dog park, games, organized activities, and additional RV parking. A wonderful opportunity to enjoy comfort, convenience, and a true sense of community.
Key facts
- Dog park
- Clubhouse
- Two storage sheds
Tags
Neighborhood map
What this means for you Summary
Snapshot
- This is a 2-bed/2.0-bath manufactured listed at $85k.
Deal economics
- At list price, monthly cash flow is $682 ($8k/yr) — positive.
- The deal already cash-flows at list — no discount required.
- Meets the 1% rule at list price ($2k rent vs $85k).
- Recommended offer: $82k (3.0% below list) — sets the bar for market timing.
- Cap rate 15.9% vs local median 2.6% in Boise City — top-decile yield for the area; either an underpriced asset or a hidden risk that comps aren't pricing in. Stress-test before assuming the spread holds.
Location & tenants
- Location reads: area grade B — affects rentability + tenant quality, not the cash-flow math above.
- Joint School District No. 2 (suburban): math 53% / reading 67% proficiency, ranked #11 of 92 in ID (top 12%) — acceptable for families but not a draw, mixed tenant base, ~2y average lease.
- Zoned schools: Ustick Elementary School (math 32% / reading 37%, grade F, #272 of 357 statewide, top 80%, 357 students, 60% FRL); Centennial High School (math 53% / reading 76%, grade B-, #10 of 169 statewide, top 7%, 1,931 students, 22% FRL) — zoned schools average 41% FRL vs 23% district-wide (18 pts higher); higher-poverty schools than district average — tighter screening recommended.
- Market conditions: Rents rising fast (+4.0%/yr); 135 active listings in the ZIP; 17 comparable units currently listed for rent nearby; rentals at typical pace (median 15d on market — plan ~3-4 weeks tenant-placement turnaround); solid renter incomes; 5,129 units permitted in Ada County in 2024 (414 in 5+ unit buildings).
Forward outlook
- Local home prices are declining (-3.0%/yr); year-one equity from $588 of loan paydown is wiped out by about $3k of value loss. Plan a longer hold.
- Ada County population projected at +45% by 2050 — long-run rental-demand tailwind backs the buy-and-hold thesis.
- At projected returns (-3.0% appreciation + 4.0% rent growth), your $24k cash investment doubles in ~4 years — after that, you're playing with house money.
Negotiation context
- It's been on market 44 days — a 3% lower offer ($82k) is reasonable based on typical stale-listing flexibility.
Questions for the listing agent
- It's been on market 44 days. Have you received any prior offers? Is the seller open to a 3% concession, seller financing, or rate buy-down credit?
- Built in 1976 — when were the roof, HVAC, electrical panel, plumbing, and water heater last replaced?
- Is there a deadline driving the sale (1031 exchange, divorce, estate, relocation)? That informs how much negotiation room exists.
- What's the average days-on-market for RENTAL listings here right now (not sales)? A rising rental-DOM trend means longer vacancies and softer asking-rent achievability than the comps imply.
- What's the recent tenant-quality profile in this submarket — average credit score on applications, eviction rate, late-payment / NSF rate, and stable-employment percentage? A property-management company in the area should have these aggregated.
- How much new for-sale + rental construction is in the pipeline within 1–3 miles? Heavy new supply typically softens prices + rents 12–24 months out; constrained supply supports both.
Investment metrics
- 1% rule
- 1.89% ✓
- Cap rate
- 15.92%
- Cash-on-cash
- 34.39%
- DSCR
- 2.53
- GRM
- 4.4
CMA / ARV
- ARV (on-the-fly)
- $99,600
- Comps found
- 12
Show comp detail 12 sales within ~0.75 mi
| Address | Dist | Beds/Ba | Sqft | Sold | Price | $/sf | Match |
|---|---|---|---|---|---|---|---|
| 238 N Checola Cir | 0.00mi | 2/2.0 | 1,200 (0%) | 1mo | $85,000 | $71 | 99 |
| 275 N Checola Cir | 0.06mi | 2/2.0 | 1,248 (+4%) | 2mo | $99,000 | $79 | 88 |
| 260 N Checola Cir | 0.07mi | 3/1.5 (+1) | 1,248 (+4%) | 2mo | $85,000 | $68 | 82 |
| 137 Rainbow Dr | 0.11mi | 3/2.0 (+1) | 1,152 (-4%) | 5mo | $137,000 | $119 | 79 |
| 551 Silver City Dr | 0.23mi | 3/2.0 (+1) | 1,200 (0%) | 7mo | $100,000 | $83 | 78 |
| 315 Driftwood Rd | 0.08mi | 2/2.0 | 1,056 (-12%) | 7mo | $115,000 | $109 | 71 |
| 621 Timathy St | 0.35mi | 3/2.0 (+1) | 1,152 (-4%) | 3mo | $74,990 | $65 | 69 |
| 307 Driftwood Rd | 0.27mi | 2/2.0 | 1,344 (+12%) | 1mo | $99,500 | $74 | 67 |
| 10035 W Mesquite Ln | 0.50mi | 2/1.5 | 1,248 (+4%) | 3mo | $299,900 | $240 | 66 |
| 1349 N Meadowland Ln | 0.37mi | 3/2.0 (+1) | 1,152 (-4%) | 7mo | $131,900 | $114 | 65 |
| 10565 W Halstead Dr | 0.60mi | 2/2.0 | 1,248 (+4%) | 2mo | $199,000 | $159 | 64 |
| 10369 W Florence Ln | 0.31mi | 3/2.0 (+1) | 1,064 (-11%) | 3mo | $75,000 | $70 | 59 |
Match score weights: distance 35% · size 25% · config 20% · recency 20%. Top-matched comps best support the ARV.
Projected returns pro-forma
-3.0% appreciation · 4.01% rent growth · sell at horizon
- IRR
- 31.0%
- Equity multiple
- 2.32×
- Total profit
- $31,340
- Equity at exit
- $12,674
- IRR
- 38.7%
- Equity multiple
- 4.79×
- Total profit
- $90,234
- Equity at exit
- $7,349
Cash invested: $23,800 (down + closing). Projections, not guarantees.
Landlord ↔ Tenant lean methodology
- Overall (STATE)
- 91 Strongly Landlord-Friendly
- State Idaho
- 91 Strongly Landlord-Friendly · R+18
- County
- — inherits STATE
- City
- — inherits STATE
ZIP-level market 83713
- Home prices YoY
- -26.5%
- Rents YoY
- 4.0%
- Active inventory
- 135
- Price-to-rent
- 4.4×
Monthly cashflow live
- Estimated rent
- $1,607 high interval (Pro) →
- Mortgage (P&I)
- −$446
- Tax est. 1.5%
- −$106 /mo · $1,275/yr
- Insurance
- −$35
- HOA
- −$0
- Vacancy / Maint / Mgmt
- −$337
- Net cashflow
- $682
Break-even live
UW: 25.0% down · 7.5% · 30yr · 1.5% tax · 5.0% vac · 8.0% maint · 8.0% mgmt
Financing live
Cash to close
- Down payment
- $21,250
- Closing costs
- $2,550
- Reserves months
- —
- Total cash needed
- —
Loan-product check · same deal, 3 products live
Conventional
25% down · 7.5% · 30yr
- Down + closing
- —
- Monthly P&I
- —
- Monthly cashflow
- —
- DSCR
- —
- Eligible?
- —
Personal DTI + credit; lowest rate.
DSCR
20% down · 8.5% · 30yr
- Down + closing
- —
- Monthly P&I
- —
- Monthly cashflow
- —
- DSCR
- —
- Eligible?
- —
No personal income docs; deal must DSCR.
Hard money
10% down · 12.0% · 12mo
- Down + closing
- —
- Monthly P&I
- —
- Monthly cashflow
- —
- DSCR
- —
- Eligible?
- —
Short-term bridge; refi at stabilization.
Rent comps 17 comps
| Address | Beds | Baths | Sqft | Rent | $/sqft | DOM | Units | Dist |
|---|---|---|---|---|---|---|---|---|
| 11239 W Gabrielle Dr Boise, ID | 2.0 | 2.5 | 1128 | $1,645 | $1.46 | 23d | 1 | 0.44mi |
| 10077 W Rifleman Ln Unit 103 Boise, ID | 2.0 | 2.0 | 860 | $1,395 | $1.62 | 11d | 1 | 0.48mi |
| 11383 W Fairview Ave Boise, ID | 2.0 | 2.0 | 1123 | $1,575 | $1.40 | 2d | 4 | 0.56mi |
| 9993 W Rosecroft Ct #101 Boise, ID | 2.0 | 2.5 | 1136 | $1,575 | $1.39 | 3d | 1 | 0.62mi |
| 10105 W Garverdale Ln Ste 201 Boise, ID | 2.0 | 2.0 | 915 | $1,350 | $1.48 | 14d | 1 | 0.68mi |
| 9846 W Rosecroft Ct #102 Boise, ID | 2.0 | 2.5 | 1236 | $1,545 | $1.25 | 3d | 1 | 0.72mi |
| 10096 W Garverdale Ln Boise, ID | 3.0 | 2.0 | 1113 | $1,600 | $1.44 | 23d | 1 | 0.73mi |
| 9130 W Irving St Boise, ID | 2.0 | 1.5 | 952 | $1,575 | $1.65 | 3d | 5 | 1.07mi |
| 930 N Maple Grove Rd Boise, ID | 1.0–3.0 | 1.0–2.0 | 950 | $1,920 | $2.02 | 2d | 14 | 1.23mi |
| 10887 W Ustick Rd Boise, ID | 2.0–3.0 | 1.0–2.0 | 874 | $1,345 | $1.54 | 2d | 3 | 1.40mi |
| 2663 N Fastwater Ave Boise, ID | 3.0 | 2.0 | 1204 | $1,795 | $1.49 | 14d | 1 | 1.40mi |
| 9169 W Cory Ln #202 Boise, ID | 2.0 | 1.5 | 968 | $1,395 | $1.44 | 21d | 1 | 1.41mi |
| 10811 W Ustick Rd Boise, ID | 2.0 | 1.0 | 794 | $1,345 | $1.69 | 21d | 1 | 1.41mi |
| 9056 W Sigmont Ln Unit 201 Boise, ID | 2.0 | 2.0 | 900 | $1,300 | $1.44 | 14d | 1 | 1.44mi |
| 10042 W Smoke Ranch Dr Boise, ID | 3.0 | 2.5 | 1478 | $2,050 | $1.39 | 23d | 1 | 1.47mi |
| 8443 W Rifleman St Unit 8443 Boise, ID | 2.0 | 1.0 | 846 | $1,900 | $2.25 | 3d | 1 | 1.49mi |
| 2555 N Workland Ln Unit 202 Boise, ID | 2.0 | 1.0 | 800 | $1,325 | $1.66 | 14d | 1 | 1.50mi |
Listing history 2 events
-
2026-04-24status Pending
-
2026-03-11$85,000 Active
ⓘ Source: listings_history table (triggers on properties + properties_extension) + one-shot
backfill from property_details.listing_events for pre-trigger history.
Nearby sold comps map
Loading sold comps map…
Walkable amenities ~0.75 mi
Loading nearby amenities…
Taxation est. · year 1
- Rental income
- $19,283
- − Mortgage interest
- −$4,761
- − Property taxes
- −$1,275
- − Insurance
- −$425
- − Repairs & maintenance
- −$1,543
- − Management
- −$1,543
- − Depreciation
- −$2,473
- Taxable income
- $7,264
- Est. tax owed @ 24.0%
- −$1,743
- After-tax cash flow
- $6,441/yr
For passive investors: Depreciation is non-cash, so a rental often shows a tax loss while cash-flowing — sheltering income. Rental losses are passive: they offset passive income freely, and up to $25,000/yr can offset ordinary (W-2) income if you actively participate and your MAGI is under $100k (phasing out to $0 by $150k); unused losses carry forward. On sale, claimed depreciation is recaptured at up to 25%, and gains may owe capital-gains tax (a 1031 exchange can defer both). Figures are a year-1 estimate at your 24.0% rate — not tax advice; consult a CPA.
Schools (NCES district)
- District
- Joint School District No. 2
- NCES district ID
- 1602100
- Math proficiency
- 53% ▼ -6.00%
- Reading proficiency
- 67% ▼ -1.00%
- Median HH income
- $64,573
- Composite
- 52.42/100
- National rank
- #1576
- State rank
- #11 of 92 in ID
Livability — Boise City
No livability data for this city. (Only ~50 U.S. cities are tracked.)
Census & demographics
- Census place
- Boise City, ID
- County
- Ada County · 522,161 people
- City population
- 152,689
- Metro
- Boise City, ID
- Population (ZIP)
- 31,549
- Household income
- $91,295
- Rent vs Own
- Severe rent burden
- 805.0
Population outlook (Ada County) Hauer SSP2
- Today (2025)
- 535,818 people
- By 2030
- 585,751 · +9.3%
- By 2040
- 682,435 · +27.4%
- By 2050
- 775,818 · +44.8%
- By 2075
- 994,458 · +85.6%
- By 2100
- 1,148,884 · +114.4%
Race, ethnicity, and origin ACS 2023
- Neighborhood character
- Predominantly White (79%)
- Race & ethnicity
- White 79% Two or more races 10% Hispanic / Latino 10% Asian 3% Black 1%
- Hispanic origin (detail)
- Mexican 8%
- Common ancestry
- Portuguese 4% Slovak 2% Lithuanian 2%
- Foreign-born
- 9% · Canada, Jamaica, China
- Languages at home
- 87% English-only · Spanish 7% Other Indo-European 2% German/W. Germanic 1%
Political lean MEDSL · Ada
- 2024 margin
- R (+10.3) · D 43.4% · R 53.8% · Other 2.8%
- 2008→2024 swing
- -4.2pp toward R · 2008: -6.2pp · 2024: -10.3pp
- All cycles
- 2024: R+10.3 2020: R+3.9 2016: R+9.2 2012: R+11.3 2008: R+6.2
Not yet ingested
- Civics
- —
Market trends
- HPI YoY
- ▼ -122.31%
- Current HPI
- 338.9271
- Rent YoY
- ▲ 4.01%
- Metro
- Boise City, ID
- State GDP YoY
- ▲ 4.51%
- F500 in state
- 6
Industry mix (Fortune 500 HQ in ID)
| Industry | F500 HQs | Revenue |
|---|---|---|
| Retail | 1 | $79B |
|
||
| Technology | 1 | $25B |
|
||
| Food / Agriculture | 1 | $6B |
|
||
Price history
2 events — show timeline
- 2026-04-24 Pending — IMLS
- 2026-03-11 Listed $85,000 IMLS
Cash-flow waterfall
monthlySold comps — $/sqft
last 12 mo · ≤1 miLoading sold comps…