67-87 Booth St Unit 4C · New York, NY
Flood risk 1/10 · Minimal
- FEMA flood zone
- X (unshaded)
- Chance of flooding over 30 yrs
- 0.0%
- Est. flood insurance / yr
- $507 – $1,088
Fire risk 1/10 · Minimal
- Est. fire insurance / yr
- $691 – $1,283
Heat risk 7/10 · Major
- Hot days now (above 99°F)
- 7 days/yr
- Hot days in 30 yrs
- 15 days/yr
Wind risk 6/10 · Moderate
- Chance of severe wind over 30 yrs
- 49.0%
Air-quality risk 5/10 · Moderate
- Unhealthy air days now
- 6 days/yr
- Unhealthy air days in 30 yrs
- 8 days/yr
Risk factors via First Street. Map © Google.
Why this score? — see what drove the F grade
The composite is a weighted blend of 9 inputs, each scored 0–100. Each bar is that input's sub-score; the figure is the points it added to the 100-point composite (weight × sub-score).
- ARV discount +7.5/15.0
- Schools +5.0/10.0
- Cash flow +4.3/30.0
- Rent growth +3.8/5.0
- Livability +3.8/5.0
- 1% rule +3.7/10.0
- Condition / age +2.2/5.0
- DSCR +0.0/10.0
- Appreciation +0.0/10.0
$350,000
🖨 Deal sheet (PDF) 📄 Offer letter ✓ Due diligence
Listing remarks
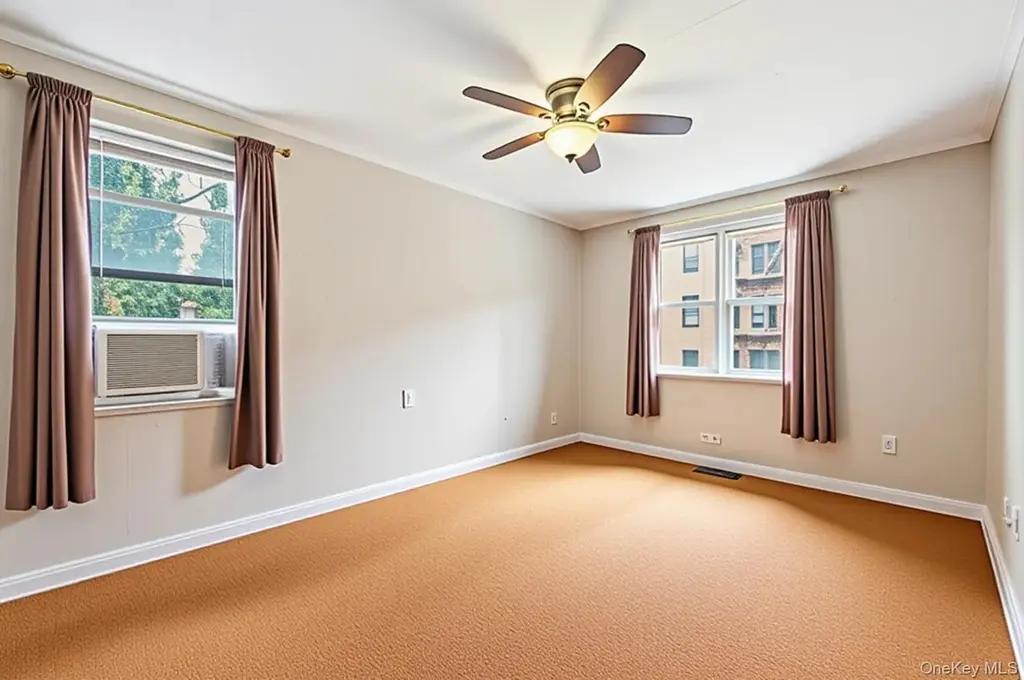
The best deal in Forest Hills! We are super excited to present this well priced Junior 4 (2 bedroom) co-op for sale in Forest Hills, located just a short walk to Austin st and the M/R train at 67th ave. Well priced with affordable monthly maintenance fees, this is truly a great deal for someone looking to become a home owner in one of the most desirable neighborhoods in all of Queens. The apartment itself is well laid out and upon entering the unit you are greeted with the first (and smaller) of the 2 bedrooms. The first bedroom makes for a fantastic home office space, kids room or guest room and comfortably fits a full bed. There are multiple closets in the entryway and as you continue int
Key facts
- Proper dining area
- Soaking tub
- Large kitchen
Tags
Property features AI
Exterior
- Parking: Garage available; No carport
- Utilities: Public sewer; Cable connected; Electricity connected; Natural gas connected; Phone connected; Water connected; Sewer connected
- Home design: Stock cooperative
- Construction: Brick construction
- Exterior features: Brick construction; Not waterfront
Interior
- Kitchen: Dishwasher; Gas cooktop; Refrigerator
- Bedrooms: Entry located on level 4
- Bathrooms: 1 full bathroom
- Heating & cooling: Natural gas heating; Wall/window air conditioning units
- Interior features: Galley-style kitchen; Cats allowed
Neighborhood map
What this means for you Summary
Snapshot
- This is a 2-bed/1.0-bath condo listed at $350k. Condition is rated fair.
Deal economics
- At list price, monthly cash flow is $-926 ($-11k/yr) — negative.
- To cash-flow at today's rent, offer at most $347k (0.8% below list).
- To meet the 1% rule (rent ≥ 1% of price), the offer needs to be $304k (13.3% below list).
- Recommended offer: $304k (13.3% below list) — sets the bar for 1% rule.
Location & tenants
- Location reads 75/100 on livability (#268 in NY, #4,188 nationally) — a middle-class / working-renter tenant base. Strengths: amenities A+, commute A+, health & safety A; Watch: crime F, cost of living F.
- Zoned schools: Ps 144 Col Jeromus Remsen (math 92% / reading 87%, grade A+, #45 of 2,108 statewide, top 3%, 830 students, 24% FRL); Is 227 Louis Armstrong (math 52% / reading 69%, grade B+, #153 of 729 statewide, top 21%, 1,528 students, 68% FRL); Midwood High School (math 94% / reading 96%, grade A+, #83 of 1,100 statewide, top 8%, 4,062 students, 73% FRL).
- Market conditions: Rents rising fast (+5.3%/yr); 620 active listings in the ZIP; 40 comparable units currently listed for rent nearby; rentals at typical pace (median 22d on market — plan ~3-4 weeks tenant-placement turnaround); solid renter incomes; 5,302 units permitted in Queens County in 2024 (4,918 in 5+ unit buildings).
- This rent runs 34% of the median local income ($106k/yr) — at the standard rent-burdened threshold; future hikes will face affordability resistance.
Forward outlook
- Local home prices are declining (-3.0%/yr); year-one equity from $2k of loan paydown is wiped out by about $10k of value loss. Plan a longer hold.
- Queens County population projected at +16% by 2050 — long-run rental-demand tailwind backs the buy-and-hold thesis.
Negotiation context
- It's been on market 81 days — a 6% lower offer ($329k) is reasonable based on typical stale-listing flexibility.
Risks & watch-outs
- Watch-outs: HOA is 30% of rent; built in 1950 — expect roof / HVAC / electrical / plumbing capex.
- Climate carrying-cost: major wind risk, 49% chance of damaging wind over 30y; extreme-heat days projected 7→15/yr by 2055 (HVAC capex compounding) — expect insurance premiums to compound above CPI over the hold.
Questions for the listing agent
- What do current leases actually rent for vs. the listed asking? Can we see a recent rent roll and the last 12 months of T-12 income?
- It's been on market 81 days. Have you received any prior offers? Is the seller open to a 13% concession, seller financing, or rate buy-down credit?
- Have any recent inspections been done? Can we get a copy of the seller's disclosures and any deferred-maintenance estimates?
- Built in 1950 — when were the roof, HVAC, electrical panel, plumbing, and water heater last replaced?
- What does the HOA fee cover, when was the last increase, and are there any pending special assessments or reserve-fund shortfalls?
- Any open or pending special assessments — roof, HVAC, plumbing, elevator, façade? What's the per-unit balance and payoff schedule, and is the seller paying it off at close or rolling it to the buyer?
- Why hasn't it sold? Are there any deal-killer items the seller is aware of (foundation, flood, title, zoning, code violations)?
- Is there a deadline driving the sale (1031 exchange, divorce, estate, relocation)? That informs how much negotiation room exists.
- Schools are B-rated — typically a magnet for longer-tenancy family renters. What's the average tenant stay here, and is there a school-zone premium baked into asking?
- Crime grade is F in this area — have there been break-ins, vandalism, or insurance claims at this property in the last 3 years? What carrier currently insures it and at what premium?
- The area grade is low — what's the realistic commute time and amenity access for the typical tenant pool here? Any planned neighborhood developments (good or bad) we should know about?
- What's the average days-on-market for RENTAL listings here right now (not sales)? A rising rental-DOM trend means longer vacancies and softer asking-rent achievability than the comps imply.
- What's the recent tenant-quality profile in this submarket — average credit score on applications, eviction rate, late-payment / NSF rate, and stable-employment percentage? A property-management company in the area should have these aggregated.
- How much new apartment / multifamily construction is in the pipeline within 1–3 miles? Heavy new supply (>2% of stock underway) typically softens rents 12–24 months out; light construction supports rent growth.
Investment metrics
- 1% rule
- 0.87% ✗
- Cap rate
- 3.12%
- Cash-on-cash
- -11.34%
- DSCR
- 0.50
- GRM
- 9.6
CMA / ARV
No comps found within radius.
Projected returns pro-forma
-3.0% appreciation · 5.3% rent growth · sell at horizon
- IRR
- -32.9%
- Equity multiple
- -0.10×
- Total profit
- $-107,927
- Equity at exit
- $52,186
- IRR
- -24.7%
- Equity multiple
- -0.39×
- Total profit
- $-136,592
- Equity at exit
- $30,262
Cash invested: $98,000 (down + closing). Projections, not guarantees.
Landlord ↔ Tenant lean methodology
- Overall (CITY)
- 0 Strongly Tenant-Friendly
- State New York
- 15 Strongly Tenant-Friendly · D+10
- County
- — inherits STATE
- City New York
- 0 Strongly Tenant-Friendly · D+34
ZIP-level market 11375
- Rents YoY
- 5.3%
- Active inventory
- 620
- Price-to-rent
- 9.6×
Monthly cashflow live
- Estimated rent
- $3,036 high interval (Pro) →
- Mortgage (P&I)
- −$1,835
- Tax est. 1.5%
- −$438 /mo · $5,250/yr
- Insurance
- −$146
- HOA est. from 1 same-building comp
- −$906
- Lot rent
- −$0
- Vacancy / Maint / Mgmt
- −$638
- Net cashflow
- $-926
Break-even live
Sensitivity live
| Price | -10% $-684 | -5% $-805 | +0% $-926 | +5% $-1,047 | +10% $-1,168 |
|---|---|---|---|---|---|
| Rent | -10% $-1,166 | -5% $-1,046 | +0% $-926 | +5% $-806 | +10% $-687 |
| Rate | -1.0pp $-750 | -0.5pp $-837 | base $-926 | +0.5pp $-1,017 | +1.0pp $-1,109 |
UW: 25.0% down · 7.5% · 30yr · 1.5% tax · 5.0% vac · 8.0% maint · 8.0% mgmt
Financing live
Cash to close
- Down payment
- $87,500
- Closing costs
- $10,500
- Reserves months
- —
- Total cash needed
- —
Loan-product check · same deal, 3 products live
Conventional
25% down · 7.5% · 30yr
- Down + closing
- —
- Monthly P&I
- —
- Monthly cashflow
- —
- DSCR
- —
- Eligible?
- —
Personal DTI + credit; lowest rate.
DSCR
20% down · 8.5% · 30yr
- Down + closing
- —
- Monthly P&I
- —
- Monthly cashflow
- —
- DSCR
- —
- Eligible?
- —
No personal income docs; deal must DSCR.
Hard money
10% down · 12.0% · 12mo
- Down + closing
- —
- Monthly P&I
- —
- Monthly cashflow
- —
- DSCR
- —
- Eligible?
- —
Short-term bridge; refi at stabilization.
Rent comps 40 comps
| Address | Beds | Baths | Sqft | Rent | $/sqft | DOM | Units | Dist |
|---|---|---|---|---|---|---|---|---|
| 10010 67th Rd Unit 6L Forest Hills, NY | 1.0 | 1.0 | 845 | $2,700 | $3.20 | 24d | 1 | 0.12mi |
| 10240 67th Dr Unit 1C Forest Hills, NY | 1.0 | 1.5 | 780 | $2,500 | $3.21 | 27d | 1 | 0.13mi |
| 10460 Queens Blvd Forest Hills, NY | 1.0–2.0 | 1.0 | 916 | $4,695 | $5.12 | 7d | 2 | 0.16mi |
| 10025 Queens Blvd Unit 3M Forest Hills, NY | 2.0 | 1.0 | 925 | $2,900 | $3.14 | 27d | 1 | 0.17mi |
| 102-45 67th Rd Forest Hills, NY | 1.0 | 1.0 | 700 | $2,350 | $3.36 | 21d | 1 | 0.18mi |
| 6771 Yellowstone Blvd Unit 2R Forest Hills, NY | 1.0 | 1.0 | 700 | $2,550 | $3.64 | 27d | 1 | 0.19mi |
| 102-55 67th Rd Unit 2V Forest Hills, NY | 1.0 | 1.0 | 633 | $2,350 | $3.71 | 21d | 1 | 0.19mi |
| 67-19 Austin St Unit 4C Flushing, NY | 2.0 | 1.0 | 800 | $3,500 | $4.38 | 16d | 1 | 0.21mi |
| 67-13 Austin St Unit 2A Flushing, NY | 1.0 | 1.0 | 600 | $2,595 | $4.33 | 19d | 1 | 0.22mi |
| 105-25 67th Rd Forest Hills, NY | 1.0 | 1.0 | 750 | $1,800 | $2.40 | 21d | 1 | 0.27mi |
| 98-81 Queens Blvd Unit 14K Rego Park, NY | 2.0 | 2.0 | 950 | $4,490 | $4.73 | 15d | 1 | 0.30mi |
| 98-81 Queens Blvd Unit 15E Rego Park, NY | 1.0 | 1.0 | 700 | $3,335 | $4.76 | 7d | 1 | 0.30mi |
| 9876 Queens Blvd Unit 3A Rego Park, NY | 1.0 | 1.0 | 820 | $2,900 | $3.54 | 27d | 1 | 0.30mi |
| 6739 Clyde St Ph -H Forest Hills, NY | 2.0 | 2.0 | 1100 | $4,100 | $3.73 | 27d | 1 | 0.30mi |
| 6620 Wetherole St Rego Park, NY | 1.0–2.0 | 1.0–2.0 | 700 | $3,300 | $4.71 | 27d | 2 | 0.30mi |
| 6945 108th St Unit 3F Forest Hills, NY | 2.0 | 1.0 | 900 | $3,600 | $4.00 | 8d | 1 | 0.33mi |
| 102-39 66th Ave Unit 1 Flushing, NY | 2.0 | 1.0 | 981 | $3,000 | $3.06 | 3d | 1 | 0.33mi |
| 10620 70th Ave Unit 6B Forest Hills, NY | 1.0 | 1.0 | 765 | $3,600 | $4.71 | 27d | 1 | 0.34mi |
| 6725 Dartmouth St Unit 3L Forest Hills, NY | 2.0 | 1.0 | 800 | $2,700 | $3.38 | 27d | 1 | 0.35mi |
| 10530 66th Ave Unit 3F Forest Hills, NY | 1.0 | 1.0 | 800 | $2,200 | $2.75 | 27d | 1 | 0.36mi |
| 6615 Thornton Pl Rego Park, NY | 1.0 | 1.0 | 700 | $2,672 | $3.82 | 7d | 3 | 0.37mi |
| 10533 66th Ave Unit 3F Forest Hills, NY | 1.0 | 1.0 | 775 | $2,200 | $2.84 | 7d | 1 | 0.37mi |
| 10740 70th Rd Unit 7F Forest Hills, NY | 1.0 | 1.0 | 750 | $2,650 | $3.53 | 27d | 1 | 0.38mi |
| 66-01 Burns St Apt 3v Rego Park, NY | 1.0 | 1.0 | 820 | $2,300 | $2.80 | 22d | 1 | 0.38mi |
| 10523 65th Rd Forest Hills, NY | 2.0 | 2.0 | 760 | $3,200 | $4.21 | 27d | 1 | 0.40mi |
| 97-12 65th Rd Apt 5D Rego Park, NY | 1.0 | 1.0 | 800 | $3,395 | $4.24 | 7d | 1 | 0.40mi |
| 97-12 65th Rd Unit 4-C Rego Park, NY | 1.0 | 1.0 | 650 | $3,350 | $5.15 | 7d | 1 | 0.44mi |
| 97-12 65th Rd Unit 18-E Rego Park, NY | 1.0 | 1.0 | 600 | $3,650 | $6.08 | 1d | 1 | 0.44mi |
| 10525 65th Ave Unit 4F Forest Hills, NY | 2.0 | 1.0 | 980 | $3,998 | $4.08 | 17d | 1 | 0.44mi |
| 9825 64th Rd Unit 8F Rego Park, NY | 2.0 | 1.0 | 850 | $2,400 | $2.82 | 3d | 1 | 0.48mi |
| 9941 64th Ave Rego Park, NY | 1.0–2.0 | 1.0 | 975 | $3,200 | $3.28 | 21d | 2 | 0.49mi |
| 6405 Yellowstone Blvd Unit 403S Forest Hills, NY | 1.0 | 1.0 | 720 | $3,100 | $4.31 | 27d | 1 | 0.50mi |
| 6405 Yellowstone Blvd Flushing, NY | 1.0 | 1.0–1.5 | 920 | $3,075 | $3.34 | 27d | 2 | 0.50mi |
| 9941 64th Ave Unit C16 Rego Park, NY | 2.0 | 1.0 | 1100 | $3,200 | $2.91 | 1d | 1 | 0.51mi |
| 9810 64th Ave Rego Park, NY | 1.0–2.0 | 1.0–2.0 | 850 | $3,200 | $3.76 | 1d | 2 | 0.52mi |
| 9810 64th Ave Rego Park, NY | 1.0 | 1.0 | 825 | $2,125 | $2.58 | 20d | 2 | 0.52mi |
| 11105 66th Ave Unit 2B Forest Hills, NY | 1.0 | 1.0 | 850 | $2,600 | $3.06 | 17d | 1 | 0.56mi |
| 10825 72nd Ave Forest Hills, NY | 1.0–2.0 | 1.0 | 700 | $3,900 | $5.57 | 7d | 2 | 0.56mi |
| 108-25 72nd Ave Unit 6B Flushing, NY | 2.0 | 1.0 | 800 | $3,900 | $4.88 | 1d | 1 | 0.56mi |
| 65-68 Ellwell Cres Unit 2 Flushing, NY | 3.0 | 1.0 | 900 | $3,800 | $4.22 | 27d | 1 | 0.58mi |
HOA detail condo
- Monthly dues
- $0 · $0/yr
- Assessments
- None detected in remarks — confirm with the listing agent.
Listing history 15 events
-
2026-06-22days on market $350,000 Active 81 DOM
-
2026-06-21days on market $350,000 Active 80 DOM
-
2026-06-18days on market $350,000 Active 77 DOM
-
2026-06-17days on market $350,000 Active 76 DOM
-
2026-06-15days on market $350,000 Active 74 DOM
-
2026-06-13days on market $350,000 Active 72 DOM
-
2026-06-10days on market $350,000 Active 68 DOM
-
2026-06-08days on market $350,000 Active 67 DOM
-
2026-06-08days on market $350,000 Active 66 DOM
-
2026-06-04pricedays on market $350,000 Active 63 DOM
-
2026-06-03days on market $375,000 Active 62 DOM
-
2026-06-01days on market $375,000 Active 60 DOM
-
2026-05-31days on market $375,000 Active 59 DOM
-
2026-05-13price $375,000
-
2026-04-01$399,000 Active
ⓘ Source: listings_history table (triggers on properties + properties_extension) + one-shot
backfill from property_details.listing_events for pre-trigger history.
Climate risk First Street
- Flood 1/10 Low FEMA zone X (unshaded) · 0% chance over 30 yrs
- Wildfire 1/10 Low
- Heat 7/10 Severe 7 d/yr ≥99°F today · 15 d/yr by 30 yrs out
- Wind 6/10 Major 49% chance of damaging wind over 30 yrs
- Air quality 5/10 Major 6 unhealthy d/yr today · 8 by 30 yrs out
Nearby sold comps map
Loading sold comps map…
Walkable amenities ~0.75 mi
Loading nearby amenities…
Taxation est. · year 1
- Rental income
- $36,431
- − Mortgage interest
- −$19,605
- − Property taxes
- −$5,250
- − Insurance
- −$1,750
- − Repairs & maintenance
- −$2,915
- − Management
- −$2,915
- − HOA
- −$10,872
- − Depreciation
- −$10,182
- Taxable loss
- −$17,057
- Est. tax savings @ 24.0%
- +$4,094
- After-tax cash flow
- $-7,023/yr
For passive investors: Depreciation is non-cash, so a rental often shows a tax loss while cash-flowing — sheltering income. Rental losses are passive: they offset passive income freely, and up to $25,000/yr can offset ordinary (W-2) income if you actively participate and your MAGI is under $100k (phasing out to $0 by $150k); unused losses carry forward. On sale, claimed depreciation is recaptured at up to 25%, and gains may owe capital-gains tax (a 1031 exchange can defer both). Figures are a year-1 estimate at your 24.0% rate — not tax advice; consult a CPA.
Condition & rehab AI · 13 photos
This condo presents as a good investment opportunity with cosmetic updates needed to enhance its curb appeal and interior aesthetics.
Repairs flagged
- Minor Kitchen countertops — Worn appearance suggests minor repairs or replacement needed.
- Minor Exterior siding — Discoloration and wear indicate minor repairs or repainting needed.
- Minor Interior paint — Wear and discoloration suggest touch-up or repainting needed.
Value-add opportunities
- Both Painting the exterior and interior walls — Fresh paint can significantly improve the home's curb appeal and interior aesthetics, enhancing both resale and rental value.
- Resale Replacing worn kitchen countertops — Modern, durable countertops can increase the home's appeal to potential buyers.
- Both Landscaping improvements — Enhanced landscaping can boost curb appeal and attract more renters.
Renovation cost estimate screening
| Repair item | Severity | Est. cost |
|---|---|---|
| Kitchen countertops · Worn appearance suggests minor repairs or replacement needed. | Minor | $500–3,000 |
| Exterior siding · Discoloration and wear indicate minor repairs or repainting needed. | Minor | $500–3,000 |
| Interior paint · Wear and discoloration suggest touch-up or repainting needed. | Minor | $500–3,000 |
| Total estimated repair cost · 3 items | $1,500–9,000 |
Value-add ROI direction
- Both Painting the exterior and interior walls — Fresh paint can significantly improve the home's curb appeal and interior aesthetics, enhancing both resale and rental value. ↑
- Resale Replacing worn kitchen countertops — Modern, durable countertops can increase the home's appeal to potential buyers. ↑
- Both Landscaping improvements — Enhanced landscaping can boost curb appeal and attract more renters. ↑
ⓘ Cost ranges are severity-bucket heuristics (US national rule-of-thumb). Get contractor quotes + a written scope before underwriting a rehab budget.
Schools (NCES district)
No district data.
Livability — New York
- Score
- 75/100
- State rank
- #268
- US rank
- #4188
Category grades
Schools grade is shown separately in the Schools card above.
Census & demographics
- Census place
- New York, NY
- County
- Queens County · 1,914,869 people
- City population
- 7,731,280
- Metro
- New York-Newark-Jersey City, NY-NJ-PA
- Population (ZIP)
- 76,839
- Household income
- $105,904
- Rent vs Own
- Severe rent burden
- 4101.0
Population outlook (Queens County) Hauer SSP2
- Today (2025)
- 2,546,320 people
- By 2030
- 2,643,059 · +3.8%
- By 2040
- 2,815,563 · +10.6%
- By 2050
- 2,944,423 · +15.6%
- By 2075
- 3,123,338 · +22.7%
- By 2100
- 3,098,688 · +21.7%
Race, ethnicity, and origin ACS 2023
- Neighborhood character
- Diverse neighborhood (Simpson 0.67)
- Race & ethnicity
- White 47% Asian 28% Hispanic / Latino 16% Two or more races 11% Black 3%
- Hispanic origin (detail)
- Mexican 2% Puerto Rican 4% Dominican 1%
- Common ancestry
- Scotch-Irish 8% Romanian 4% Italian 2%
- Foreign-born
- 43% · China, Canada, Jamaica
- Languages at home
- 46% English-only · Chinese 12% Spanish 12% Russian/Polish/Slavic 11%
Political lean MEDSL · Queens
- 2024 margin
- Strong D (+24.6) · D 62.3% · R 37.7%
- 2008→2024 swing
- -26.2pp toward R · 2008: 50.8pp · 2024: 24.6pp
- All cycles
- 2024: D+24.6 2020: D+45.2 2016: D+53.4 2012: D+58.5 2008: D+50.8
Not yet ingested
- Civics
- —
Market trends
- HPI YoY
- ▼ -155.54%
- Current HPI
- 224.4903
- Rent YoY
- ▲ 5.30%
- Metro
- New York-Newark-Jersey City, NY-NJ-PA
- State GDP YoY
- ▲ 2.60%
- F500 in state
- 92
Industry mix (Fortune 500 HQ in NY)
| Industry | F500 HQs | Revenue |
|---|---|---|
| Financial Services | 10 | $950B |
|
||
| Consumer Goods | 9 | $162B |
|
||
| Insurance | 4 | $225B |
|
||
| Telecommunications | 2 | $144B |
|
||
| Pharmaceuticals | 2 | $112B |
|
||
| Media / Entertainment | 2 | $69B |
|
||
Price history
-6.0% since first listed2 events — show timeline
- 2026-05-13 Price Changed $375,000 OneKey® MLS as Distributed by MLS Grid
- 2026-04-01 Listed $399,000 OneKey® MLS as Distributed by MLS Grid
Cash-flow waterfall
monthlySold comps — $/sqft
last 12 mo · ≤1 miLoading sold comps…