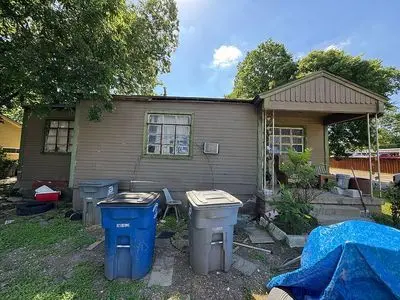
3403 Alabama Ave · Dallas, TX
Flood risk 1/10 · Minimal
- FEMA flood zone
- X (unshaded)
- Chance of flooding over 30 yrs
- 0.0%
- Est. flood insurance / yr
- $507 – $1,088
Fire risk 1/10 · Minimal
- Est. fire insurance / yr
- $1,222 – $2,270
Heat risk 7/10 · Major
- Hot days now (above 110°F)
- 7 days/yr
- Hot days in 30 yrs
- 24 days/yr
Wind risk 6/10 · Moderate
- Chance of severe wind over 30 yrs
- 27.0%
Air-quality risk 2/10 · Minimal
- Unhealthy air days now
- 1 days/yr
- Unhealthy air days in 30 yrs
- 2 days/yr
Risk factors via First Street. Map © Google.
Why this score? — see what drove the B+ grade
The composite is a weighted blend of 9 inputs, each scored 0–100. Each bar is that input's sub-score; the figure is the points it added to the 100-point composite (weight × sub-score).
- Cash flow +27.9/30.0
- ARV discount +15.0/15.0
- 1% rule +10.0/10.0
- DSCR +9.9/10.0
- Livability +4.0/5.0
- Rent growth +3.6/5.0
- Schools +2.8/10.0
- Condition / age +2.5/5.0
- Appreciation +0.0/10.0
$130,000
🖨 Deal sheet 📄 Offer letter ✓ Due diligence
Listing remarks
Investor special in rapidly growing Southern Dallas! This AS-IS property presents an outstanding opportunity for cash investors, flippers, builders, or buy-and-hold landlords looking for their next rehab project. Located in an established neighborhood experiencing continued redevelopment and revitalization, this property offers strong upside potential for renovation or redevelopment. Large lot, quick access to major highways, downtown Dallas, shopping, restaurants, and schools make this an attractive investment opportunity in a high-demand area. Seller is highly motivated and looking for a fast close. Cash buyers only. Bring your contractors, vision, and highest & best offers —
Key facts
- Large lot
- High-demand area
- 0.25 acre lot
Tags
Property features AI
Exterior
- Home design: Built in 1948
- Exterior features: Located in the Cedar Crest subdivision
Neighborhood map
What this means for you Summary
Snapshot
- This is a 3-bed/1.0-bath single-family listed at $130k.
Deal economics
- At list price, monthly cash flow is $402 ($5k/yr) — positive.
- The deal already cash-flows at list — no discount required.
- Meets the 1% rule at list price ($2k rent vs $130k).
- Recommended offer: $128k (1.5% below list) — sets the bar for market timing.
- Cap rate 10.0% vs local median 2.3% in Dallas — top-decile yield for the area; either an underpriced asset or a hidden risk that comps aren't pricing in. Stress-test before assuming the spread holds.
Location & tenants
- Location reads 81/100 on livability (#24 in TX, #1,380 nationally) — a professional / high-income tenant draw. Strengths: amenities A+, commute A+, housing A+; Watch: schools C-, crime F.
- Dallas ISD (urban): math 31% / reading 36% proficiency, ranked #559 of 826 in TX (top 68%) — families likely to look elsewhere, expect single-tenant / working-renter base with shorter leases; 83% free/reduced lunch — lower-income household profile, screen leases tightly.
- Market conditions: Rents rising fast (+4.2%/yr); 249 active listings in the ZIP; 31 comparable units currently listed for rent nearby; rentals at typical pace (median 25d on market — plan ~3-4 weeks tenant-placement turnaround); lower-income renter base — watch delinquency; 12,577 units permitted in Dallas County in 2024 (6,829 in 5+ unit buildings).
- At $1,962/mo this rent would consume 57% of the median local household income ($41k/yr) (locally 2465% of renters already pay >50% of income on rent) — very limited rent-growth headroom before tenants either downsize or default.
Forward outlook
- Local home prices are declining (-3.0%/yr); year-one equity from $899 of loan paydown is wiped out by about $4k of value loss. Plan a longer hold.
- Dallas County population projected at +35% by 2050 — long-run rental-demand tailwind backs the buy-and-hold thesis.
- At projected returns (-3.0% appreciation + 4.2% rent growth), your $36k cash investment doubles in ~8 years — after that, you're playing with house money.
Negotiation context
- It's been on market 24 days — a 2% lower offer ($128k) is reasonable based on typical stale-listing flexibility.
Risks & watch-outs
- Watch-outs: property tax is 3.8% of price; built in 1948 — expect roof / HVAC / electrical / plumbing capex.
- Climate carrying-cost: major wind risk, 27% chance of damaging wind over 30y; extreme-heat days projected 7→24/yr by 2055 (HVAC capex compounding) — expect insurance premiums to compound above CPI over the hold.
Questions for the listing agent
- Built in 1948 — when were the roof, HVAC, electrical panel, plumbing, and water heater last replaced?
- Property tax is high relative to price — has the assessment been appealed recently, and will the sale trigger a re-assessment?
- Is there a deadline driving the sale (1031 exchange, divorce, estate, relocation)? That informs how much negotiation room exists.
- Crime grade is F in this area — have there been break-ins, vandalism, or insurance claims at this property in the last 3 years? What carrier currently insures it and at what premium?
- What's the average days-on-market for RENTAL listings here right now (not sales)? A rising rental-DOM trend means longer vacancies and softer asking-rent achievability than the comps imply.
- What's the recent tenant-quality profile in this submarket — average credit score on applications, eviction rate, late-payment / NSF rate, and stable-employment percentage? A property-management company in the area should have these aggregated.
- How much new for-sale + rental construction is in the pipeline within 1–3 miles? Heavy new supply typically softens prices + rents 12–24 months out; constrained supply supports both.
Investment metrics
- 1% rule
- 1.51% ✓
- Cap rate
- 10.00%
- Cash-on-cash
- 13.25%
- DSCR
- 1.59
- GRM
- 5.5
CMA / ARV
- ARV (on-the-fly)
- $237,444
- Comps found
- 12
Show comp detail 12 sales within ~0.75 mi
| Address | Dist | Beds/Ba | Sqft | Sold | Price | $/sf | Match |
|---|---|---|---|---|---|---|---|
| 3139 Michigan Ave | 0.26mi | 3/1.0 | 1,140 (-10%) | 8mo | $89,900 | $79 | 65 |
| 3924 Vanette Ln | 0.46mi | 3/2.0 | 1,196 (-5%) | 2mo | $260,000 | $217 | 64 |
| 3535 Michigan Ave | 0.21mi | 3/2.0 | 1,150 (-9%) | 10mo | $250,000 | $217 | 64 |
| 3916 Vanette Ln | 0.44mi | 3/2.0 | 1,328 (+5%) | 6mo | $280,000 | $211 | 62 |
| 3110 Utah Ave | 0.67mi | 3/2.0 | 1,220 (-3%) | 2mo | $229,900 | $188 | 57 |
| 2815 Seevers Ave | 0.68mi | 3/1.0 | 1,279 (+1%) | 11mo | $155,000 | $121 | 57 |
| 4045 Wind River Dr | 0.56mi | 4/2.0 (+1) | 1,355 (+7%) | 4mo | $249,990 | $184 | 50 |
| 111 Halsey St | 0.59mi | 3/2.0 | 1,405 (+11%) | 2mo | $305,000 | $217 | 48 |
| 4009 Summitt Ridge Dr | 0.52mi | 3/2.0 | 1,416 (+12%) | 7mo | $249,900 | $176 | 46 |
| 3413 Utah Ave | 0.57mi | 4/2.0 (+1) | 1,147 (-9%) | 10mo | $205,000 | $179 | 41 |
| 3030 Utah Ave | 0.72mi | 3/2.0 | 1,158 (-8%) | 11mo | $239,900 | $207 | 39 |
| 326 Brownlee | 0.67mi | 4/2.0 (+1) | 1,450 (+15%) | 5mo | $270,000 | $186 | 31 |
Match score weights: distance 35% · size 25% · config 20% · recency 20%. Top-matched comps best support the ARV.
Projected returns pro-forma
-3.0% appreciation · 4.2% rent growth · sell at horizon
- IRR
- 4.9%
- Equity multiple
- 1.20×
- Total profit
- $7,105
- Equity at exit
- $19,383
- IRR
- 15.7%
- Equity multiple
- 2.37×
- Total profit
- $49,963
- Equity at exit
- $11,240
Cash invested: $36,400 (down + closing). Projections, not guarantees.
Landlord ↔ Tenant lean methodology
- Overall (STATE)
- 87 Strongly Landlord-Friendly
- State Texas
- 87 Strongly Landlord-Friendly · R+5
- County
- — inherits STATE
- City
- — inherits STATE
ZIP-level market 75216
- Home prices YoY
- -29.7%
- Rents YoY
- 4.2%
- Active inventory
- 249
- Price-to-rent
- 5.5×
Monthly cashflow live
- Estimated rent
- $1,962 high interval (Pro) →
- Mortgage (P&I)
- −$682
- Tax from tax record
- −$412 /mo · $4,949/yr
- Insurance
- −$54
- HOA
- −$0
- Vacancy / Maint / Mgmt
- −$412
- Net cashflow
- $402
Break-even live
UW: 25.0% down · 7.5% · 30yr · 1.5% tax · 5.0% vac · 8.0% maint · 8.0% mgmt
Financing live
Cash to close
- Down payment
- $32,500
- Closing costs
- $3,900
- Reserves months
- —
- Total cash needed
- —
Loan-product check · same deal, 3 products live
Conventional
25% down · 7.5% · 30yr
- Down + closing
- —
- Monthly P&I
- —
- Monthly cashflow
- —
- DSCR
- —
- Eligible?
- —
Personal DTI + credit; lowest rate.
DSCR
20% down · 8.5% · 30yr
- Down + closing
- —
- Monthly P&I
- —
- Monthly cashflow
- —
- DSCR
- —
- Eligible?
- —
No personal income docs; deal must DSCR.
Hard money
10% down · 12.0% · 12mo
- Down + closing
- —
- Monthly P&I
- —
- Monthly cashflow
- —
- DSCR
- —
- Eligible?
- —
Short-term bridge; refi at stabilization.
Rent comps 31 comps
| Address | Beds | Baths | Sqft | Rent | $/sqft | DOM | Units | Dist |
|---|---|---|---|---|---|---|---|---|
| 3608 S Marsalis Ave Dallas, TX | 2.0 | 1.0 | 907 | $1,400 | $1.54 | 44d | 1 | 0.37mi |
| 3702 Conway St Dallas, TX | 2.0–3.0 | 1.5–2.0 | 1033 | $1,595 | $1.54 | 1d | 5 | 0.60mi |
| 2819 Alabama Ave Dallas, TX | 3.0 | 2.0 | 1218 | $1,925 | $1.58 | 44d | 1 | 0.65mi |
| 4117 S Marsalis Ave Dallas, TX | 3.0 | 2.0 | 1296 | $2,200 | $1.70 | 7d | 1 | 0.67mi |
| 2826 Alaska Ave Dallas, TX | 3.0 | 2.0 | 1190 | $1,795 | $1.51 | 24d | 1 | 0.68mi |
| 2844 S Marsalis Ave Dallas, TX | 3.0 | 3.5 | 1788 | $2,300 | $1.29 | 44d | 1 | 0.68mi |
| 2842 S Marsalis Ave Dallas, TX | 3.0 | 3.5 | 1788 | $2,300 | $1.29 | 44d | 1 | 0.68mi |
| 3212 S Llewellyn Ave Dallas, TX | 2.0 | 2.0 | 1040 | $1,750 | $1.68 | 44d | 1 | 0.75mi |
| 3806 Morning Springs Trl Dallas, TX | 3.0 | 2.0 | 1512 | $2,300 | $1.52 | 19d | 1 | 0.75mi |
| 3828 Morning Springs Trl Dallas, TX | 3.0 | 2.0 | 1399 | $2,200 | $1.57 | 22d | 1 | 0.77mi |
| 3504 Fawn Valley Dr Dallas, TX | 1.0–3.0 | 1.0–2.0 | 790 | $1,350 | $1.71 | 15d | 1 | 0.84mi |
| 1334 Marfa Ave Dallas, TX | 3.0 | 2.0 | 1100 | $1,475 | $1.34 | 44d | 1 | 0.86mi |
| 620 Lacewood Dr Dallas, TX | 3.0 | 1.0 | 1218 | $1,750 | $1.44 | 3d | 1 | 0.87mi |
| 2634 Seevers Ave Dallas, TX | 3.0 | 2.0 | 1000 | $1,800 | $1.80 | 24d | 1 | 0.87mi |
| 3523 Fawn Valley Dr Dallas, TX | 1.0–2.0 | 1.0–1.5 | 796 | $1,200 | $1.51 | 15d | 1 | 0.92mi |
| 3311 S Vernon Ave Dallas, TX | 1.0–2.0 | 1.0–1.5 | 929 | $1,325 | $1.43 | 1d | 15 | 0.93mi |
| 625 W Pentagon Parkway Cir Dallas, TX | 3.0 | 2.0 | 1371 | $2,150 | $1.57 | 7d | 1 | 0.94mi |
| 1510 Maywood Ave Dallas, TX | 4.0 | 2.5 | 1869 | $2,220 | $1.19 | 44d | 1 | 0.96mi |
| 1618 Marfa Ave Dallas, TX | 3.0 | 2.0 | 1100 | $1,900 | $1.73 | 44d | 1 | 1.07mi |
| 621 Tarryall Dr Dallas, TX | 4.0 | 2.0 | 1756 | $2,200 | $1.25 | 7d | 1 | 1.08mi |
| 2423 Maryland Ave Dallas, TX | 2.0 | 2.0 | 1102 | $2,350 | $2.13 | 44d | 1 | 1.12mi |
| 2611 Fernwood Ave Dallas, TX | 3.0 | 2.0 | 1528 | $2,000 | $1.31 | 24d | 1 | 1.12mi |
| 2406 S Marsalis Ave Dallas, TX | 2.0 | 1.0 | 956 | $1,700 | $1.78 | 44d | 1 | 1.14mi |
| 3288 S Polk St Dallas, TX | 1.0–3.0 | 1.0 | 861 | $1,300 | $1.51 | 44d | 1 | 1.14mi |
| 3930 S Denley Dr Dallas, TX | 3.0 | 2.0 | 1135 | $1,900 | $1.67 | 7d | 1 | 1.29mi |
| 2126 Ramsey Ave Dallas, TX | 4.0 | 1.5 | 1416 | $2,300 | $1.62 | 44d | 1 | 1.29mi |
| 2123 Ramsey Ave Dallas, TX | 4.0 | 2.0 | 1727 | $2,999 | $1.74 | 24d | 1 | 1.30mi |
| 3702 Legendary Ln Dallas, TX | 1.0–3.0 | 1.0–2.0 | 990 | $1,099 | $1.11 | 3d | 6 | 1.35mi |
| 4918 Rockport Dr Dallas, TX | 3.0 | 2.0 | 1673 | $1,800 | $1.08 | 7d | 1 | 1.37mi |
| 1214 Adelaide Dr Dallas, TX | 3.0 | 1.0 | 1200 | $1,875 | $1.56 | 2d | 1 | 1.43mi |
| 1214 Adelaide Dr Dallas, TX | 3.0 | 1.0 | 1040 | $2,350 | $2.26 | 7d | 1 | 1.43mi |
Listing history 22 events
-
2026-06-18days on market $130,000 Active 24 DOM
-
2026-06-17days on market $130,000 Active 23 DOM
-
2026-06-16days on market $130,000 Active 22 DOM
-
2026-06-15days on market $130,000 Active 21 DOM
-
2026-06-13statusdays on market $130,000 Active 19 DOM
-
2026-06-09days on market $130,000 Active Option Contract 15 DOM
-
2026-06-08statusdays on market $130,000 Active Option Contract 14 DOM
-
2026-06-07days on market $130,000 Active 13 DOM
-
2026-06-04days on market $130,000 Active 10 DOM
-
2026-06-03days on market $130,000 Active 9 DOM
-
2026-06-02days on market $130,000 Active 8 DOM
-
2026-06-01days on market $130,000 Active 7 DOM
-
2026-05-31days on market $130,000 Active 6 DOM
-
2026-05-22$155,000 Active
-
2016-09-09soldstatus
-
2016-03-04soldstatus
-
2009-04-14soldstatus
-
2008-11-11soldstatus
-
2005-06-07soldstatus
-
2004-12-29soldstatus
-
2000-02-11soldstatus
-
1998-09-18soldstatus
ⓘ Source: listings_history table (triggers on properties + properties_extension) + one-shot
backfill from property_details.listing_events for pre-trigger history.
Tax reassessment forecast TX · Resets to sale price
- Current annual tax
- $4,949 · $412/mo
- Projected year-2 tax
- $4,949 · $412/mo
- Expected delta
- $0/yr ($0/mo · 0.0%)
ⓘ Screening estimate from a state-policy table — verify with the county assessor before closing.
Climate risk First Street
- Flood 1/10 Low FEMA zone X (unshaded) · 0% chance over 30 yrs
- Wildfire 1/10 Low
- Heat 7/10 Severe 7 d/yr ≥110°F today · 24 d/yr by 30 yrs out
- Wind 6/10 Major 27% chance of damaging wind over 30 yrs
- Air quality 2/10 Low 1 unhealthy d/yr today · 2 by 30 yrs out
Nearby sold comps map
Loading sold comps map…
Walkable amenities ~0.75 mi
Loading nearby amenities…
Taxation est. · year 1
- Rental income
- $23,546
- − Mortgage interest
- −$7,282
- − Property taxes
- −$4,949
- − Insurance
- −$650
- − Repairs & maintenance
- −$1,884
- − Management
- −$1,884
- − Depreciation
- −$3,782
- Taxable income
- $3,116
- Est. tax owed @ 24.0%
- −$748
- After-tax cash flow
- $4,074/yr
For passive investors: Depreciation is non-cash, so a rental often shows a tax loss while cash-flowing — sheltering income. Rental losses are passive: they offset passive income freely, and up to $25,000/yr can offset ordinary (W-2) income if you actively participate and your MAGI is under $100k (phasing out to $0 by $150k); unused losses carry forward. On sale, claimed depreciation is recaptured at up to 25%, and gains may owe capital-gains tax (a 1031 exchange can defer both). Figures are a year-1 estimate at your 24.0% rate — not tax advice; consult a CPA.
Schools (NCES district)
- District
- Dallas ISD
- NCES district ID
- 4816230
- Math proficiency
- 31% ▼ -16.00%
- Reading proficiency
- 36% ▼ -4.00%
- Median HH income
- $42,881
- Composite
- 28.41/100
- National rank
- #6763
- State rank
- #559 of 826 in TX
Livability — Dallas
- Score
- 81/100
- State rank
- #24
- US rank
- #1380
Category grades
Schools grade is shown separately in the Schools card above.
Census & demographics
- Census place
- Dallas, TX
- County
- Dallas County · 2,612,404 people
- City population
- 1,168,437
- Metro
- Dallas-Fort Worth-Arlington, TX
- Population (ZIP)
- 55,894
- Household income
- $41,386
- Rent vs Own
- Severe rent burden
- 2465.0
Population outlook (Dallas County) Hauer SSP2
- Today (2025)
- 2,979,839 people
- By 2030
- 3,191,823 · +7.1%
- By 2040
- 3,619,611 · +21.5%
- By 2050
- 4,026,915 · +35.1%
- By 2075
- 4,957,073 · +66.4%
- By 2100
- 5,508,725 · +84.9%
Race, ethnicity, and origin ACS 2023
- Neighborhood character
- Majority Black (51%)
- Race & ethnicity
- Black 51% Hispanic / Latino 44% Two or more races 14% White 3%
- Hispanic origin (detail)
- Mexican 40%
- Common ancestry
- Hispanic 1%
- Foreign-born
- 17% · Canada
- Languages at home
- 62% English-only · Spanish 37%
Political lean MEDSL · Dallas
- 2024 margin
- Strong D (+22.2) · D 60.2% · R 38.0% · Other 1.8%
- 2008→2024 swing
- +6.9pp toward D · 2008: 15.3pp · 2024: 22.2pp
- All cycles
- 2024: D+22.2 2020: D+31.6 2016: D+26.2 2012: D+15.4 2008: D+15.3
Not yet ingested
- Civics
- —
Market trends
- HPI YoY
- ▼ -126.35%
- Current HPI
- 299.1825
- Rent YoY
- ▲ 4.20%
- Metro
- Dallas-Fort Worth-Arlington, TX
- State GDP YoY
- ▲ 3.95%
- F500 in state
- 110
Industry mix (Fortune 500 HQ in TX)
| Industry | F500 HQs | Revenue |
|---|---|---|
| Energy | 16 | $1,198B |
|
||
| Technology | 5 | $198B |
|
||
| Engineering / Construction | 4 | $72B |
|
||
| Energy Services | 3 | $60B |
|
||
| Utilities | 3 | $41B |
|
||
| Healthcare | 2 | $330B |
|
||
Price history
9 events — show timeline
- 2026-05-22 Listed $155,000 FSBO.com
- 2016-09-09 Sold (Public Records) — Public Records
- 2016-03-04 Sold (Public Records) — Public Records
- 2009-04-14 Sold (Public Records) — Public Records
- 2008-11-11 Sold (Public Records) — Public Records
- 2005-06-07 Sold (Public Records) — Public Records
- 2004-12-29 Sold (Public Records) — Public Records
- 2000-02-11 Sold (Public Records) — Public Records
- 1998-09-18 Sold (Public Records) — Public Records
Property tax history
+9.7%/yrLatest (2025): $4,949 · -0.4% YoY. Source: county tax records.
Cash-flow waterfall
monthlySold comps — $/sqft
last 12 mo · ≤1 miLoading sold comps…