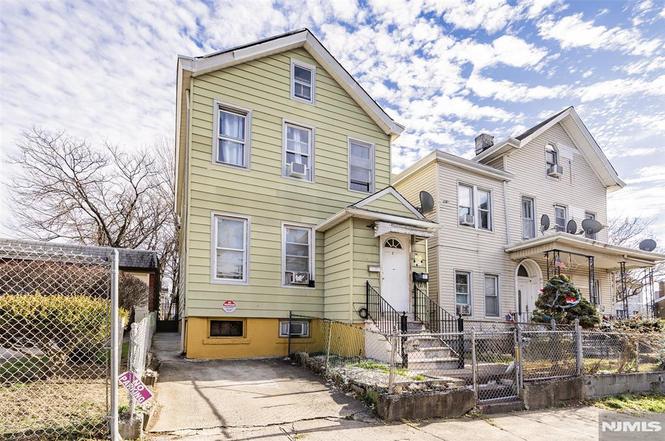
11 Mercer St · Paterson, NJ
Flood risk 1/10 · Minimal
- FEMA flood zone
- X (unshaded)
- Chance of flooding over 30 yrs
- 0.0%
- Est. flood insurance / yr
- $507 – $1,088
Fire risk 1/10 · Minimal
- Est. fire insurance / yr
- $526 – $976
Heat risk 7/10 · Major
- Hot days now (above 100°F)
- 7 days/yr
- Hot days in 30 yrs
- 15 days/yr
Wind risk 6/10 · Moderate
- Chance of severe wind over 30 yrs
- 27.0%
Air-quality risk 4/10 · Minor
- Unhealthy air days now
- 3 days/yr
- Unhealthy air days in 30 yrs
- 5 days/yr
Risk factors via First Street. Map © Google.
Why this score? — see what drove the F grade
The composite is a weighted blend of 9 inputs, each scored 0–100. Each bar is that input's sub-score; the figure is the points it added to the 100-point composite (weight × sub-score).
- Appreciation +8.9/10.0
- ARV discount +7.5/15.0
- Cash flow +4.6/30.0
- Livability +3.5/5.0
- Rent growth +2.5/5.0
- Condition / age +2.5/5.0
- Schools +1.3/10.0
- 1% rule +0.2/10.0
- DSCR +0.0/10.0
$480,000
🖨 Deal sheet 📄 Offer letter ✓ Due diligence
Listing remarks MLS
Great opportunity for investors or first time buyers. This conveniently located 4 bedroom, 3 bath home features a finished basement and 1 parking spot. Close to shopping, transportation and local amenities. Property sold as is, no repairs or credits. Equipped with solar panels offering potential energy savings. Best and Highest due Tuesday 2/24 5pm.
Key facts
- Finished basement
- Solar panels
- 1,873 sq ft lot
Tags
Property features AI
Finance
- Other: Listing is residential income (investment) property
- Financial info: Annual tax amount reported
- HOA & community: Not specified
Exterior
- Parking: Not specified
- Security: Not specified
- Utilities: Utilities: See remarks
- Home design: Multifamily residence
- Construction: Not specified
- Exterior features: Residential income property
Interior
- Kitchen: Details not provided
- Bedrooms: Not specified
- Flooring: Not specified
- Bathrooms: 3 full bathrooms
- Heating & cooling: Not specified
- Interior features: 10 total rooms
- Laundry & utility: No laundry facilities
Neighborhood map
What this means for you Summary
Snapshot
- This is a 4-bed/3.0-bath single-family listed at $480k.
Deal economics
- At list price, monthly cash flow is $-1k ($-15k/yr) — negative.
- To cash-flow at today's rent, offer at most $265k (44.8% below list).
- To meet the 1% rule (rent ≥ 1% of price), the offer needs to be $250k (47.8% below list).
- Recommended offer: $250k (47.8% below list) — sets the bar for 1% rule.
Location & tenants
- Location reads 69/100 on livability (#293 in NJ) — a middle-class / working-renter tenant base. Strengths: amenities A+, commute A+, health & safety A; Watch: schools D, employment D, crime F.
- Paterson Public School District (suburban): math 6% / reading 26% proficiency, ranked #458 of 472 in NJ (top 97%) — low school quality limits family demand, transient renter base, plan for 1-2y turnover; 83% free/reduced lunch — lower-income household profile, screen leases tightly.
- Market conditions: 11 active listings in the ZIP; 19 comparable units currently listed for rent nearby; rentals at typical pace (median 25d on market — plan ~3-4 weeks tenant-placement turnaround); 860 units permitted in Passaic County in 2024 (614 in 5+ unit buildings).
- At $2,504/mo this rent would consume 61% of the median local household income ($49k/yr) (locally 1287% of renters already pay >50% of income on rent) — very limited rent-growth headroom before tenants either downsize or default.
Forward outlook
- In year one you build about $40k of equity ($3k loan paydown + $37k appreciation (7.7% local appreciation)).
- Passaic County population projected at +5% by 2050 — modest demand growth; plan on rents tracking national, not racing it.
- By year 2, paydown + projected appreciation supports a ~$65k cash-out refi (75% LTV) — recoverable capital for the next deal without selling this one.
Negotiation context
- It's been on market 136 days — a 12% lower offer ($422k) is reasonable based on typical stale-listing flexibility.
- 2 sale attempts with the ask held roughly flat each time — persistent listings suggest the price (not the market) is what's stuck; bring a comps-based counter.
- Current owner paid $248k; list at $480k implies a 94% gain — meaningful room to come down on a strong offer.
Risks & watch-outs
- Climate carrying-cost: major wind risk, 27% chance of damaging wind over 30y; extreme-heat days projected 7→15/yr by 2055 (HVAC capex compounding) — expect insurance premiums to compound above CPI over the hold.
Questions for the listing agent
- What do current leases actually rent for vs. the listed asking? Can we see a recent rent roll and the last 12 months of T-12 income?
- It's been on market 136 days. Have you received any prior offers? Is the seller open to a 48% concession, seller financing, or rate buy-down credit?
- Why hasn't it sold? Are there any deal-killer items the seller is aware of (foundation, flood, title, zoning, code violations)?
- Is there a deadline driving the sale (1031 exchange, divorce, estate, relocation)? That informs how much negotiation room exists.
- Schools are D-rated, which usually means shorter tenancies and higher turnover. Who's the typical renter profile here, and what's been the actual vacancy rate?
- Crime grade is F in this area — have there been break-ins, vandalism, or insurance claims at this property in the last 3 years? What carrier currently insures it and at what premium?
- The area grade is low — what's the realistic commute time and amenity access for the typical tenant pool here? Any planned neighborhood developments (good or bad) we should know about?
- What's the average days-on-market for RENTAL listings here right now (not sales)? A rising rental-DOM trend means longer vacancies and softer asking-rent achievability than the comps imply.
- What's the recent tenant-quality profile in this submarket — average credit score on applications, eviction rate, late-payment / NSF rate, and stable-employment percentage? A property-management company in the area should have these aggregated.
- How much new for-sale + rental construction is in the pipeline within 1–3 miles? Heavy new supply typically softens prices + rents 12–24 months out; constrained supply supports both.
Investment metrics
- 1% rule
- 0.52% ✗
- Cap rate
- 3.25%
- Cash-on-cash
- -10.86%
- DSCR
- 0.52
- GRM
- 16.0
CMA / ARV
No comps found within radius.
Projected returns pro-forma
7.71% appreciation · 3.0% rent growth · sell at horizon
- IRR
- 11.2%
- Equity multiple
- 1.83×
- Total profit
- $111,334
- Equity at exit
- $355,194
- IRR
- 11.9%
- Equity multiple
- 3.83×
- Total profit
- $380,326
- Equity at exit
- $696,208
Cash invested: $134,400 (down + closing). Projections, not guarantees.
Landlord ↔ Tenant lean methodology
- Overall (STATE)
- 21 Tenant-Leaning
- State New Jersey
- 21 Tenant-Leaning · D+6
- County
- — inherits STATE
- City
- — inherits STATE
ZIP-level market 07524
- Home prices YoY
- 2.1%
- Active inventory
- 11
- Price-to-rent
- 16.0×
Monthly cashflow live
- Estimated rent
- $2,504 high interval (Pro) →
- Mortgage (P&I)
- −$2,517
- Tax from tax record
- −$477 /mo · $5,730/yr
- Insurance
- −$200
- HOA
- −$0
- Vacancy / Maint / Mgmt
- −$526
- Net cashflow
- $-1,216
Break-even live
UW: 25.0% down · 7.5% · 30yr · 1.5% tax · 5.0% vac · 8.0% maint · 8.0% mgmt
Financing live
Cash to close
- Down payment
- $120,000
- Closing costs
- $14,400
- Reserves months
- —
- Total cash needed
- —
Loan-product check · same deal, 3 products live
Conventional
25% down · 7.5% · 30yr
- Down + closing
- —
- Monthly P&I
- —
- Monthly cashflow
- —
- DSCR
- —
- Eligible?
- —
Personal DTI + credit; lowest rate.
DSCR
20% down · 8.5% · 30yr
- Down + closing
- —
- Monthly P&I
- —
- Monthly cashflow
- —
- DSCR
- —
- Eligible?
- —
No personal income docs; deal must DSCR.
Hard money
10% down · 12.0% · 12mo
- Down + closing
- —
- Monthly P&I
- —
- Monthly cashflow
- —
- DSCR
- —
- Eligible?
- —
Short-term bridge; refi at stabilization.
Rent comps 19 comps
| Address | Beds | Baths | Sqft | Rent | $/sqft | DOM | Units | Dist |
|---|---|---|---|---|---|---|---|---|
| 103 Lyon St Unit 2 Paterson, NJ | 3.0 | 1.0 | 1500 | $2,060 | $1.37 | 24d | 1 | 0.01mi |
| 85 Holsman St Paterson, NJ | 3.0 | 1.0 | 950 | $1,775 | $1.87 | 24d | 1 | 0.46mi |
| 393 Madison Ave Unit 1 Paterson, NJ | 3.0 | 1.0 | 1000 | $2,200 | $2.20 | 21d | 1 | 0.49mi |
| 116 N 1st St Unit 2 Paterson, NJ | 3.0 | 2.0 | 1000 | $2,200 | $2.20 | 24d | 1 | 0.51mi |
| 290 Governor St Paterson, NJ | 3.0 | 3.0 | 1100 | $2,800 | $2.55 | 24d | 1 | 0.53mi |
| 517 E 18th St Paterson, NJ | 3.0 | 1.0 | 850 | $1,800 | $2.12 | 24d | 1 | 0.55mi |
| 171 Godwin Ave Unit 3 Paterson, NJ | 3.0 | 1.0 | 950 | $1,750 | $1.84 | 18d | 1 | 0.57mi |
| 209 N 4th St Unit 1st Floor Paterson, NJ | 3.0 | 1.0 | 800 | $2,350 | $2.94 | 24d | 1 | 0.59mi |
| 209 N 4th St Paterson, NJ | 3.0 | 1.0 | 800 | $2,350 | $2.94 | 1d | 1 | 0.59mi |
| 225 E 19th St Unit 2 Paterson, NJ | 3.0 | 1.0 | 1200 | $2,900 | $2.42 | 24d | 1 | 0.59mi |
| 200 Godwin Ave Paterson, NJ | 3.0 | 1.0 | 1500 | $2,400 | $1.60 | 24d | 1 | 0.62mi |
| 307 N 7th St Unit 2 Prospect Park, NJ | 4.0 | 2.0 | 1380 | $3,600 | $2.61 | 1d | 1 | 0.66mi |
| 132 N 3rd St Paterson, NJ | 1.0–3.0 | 1.0 | 700 | $2,200 | $3.14 | 13d | 2 | 0.68mi |
| 85 Jefferson St Unit 2 Paterson, NJ | 3.0 | 1.5 | 1000 | $2,250 | $2.25 | 5d | 1 | 0.69mi |
| 550 E 25th St Unit 2 Paterson, NJ | 4.0 | 2.0 | 1000 | $3,300 | $3.30 | 5d | 1 | 0.80mi |
| 145 E 31st St Paterson, NJ | 3.0 | 1.0 | 906 | $2,300 | $2.54 | 4d | 1 | 1.06mi |
| 36 W Prospect St Unit 1 Hawthorne, NJ | 3.0 | 1.5 | 1100 | $2,750 | $2.50 | 24d | 1 | 1.16mi |
| 265 Fairview Ave Prospect Park, NJ | 3.0 | 1.0 | 1488 | $2,900 | $1.95 | 1d | 1 | 1.20mi |
| 393 Straight St Apt 2 Paterson, NJ | 3.0 | 1.0 | 1000 | $2,100 | $2.10 | 24d | 1 | 1.30mi |
Listing history 25 events
-
2026-06-18days on market $480,000 Active 136 DOM
-
2026-06-17pricestatusdays on market $480,000 Active 135 DOM
-
2026-06-16days on market $399,000 Active Under Contract 134 DOM
-
2026-06-15days on market $399,000 Active Under Contract 133 DOM
-
2026-06-13days on market $399,000 Active Under Contract 131 DOM
-
2026-06-13days on market $399,000 Active Under Contract 130 DOM
-
2026-06-09days on market $399,000 Active Under Contract 127 DOM
-
2026-06-08days on market $399,000 Active Under Contract 126 DOM
-
2026-06-07days on market $399,000 Active Under Contract 125 DOM
-
2026-06-04days on market $399,000 Active Under Contract 122 DOM
-
2026-06-03days on market $399,000 Active Under Contract 121 DOM
-
2026-06-02days on market $399,000 Active Under Contract 120 DOM
-
2026-06-01days on market $399,000 Active Under Contract 119 DOM
-
2026-05-31days on market $399,000 Active Under Contract 118 DOM
-
2026-03-09status Under Contract 356-char remark
Show marketing remark (356 chars)
Great opportunity for investors or first time buyers. This conveniently located 4 bedroom, 3 bath home features a finished basement and 1 parking spot. Close to shopping, transportation and local amenities. Property sold as is, no repairs or credits. Equipped with solar panels offering potential energy savings. Best and Highest due Tuesday 2/24 5pm.
-
2026-02-11price $399,000 356-char remark
Show marketing remark (356 chars)
Great opportunity for investors or first time buyers. This conveniently located 4 bedroom, 3 bath home features a finished basement and 1 parking spot. Close to shopping, transportation and local amenities. Property sold as is, no repairs or credits. Equipped with solar panels offering potential energy savings. Best and Highest due Tuesday 2/24 5pm.
-
2026-02-11price $399,000
Show marketing remark (356 chars)
Great opportunity for investors or first time buyers. This conveniently located 4 bedroom, 3 bath home features a finished basement and 1 parking spot. Close to shopping, transportation and local amenities. Property sold as is, no repairs or credits. Equipped with solar panels offering potential energy savings. Best and Highest due Tuesday 2/24 5pm.
-
2026-02-03$480,000 Active
-
2026-02-01$480,000 Active 356-char remark
Show marketing remark (356 chars)
Great opportunity for investors or first time buyers. This conveniently located 4 bedroom, 3 bath home features a finished basement and 1 parking spot. Close to shopping, transportation and local amenities. Property sold as is, no repairs or credits. Equipped with solar panels offering potential energy savings. Best and Highest due Tuesday 2/24 5pm.
-
2007-08-29soldstatus $248,000
-
2004-10-14soldstatus $150,000
-
2004-07-21soldstatus $170,000
-
2002-05-31soldstatus $130,000
-
2002-04-25soldstatus $75,900
-
1999-05-03soldstatus $116,000
ⓘ Source: listings_history table (triggers on properties + properties_extension) + one-shot
backfill from property_details.listing_events for pre-trigger history.
Tax reassessment forecast NJ · Partial reset (capped growth)
- Current annual tax
- $5,730 · $477/mo
- Projected year-2 tax
- $8,841 · $737/mo
- Expected delta
- +$3,111/yr (+$259/mo · 54.3%)
ⓘ Screening estimate from a state-policy table — verify with the county assessor before closing.
Climate risk First Street
- Flood 1/10 Low FEMA zone X (unshaded) · 0% chance over 30 yrs
- Wildfire 1/10 Low
- Heat 7/10 Severe 7 d/yr ≥100°F today · 15 d/yr by 30 yrs out
- Wind 6/10 Major 27% chance of damaging wind over 30 yrs
- Air quality 4/10 Moderate 3 unhealthy d/yr today · 5 by 30 yrs out
Nearby sold comps map
Loading sold comps map…
Walkable amenities ~0.75 mi
Loading nearby amenities…
Taxation est. · year 1
- Rental income
- $30,054
- − Mortgage interest
- −$26,887
- − Property taxes
- −$5,730
- − Insurance
- −$2,400
- − Repairs & maintenance
- −$2,404
- − Management
- −$2,404
- − Depreciation
- −$13,964
- Taxable loss
- −$23,736
- Est. tax savings @ 24.0%
- +$5,697
- After-tax cash flow
- $-8,897/yr
For passive investors: Depreciation is non-cash, so a rental often shows a tax loss while cash-flowing — sheltering income. Rental losses are passive: they offset passive income freely, and up to $25,000/yr can offset ordinary (W-2) income if you actively participate and your MAGI is under $100k (phasing out to $0 by $150k); unused losses carry forward. On sale, claimed depreciation is recaptured at up to 25%, and gains may owe capital-gains tax (a 1031 exchange can defer both). Figures are a year-1 estimate at your 24.0% rate — not tax advice; consult a CPA.
Schools (NCES district)
- District
- Paterson Public School District
- NCES district ID
- 3412690
- Math proficiency
- 6% ▼ -12.00%
- Reading proficiency
- 26% ▼ -4.00%
- Median HH income
- $34,365
- Composite
- 13.02/100
- National rank
- #9568
- State rank
- #458 of 472 in NJ
Livability — Paterson
- Score
- 69/100
- State rank
- #293
- US rank
- #8763
Category grades
Schools grade is shown separately in the Schools card above.
Census & demographics
- Census place
- Paterson, NJ
- County
- Passaic County · 360,294 people
- City population
- 85,452
- Metro
- New York-Newark-Jersey City, NY-NJ-PA
- Population (ZIP)
- 13,808
- Household income
- $49,103
- Rent vs Own
- Severe rent burden
- 1287.0
Population outlook (Passaic County) Hauer SSP2
- Today (2025)
- 525,915 people
- By 2030
- 532,160 · +1.2%
- By 2040
- 543,670 · +3.4%
- By 2050
- 554,326 · +5.4%
- By 2075
- 584,728 · +11.2%
- By 2100
- 598,978 · +13.9%
Race, ethnicity, and origin ACS 2023
- Neighborhood character
- Predominantly Hispanic (72%)
- Race & ethnicity
- Hispanic / Latino 72% Two or more races 40% Black 26% White 1%
- Hispanic origin (detail)
- Mexican 2% Puerto Rican 12% Dominican 35%
- Foreign-born
- 46% · Canada, Jamaica, Guatemala
- Languages at home
- 31% English-only · Spanish 69% Other Indo-European 1%
Political lean MEDSL · Passaic
- 2024 margin
- Toss-up / Even · D 46.9% · R 49.8% · Other 3.3%
- 2008→2024 swing
- -24.6pp toward R · 2008: 21.7pp · 2024: -2.9pp
- All cycles
- 2024: R+2.9 2020: D+16.5 2016: D+21.8 2012: D+27.3 2008: D+21.7
Not yet ingested
- Civics
- —
Market trends
- HPI YoY
- ▲ 7.71%
- Current HPI
- 374.7398
- Rent YoY
- —
- Metro
- New York-Newark-Jersey City, NY-NJ-PA
- State GDP YoY
- ▲ 2.05%
- F500 in state
- 34
Industry mix (Fortune 500 HQ in NJ)
| Industry | F500 HQs | Revenue |
|---|---|---|
| Consumer Goods | 3 | $31B |
|
||
| Pharmaceuticals | 2 | $153B |
|
||
| Technology | 2 | $21B |
|
||
| Insurance | 2 | $20B |
|
||
| Healthcare | 2 | $19B |
|
||
| Financial Services | 1 | $70B |
|
||
Price history
+244.0% since first listed11 events — show timeline
- 2026-03-09 Pending — GSMLS
- 2026-02-11 Price Changed $399,000 GSMLS
- 2026-02-11 Price Changed $399,000 NJMLS
- 2026-02-03 Listed $480,000 NJMLS
- 2026-02-01 Listed $480,000 GSMLS
- 2007-08-29 Sold (Public Records) $248,000 Public Records
- 2004-10-14 Sold (Public Records) $150,000 Public Records
- 2004-07-21 Sold (Public Records) $170,000 Public Records
- 2002-05-31 Sold (Public Records) $130,000 Public Records
- 2002-04-25 Sold (Public Records) $75,900 Public Records
- 1999-05-03 Sold (Public Records) $116,000 Public Records
Property tax history
+0.1%/yrLatest (2025): $5,730 · +4.7% YoY. Source: county tax records.
Cash-flow waterfall
monthlySold comps — $/sqft
last 12 mo · ≤1 miLoading sold comps…