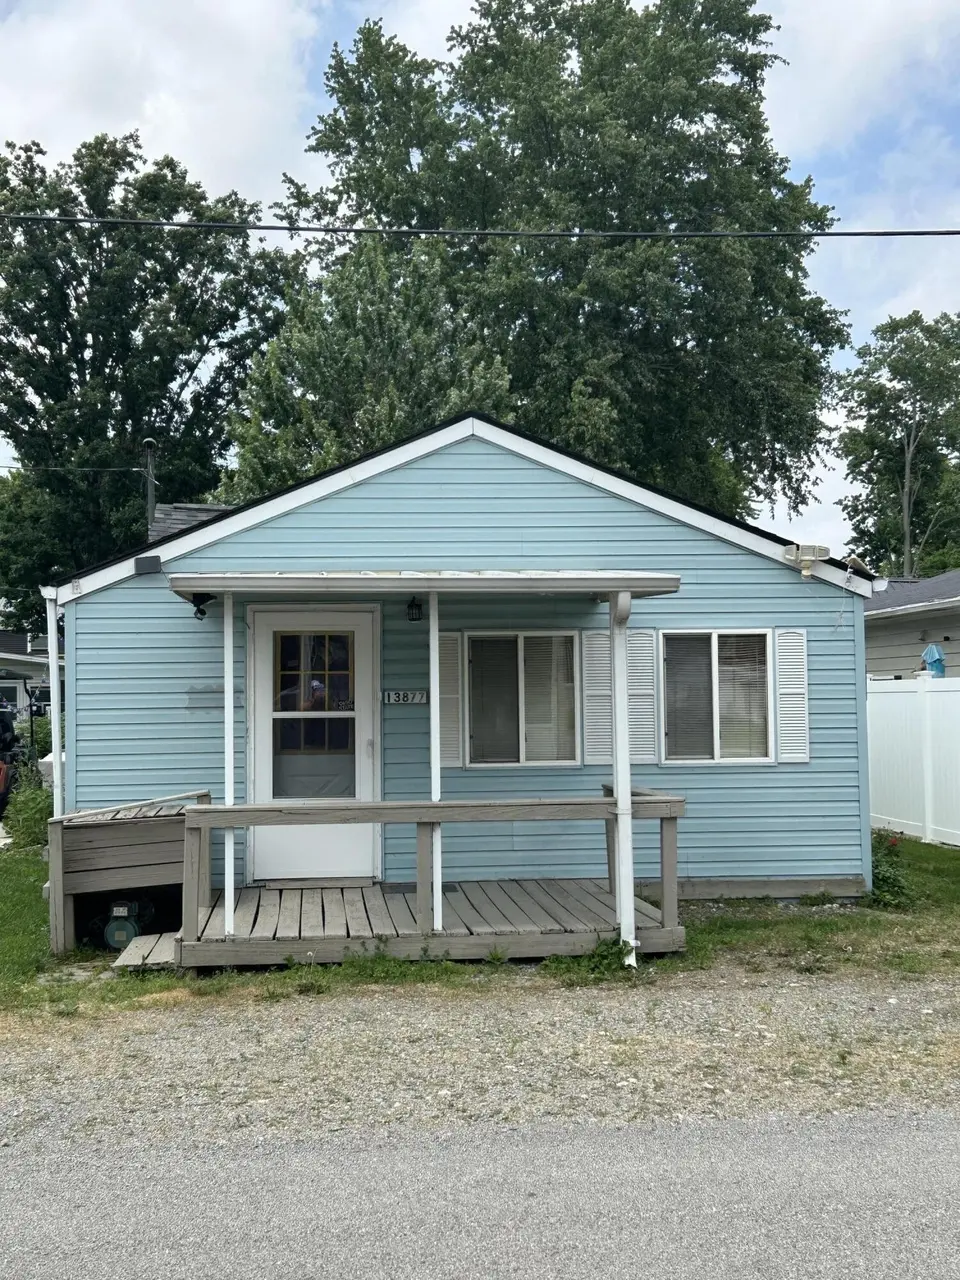
13877 Seminole Path · Chippewa Park, OH
Flood risk 1/10 · Minimal
- FEMA flood zone
- X (unshaded)
- Chance of flooding over 30 yrs
- 0.0%
- Est. flood insurance / yr
- $507 – $1,088
Fire risk 1/10 · Minimal
- Est. fire insurance / yr
- $713 – $1,323
Heat risk 3/10 · Minor
- Hot days now (above 99°F)
- 7 days/yr
- Hot days in 30 yrs
- 18 days/yr
Wind risk 2/10 · Minimal
- Chance of severe wind over 30 yrs
- —
Air-quality risk 2/10 · Minimal
- Unhealthy air days now
- 1 days/yr
- Unhealthy air days in 30 yrs
- 2 days/yr
Risk factors via First Street. Map © Google.
Why this score? — see what drove the B- grade
The composite is a weighted blend of 9 inputs, each scored 0–100. Each bar is that input's sub-score; the figure is the points it added to the 100-point composite (weight × sub-score).
- Cash flow +30.0/30.0
- DSCR +10.0/10.0
- 1% rule +8.9/10.0
- ARV discount +7.5/15.0
- Schools +5.3/10.0
- Rent growth +2.5/5.0
- Livability +2.5/5.0
- Condition / age +2.5/5.0
- Appreciation +0.0/10.0
$115,000
🖨 Deal sheet (PDF) 📄 Offer letter ✓ Due diligence
Listing remarks MLS
Endless possibilities here with this old style fishing cottage. You will have 2 beds, 1 bath on 2 parcels. The location is within a short walk of the Chippewa State Park boat ramp.
Key facts
- 1,742 sq ft lot
- Built 1948
- Listed 11 days
Tags
Property features AI
Exterior
- Utilities: Shared well water source; Public sewer; Natural gas connected; Sewer connected
- Home design: Single family residence; House; Built in 1948
- Construction: Vinyl siding; Foundation: Other (see remarks)
- Exterior features: Lake-related waterfront; Residential lot; Irregular lot shape
Interior
- Kitchen: Range; Refrigerator; Dishwasher not listed
- Flooring: Carpet
- Bathrooms: 1 full bathroom
- Heating & cooling: Central air conditioning; Forced air heating; Natural gas heating; Other heating (see remarks)
- Interior features: Ceiling fan(s)
- Laundry & utility: Washer; Dryer
Neighborhood map
What this means for you Summary
Snapshot
- This is a 2-bed/1.0-bath single-family listed at $115k.
Deal economics
- At list price, monthly cash flow is $528 ($6k/yr) — positive.
- The deal already cash-flows at list — no discount required.
- Meets the 1% rule at list price ($2k rent vs $115k).
- Cap rate 11.8% vs local median 5.5% in Chippewa Park — top-decile yield for the area; either an underpriced asset or a hidden risk that comps aren't pricing in. Stress-test before assuming the spread holds.
Location & tenants
- Location reads 49/100 on livability (#1,173 in OH) — a working-class tenant base; expect higher turnover. Strengths: cost of living A+, crime A; Watch: amenities F, commute F, employment D-.
- Indian Lake Local (rural): math 59% / reading 66% proficiency, ranked #261 of 656 in OH (top 40%) — acceptable for families but not a draw, mixed tenant base, ~2y average lease.
- Zoned schools: Indian Lake Elementary School (math 72% / reading 67%, grade A-, #391 of 1,584 statewide, top 27%, 510 students, 45% FRL); Indian Lake Middle School (math 56% / reading 65%, grade B+, #259 of 654 statewide, top 40%, 407 students, 42% FRL); Indian Lake High School (math 52% / reading 72%, grade B-, #202 of 781 statewide, top 29%, 492 students, 34% FRL) — zoned schools at 40% FRL track the district average.
- Market conditions: 109 active listings in the ZIP; 121 units permitted in Logan County in 2024 (0 in 5+ unit buildings).
- This rent runs 32% of the median local income ($60k/yr) — at the standard rent-burdened threshold; future hikes will face affordability resistance.
Forward outlook
- Local home prices are declining (-3.0%/yr); year-one equity from $795 of loan paydown is wiped out by about $3k of value loss. Plan a longer hold.
- Logan County population projected at -15% by 2050 — secular population decline; favor cash flow + early exit over multi-decade hold.
- At projected returns (-3.0% appreciation + 3.0% rent growth), your $32k cash investment doubles in ~7 years — after that, you're playing with house money.
Negotiation context
- Only 12 days on market — expect competitive offers; lowballing is unlikely to land.
- 2 sale attempts with the ask held roughly flat each time — persistent listings suggest the price (not the market) is what's stuck; bring a comps-based counter.
- Current owner paid $85k; 35% above their basis — modest negotiation headroom, anchor on the comps not their cost.
Risks & watch-outs
- Watch-outs: built in 1948 — expect roof / HVAC / electrical / plumbing capex.
Questions for the listing agent
- Built in 1948 — when were the roof, HVAC, electrical panel, plumbing, and water heater last replaced?
- Is there a deadline driving the sale (1031 exchange, divorce, estate, relocation)? That informs how much negotiation room exists.
- Schools are F-rated, which usually means shorter tenancies and higher turnover. Who's the typical renter profile here, and what's been the actual vacancy rate?
- What's the average days-on-market for RENTAL listings here right now (not sales)? A rising rental-DOM trend means longer vacancies and softer asking-rent achievability than the comps imply.
- What's the recent tenant-quality profile in this submarket — average credit score on applications, eviction rate, late-payment / NSF rate, and stable-employment percentage? A property-management company in the area should have these aggregated.
- How much new for-sale + rental construction is in the pipeline within 1–3 miles? Heavy new supply typically softens prices + rents 12–24 months out; constrained supply supports both.
Investment metrics
- 1% rule
- 1.39% ✓
- Cap rate
- 11.80%
- Cash-on-cash
- 19.68%
- DSCR
- 1.88
- GRM
- 6.0
CMA / ARV
- ARV (on-the-fly)
- $243,100
- Comps found
- 8
Show comp detail 8 sales within ~0.75 mi
| Address | Dist | Beds/Ba | Sqft | Sold | Price | $/sf | Match |
|---|---|---|---|---|---|---|---|
| 13877 Seminole Path | 0.00mi | 2/1.0 | 1,300 (0%) | 2mo | $85,000 | $65 | 98 |
| 11344 Mohawk Path | 0.30mi | 2/2.5 | 1,440 (+11%) | 2mo | $285,000 | $198 | 60 |
| 11275 Powhatan Path | 0.25mi | 3/2.0 (+1) | 1,456 (+12%) | 8mo | $240,000 | $165 | 52 |
| 11230 Mohawk Path | 0.19mi | 3/2.0 (+1) | 1,216 (-6%) | 24mo | $187,500 | $154 | 52 |
| 11518 Kickapoo Path | 0.46mi | 3/2.0 (+1) | 1,404 (+8%) | 8mo | $255,000 | $182 | 50 |
| 11571 Mohawk Path | 0.51mi | 3/2.0 (+1) | 1,176 (-10%) | 2mo | $240,000 | $204 | 50 |
| 11372 Powhatan Path | 0.33mi | 3/2.0 (+1) | 1,456 (+12%) | 10mo | $272,500 | $187 | 47 |
| 14200 Oakwood Ave | 0.52mi | 3/2.0 (+1) | 1,211 (-7%) | 15mo | $315,000 | $260 | 43 |
Match score weights: distance 35% · size 25% · config 20% · recency 20%. Top-matched comps best support the ARV.
Projected returns pro-forma
-3.0% appreciation · 3.0% rent growth · sell at horizon
- IRR
- 11.7%
- Equity multiple
- 1.47×
- Total profit
- $14,979
- Equity at exit
- $17,147
- IRR
- 20.7%
- Equity multiple
- 2.75×
- Total profit
- $56,289
- Equity at exit
- $9,943
Cash invested: $32,200 (down + closing). Projections, not guarantees.
Landlord ↔ Tenant lean methodology
- Overall (STATE)
- 73 Landlord-Friendly
- State Ohio
- 73 Landlord-Friendly · R+6
- County
- — inherits STATE
- City
- — inherits STATE
ZIP-level market 43331
- Home prices YoY
- -30.0%
- Active inventory
- 109
- Price-to-rent
- 6.0×
Monthly cashflow live
- Estimated rent
- $1,597 medium interval (Pro) →
- Mortgage (P&I)
- −$603
- Tax from tax record
- −$83 /mo · $995/yr
- Insurance
- −$48
- HOA
- −$0
- Vacancy / Maint / Mgmt
- −$335
- Net cashflow
- $528
Break-even live
Sensitivity live
| Price | -10% $593 | -5% $561 | +0% $528 | +5% $495 | +10% $463 |
|---|---|---|---|---|---|
| Rent | -10% $402 | -5% $465 | +0% $528 | +5% $591 | +10% $654 |
| Rate | -1.0pp $586 | -0.5pp $557 | base $528 | +0.5pp $498 | +1.0pp $468 |
UW: 25.0% down · 7.5% · 30yr · 1.5% tax · 5.0% vac · 8.0% maint · 8.0% mgmt
Financing live
Cash to close
- Down payment
- $28,750
- Closing costs
- $3,450
- Reserves months
- —
- Total cash needed
- —
Loan-product check · same deal, 3 products live
Conventional
25% down · 7.5% · 30yr
- Down + closing
- —
- Monthly P&I
- —
- Monthly cashflow
- —
- DSCR
- —
- Eligible?
- —
Personal DTI + credit; lowest rate.
DSCR
20% down · 8.5% · 30yr
- Down + closing
- —
- Monthly P&I
- —
- Monthly cashflow
- —
- DSCR
- —
- Eligible?
- —
No personal income docs; deal must DSCR.
Hard money
10% down · 12.0% · 12mo
- Down + closing
- —
- Monthly P&I
- —
- Monthly cashflow
- —
- DSCR
- —
- Eligible?
- —
Short-term bridge; refi at stabilization.
Listing history 9 events
-
2026-06-21days on market $115,000 Active 12 DOM
-
2026-06-21days on market $115,000 Active 11 DOM
-
2026-06-18days on market $115,000 Active 9 DOM
-
2026-06-17days on market $115,000 Active 8 DOM
-
2026-06-16days on market $115,000 Active 7 DOM
-
2026-06-15days on market $115,000 Active 6 DOM
-
2026-06-13days on market $115,000 Active 4 DOM
-
2026-06-12remarks 699-char remark
-
2026-06-12$115,000 Active 3 DOM
ⓘ Source: listings_history table (triggers on properties + properties_extension) + one-shot
backfill from property_details.listing_events for pre-trigger history.
Tax reassessment forecast OH · Partial reset (capped growth)
- Current annual tax
- $995 · $83/mo
- Projected year-2 tax
- $1,394 · $116/mo
- Expected delta
- +$400/yr (+$33/mo · 40.2%)
ⓘ Screening estimate from a state-policy table — verify with the county assessor before closing.
Climate risk First Street
- Flood 1/10 Low FEMA zone X (unshaded) · 0% chance over 30 yrs
- Wildfire 1/10 Low
- Heat 3/10 Moderate 7 d/yr ≥99°F today · 18 d/yr by 30 yrs out
- Wind 2/10 Low
- Air quality 2/10 Low 1 unhealthy d/yr today · 2 by 30 yrs out
Nearby sold comps map
Loading sold comps map…
Walkable amenities ~0.75 mi
Loading nearby amenities…
Taxation est. · year 1
- Rental income
- $19,167
- − Mortgage interest
- −$6,442
- − Property taxes
- −$995
- − Insurance
- −$575
- − Repairs & maintenance
- −$1,533
- − Management
- −$1,533
- − Depreciation
- −$3,345
- Taxable income
- $4,744
- Est. tax owed @ 24.0%
- −$1,138
- After-tax cash flow
- $5,197/yr
For passive investors: Depreciation is non-cash, so a rental often shows a tax loss while cash-flowing — sheltering income. Rental losses are passive: they offset passive income freely, and up to $25,000/yr can offset ordinary (W-2) income if you actively participate and your MAGI is under $100k (phasing out to $0 by $150k); unused losses carry forward. On sale, claimed depreciation is recaptured at up to 25%, and gains may owe capital-gains tax (a 1031 exchange can defer both). Figures are a year-1 estimate at your 24.0% rate — not tax advice; consult a CPA.
Schools (NCES district)
- District
- Indian Lake Local
- NCES district ID
- 3904808
- Math proficiency
- 59% ▼ -14.00%
- Reading proficiency
- 66% ▼ -4.00%
- Median HH income
- $44,496
- Composite
- 52.6/100
- National rank
- #1559
- State rank
- #261 of 656 in OH
Livability — Chippewa Park
- Score
- 49/100
- State rank
- #1173
- US rank
- #25758
Category grades
Schools grade is shown separately in the Schools card above.
Census & demographics
- Census place
- Chippewa Park, OH
- County
- Logan · 47,256 people
- Population (ZIP)
- 4,012
- Household income
- $60,159
- Rent vs Own
- Severe rent burden
- 16.1
Population outlook (Logan County) Hauer SSP2
- Today (2025)
- 44,240 people
- By 2030
- 43,166 · -2.4%
- By 2040
- 40,495 · -8.5%
- By 2050
- 37,511 · -15.2%
- By 2075
- 30,453 · -31.2%
- By 2100
- 23,081 · -47.8%
Race, ethnicity, and origin ACS 2023
- Neighborhood character
- Predominantly White (94%)
- Race & ethnicity
- White 94% Hispanic / Latino 4% Two or more races 2% Black 1%
- Common ancestry
- Lithuanian 2% Slovak 2% Iranian 1%
- Foreign-born
- 2% · Canada
- Languages at home
- 96% English-only · Spanish 4%
Political lean MEDSL · Logan
- 2024 margin
- Solid R (+56.2) · D 21.5% · R 77.7%
- 2008→2024 swing
- -29.6pp toward R · 2008: -26.6pp · 2024: -56.2pp
- All cycles
- 2024: R+56.2 2020: R+55.2 2016: R+52.6 2012: R+31.8 2008: R+26.6
Not yet ingested
- Civics
- —
Market trends
- HPI YoY
- ▼ -109.75%
- Current HPI
- 256.2406
- Rent YoY
- —
- Metro
- —
- State GDP YoY
- ▲ 1.98%
- F500 in state
- 48
Industry mix (Fortune 500 HQ in OH)
| Industry | F500 HQs | Revenue |
|---|---|---|
| Insurance | 3 | $145B |
|
||
| Industrial Machinery | 3 | $49B |
|
||
| Financial Services | 3 | $24B |
|
||
| Consumer Goods | 2 | $93B |
|
||
| Aerospace / Defense | 2 | $47B |
|
||
| Utilities | 2 | $33B |
|
||
Price history
+505.3% since first listed6 events — show timeline
- 2026-06-09 Listed $115,000 WRIST
- 2026-04-29 Sold (Public Records) $85,000 Public Records
- 2026-04-27 Sold (MLS) $85,000 WRIST
- 2026-04-15 Pending — WRIST
- 2026-04-14 Listed $80,000 WRIST
- 1987-06-30 Sold (Public Records) $19,000 Public Records
Property tax history
+13.2%/yrLatest (2025): $995 · +67.7% YoY. Source: county tax records.
Cash-flow waterfall
monthlySold comps — $/sqft
last 12 mo · ≤1 miLoading sold comps…