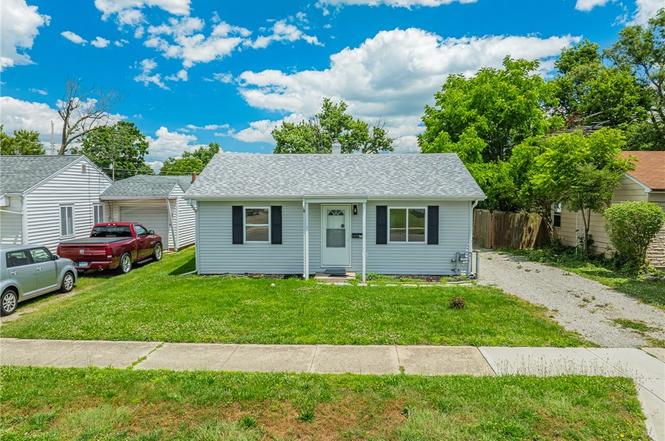
1143 W Race St · Troy, OH
Flood risk 1/10 · Minimal
- FEMA flood zone
- X (unshaded)
- Chance of flooding over 30 yrs
- 0.0%
- Est. flood insurance / yr
- $507 – $1,088
Fire risk 1/10 · Minimal
- Est. fire insurance / yr
- $713 – $1,323
Heat risk 3/10 · Minor
- Hot days now (above 102°F)
- 7 days/yr
- Hot days in 30 yrs
- 18 days/yr
Wind risk 2/10 · Minimal
- Chance of severe wind over 30 yrs
- —
Air-quality risk 3/10 · Minor
- Unhealthy air days now
- 3 days/yr
- Unhealthy air days in 30 yrs
- 4 days/yr
Risk factors via First Street. Map © Google.
Why this score? — see what drove the D+ grade
The composite is a weighted blend of 9 inputs, each scored 0–100. Each bar is that input's sub-score; the figure is the points it added to the 100-point composite (weight × sub-score).
- Cash flow +18.2/30.0
- ARV discount +6.9/15.0
- DSCR +5.7/10.0
- Schools +5.2/10.0
- Rent growth +3.8/5.0
- 1% rule +3.7/10.0
- Livability +3.7/5.0
- Condition / age +2.5/5.0
- Appreciation +0.0/10.0
$150,900
🖨 Deal sheet (PDF) 📄 Offer letter ✓ Due diligence
Listing remarks MLS
Great 2 bedroom, 1 bathroom starter home or investment property. Ready for your finishing touches to make it your own. Amazing, spacious 25'x30' garage with 220 amp electric power, LED lights, and a 2 ton I-beam. Garage is perfect for mechanics, a workshop or crafts.
Key facts
- Renovated bathroom
- Wood plank flooring
- Detached garage
Tags
Property features AI
Finance
- Financial info: Offered for sale
Exterior
- Parking: Detached one-car garage with garage door opener
- Utilities: Standard utilities (natural gas for heat, central AC)
- Home design: Single-story home
- Construction: Vinyl siding; Slab foundation
- Exterior features: Residential lot approximately 0.15 acres (about 130' x 50')
Interior
- Kitchen: Main-level kitchen (approx. 14 x 11)
- Bedrooms: Two main-level bedrooms (approx. 11 x 9 and 12 x 9)
- Bathrooms: One full bathroom on the main level
- Heating & cooling: Natural gas heating; Central air conditioning
- Interior features: 4 total rooms
Neighborhood map
What this means for you Summary
Snapshot
- This is a 2-bed/1.0-bath single-family listed at $151k.
Deal economics
- At list price, monthly cash flow is $136 ($2k/yr) — positive.
- The deal already cash-flows at list — no discount required.
- To meet the 1% rule (rent ≥ 1% of price), the offer needs to be $132k (12.7% below list).
- Recommended offer: $132k (12.7% below list) — sets the bar for 1% rule.
- Cap rate 7.4% vs local median 2.7% in Troy — top-decile yield for the area; either an underpriced asset or a hidden risk that comps aren't pricing in. Stress-test before assuming the spread holds.
Location & tenants
- Location reads 73/100 on livability (#345 in OH) — a middle-class / working-renter tenant base. Strengths: cost of living A+, housing A+, crime A; Watch: amenities F, commute F, health & safety F.
- Troy City (suburban): math 61% / reading 61% proficiency, ranked #271 of 656 in OH (top 41%) — acceptable for families but not a draw, mixed tenant base, ~2y average lease.
- Zoned schools: Forest Elementary School (math 62% / reading 62%, grade B, #590 of 1,584 statewide, top 41%, 211 students, 64% FRL); Troy Junior High School (math 59% / reading 57%, grade B, #297 of 654 statewide, top 46%, 663 students, 35% FRL); Troy High School (math 58% / reading 67%, grade B-, #200 of 781 statewide, top 26%, 1,183 students, 36% FRL).
- Market conditions: Rents rising fast (+5.1%/yr); 287 active listings in the ZIP; 2 comparable units currently listed for rent nearby; solid renter incomes; 326 units permitted in Miami County in 2024 (0 in 5+ unit buildings).
Forward outlook
- Local home prices are declining (-3.0%/yr); year-one equity from $1k of loan paydown is wiped out by about $5k of value loss. Plan a longer hold.
Negotiation context
- Only 4 days on market — expect competitive offers; lowballing is unlikely to land.
- 8 sale attempts since 13y ago with the ask held roughly flat each time — persistent listings suggest the price (not the market) is what's stuck; bring a comps-based counter.
- Current owner paid $75k; list at $151k implies a 101% gain — meaningful room to come down on a strong offer.
Risks & watch-outs
- Watch-outs: built in 1951 — expect roof / HVAC / electrical / plumbing capex.
Questions for the listing agent
- Built in 1951 — when were the roof, HVAC, electrical panel, plumbing, and water heater last replaced?
- Is there a deadline driving the sale (1031 exchange, divorce, estate, relocation)? That informs how much negotiation room exists.
- Schools are A-rated — typically a magnet for longer-tenancy family renters. What's the average tenant stay here, and is there a school-zone premium baked into asking?
- The area grade is low — what's the realistic commute time and amenity access for the typical tenant pool here? Any planned neighborhood developments (good or bad) we should know about?
- What's the average days-on-market for RENTAL listings here right now (not sales)? A rising rental-DOM trend means longer vacancies and softer asking-rent achievability than the comps imply.
- What's the recent tenant-quality profile in this submarket — average credit score on applications, eviction rate, late-payment / NSF rate, and stable-employment percentage? A property-management company in the area should have these aggregated.
- How much new for-sale + rental construction is in the pipeline within 1–3 miles? Heavy new supply typically softens prices + rents 12–24 months out; constrained supply supports both.
Investment metrics
- 1% rule
- 0.87% ✗
- Cap rate
- 7.38%
- Cash-on-cash
- 3.87%
- DSCR
- 1.17
- GRM
- 9.5
CMA / ARV
- ARV (on-the-fly)
- $149,040
- Comps found
- 8
Show comp detail 8 sales within ~0.75 mi
| Address | Dist | Beds/Ba | Sqft | Sold | Price | $/sf | Match |
|---|---|---|---|---|---|---|---|
| 1119 Long St | 0.07mi | 2/1.0 | 696 (-3%) | 3mo | $170,000 | $244 | 88 |
| 1143 W Race St | 0.00mi | 2/1.0 | 720 (0%) | 23mo | $75,000 | $104 | 81 |
| 216 Morehead St | 0.11mi | 2/1.0 | 734 (+2%) | 13mo | $125,000 | $170 | 81 |
| 1178 Race Dr | 0.05mi | 2/1.0 | 720 (0%) | 21mo | $135,000 | $188 | 80 |
| 130 Floral Ave | 0.14mi | 2/1.0 | 752 (+4%) | 18mo | $156,000 | $207 | 71 |
| 804 S Walnut St | 0.67mi | 2/1.0 | 704 (-2%) | 8mo | $150,000 | $213 | 59 |
| 1122 Long St | 0.04mi | 2/2.0 | 810 (+12%) | 23mo | $185,000 | $228 | 54 |
| 20 S Crawford St | 0.59mi | 2/1.0 | 780 (+8%) | 18mo | $98,000 | $126 | 44 |
Match score weights: distance 35% · size 25% · config 20% · recency 20%. Top-matched comps best support the ARV.
Projected returns pro-forma
-3.0% appreciation · 5.06% rent growth · sell at horizon
- IRR
- -8.2%
- Equity multiple
- 0.69×
- Total profit
- $-13,047
- Equity at exit
- $22,500
- IRR
- 3.5%
- Equity multiple
- 1.27×
- Total profit
- $11,479
- Equity at exit
- $13,047
Cash invested: $42,252 (down + closing). Projections, not guarantees.
Landlord ↔ Tenant lean methodology
- Overall (STATE)
- 73 Landlord-Friendly
- State Ohio
- 73 Landlord-Friendly · R+6
- County
- — inherits STATE
- City
- — inherits STATE
ZIP-level market 45373
- Rents YoY
- 5.1%
- Active inventory
- 287
- Price-to-rent
- 9.5×
Monthly cashflow live
- Estimated rent
- $1,317 medium interval (Pro) →
- Mortgage (P&I)
- −$791
- Tax from tax record
- −$50 /mo · $598/yr
- Insurance
- −$63
- HOA
- −$0
- Vacancy / Maint / Mgmt
- −$277
- Net cashflow
- $136
Break-even live
Sensitivity live
| Price | -10% $222 | -5% $179 | +0% $136 | +5% $94 | +10% $51 |
|---|---|---|---|---|---|
| Rent | -10% $32 | -5% $84 | +0% $136 | +5% $188 | +10% $240 |
| Rate | -1.0pp $212 | -0.5pp $175 | base $136 | +0.5pp $97 | +1.0pp $57 |
UW: 25.0% down · 7.5% · 30yr · 1.5% tax · 5.0% vac · 8.0% maint · 8.0% mgmt
Financing live
Cash to close
- Down payment
- $37,725
- Closing costs
- $4,527
- Reserves months
- —
- Total cash needed
- —
Loan-product check · same deal, 3 products live
Conventional
25% down · 7.5% · 30yr
- Down + closing
- —
- Monthly P&I
- —
- Monthly cashflow
- —
- DSCR
- —
- Eligible?
- —
Personal DTI + credit; lowest rate.
DSCR
20% down · 8.5% · 30yr
- Down + closing
- —
- Monthly P&I
- —
- Monthly cashflow
- —
- DSCR
- —
- Eligible?
- —
No personal income docs; deal must DSCR.
Hard money
10% down · 12.0% · 12mo
- Down + closing
- —
- Monthly P&I
- —
- Monthly cashflow
- —
- DSCR
- —
- Eligible?
- —
Short-term bridge; refi at stabilization.
Rent comps 2 comps
| Address | Beds | Baths | Sqft | Rent | $/sqft | DOM | Units | Dist |
|---|---|---|---|---|---|---|---|---|
| 609 Michigan Ave Troy, OH | 2.0 | 1.0 | 696 | $1,250 | $1.80 | 4d | 1 | 1.11mi |
| 455 Stonyridge Ave Troy, OH | 2.0 | 1.0 | 576 | $1,175 | $2.04 | 4d | 5 | 1.28mi |
Listing history 3 events
-
2026-06-22days on market $150,900 Active 4 DOM
-
2026-06-18remarks 699-char remark
-
2026-06-18$150,900 Active 1 DOM
ⓘ Source: listings_history table (triggers on properties + properties_extension) + one-shot
backfill from property_details.listing_events for pre-trigger history.
Tax reassessment forecast OH · Partial reset (capped growth)
- Current annual tax
- $598 · $50/mo
- Projected year-2 tax
- $1,476 · $123/mo
- Expected delta
- +$878/yr (+$73/mo · 146.8%)
ⓘ Screening estimate from a state-policy table — verify with the county assessor before closing.
Climate risk First Street
- Flood 1/10 Low FEMA zone X (unshaded) · 0% chance over 30 yrs
- Wildfire 1/10 Low
- Heat 3/10 Moderate 7 d/yr ≥102°F today · 18 d/yr by 30 yrs out
- Wind 2/10 Low
- Air quality 3/10 Moderate 3 unhealthy d/yr today · 4 by 30 yrs out
Nearby sold comps map
Loading sold comps map…
Walkable amenities ~0.75 mi
Loading nearby amenities…
Taxation est. · year 1
- Rental income
- $15,804
- − Mortgage interest
- −$8,453
- − Property taxes
- −$598
- − Insurance
- −$754
- − Repairs & maintenance
- −$1,264
- − Management
- −$1,264
- − Depreciation
- −$4,390
- Taxable loss
- −$920
- Est. tax savings @ 24.0%
- +$221
- After-tax cash flow
- $1,857/yr
For passive investors: Depreciation is non-cash, so a rental often shows a tax loss while cash-flowing — sheltering income. Rental losses are passive: they offset passive income freely, and up to $25,000/yr can offset ordinary (W-2) income if you actively participate and your MAGI is under $100k (phasing out to $0 by $150k); unused losses carry forward. On sale, claimed depreciation is recaptured at up to 25%, and gains may owe capital-gains tax (a 1031 exchange can defer both). Figures are a year-1 estimate at your 24.0% rate — not tax advice; consult a CPA.
Schools (NCES district)
- District
- Troy City
- NCES district ID
- 3904492
- Math proficiency
- 61% ▼ -10.00%
- Reading proficiency
- 61% ▼ -7.00%
- Median HH income
- $52,012
- Composite
- 52.1/100
- National rank
- #1625
- State rank
- #271 of 656 in OH
Livability — Troy
- Score
- 73/100
- State rank
- #345
- US rank
- #5621
Category grades
Schools grade is shown separately in the Schools card above.
Census & demographics
- Census place
- Troy, OH
- County
- Miami County · 85,667 people
- City population
- 37,565
- Metro
- Dayton-Kettering, OH
- Population (ZIP)
- 37,565
- Household income
- $75,742
- Rent vs Own
- Severe rent burden
- 1134.0
Population outlook (Miami County) Hauer SSP2
- Today (2025)
- 107,816 people
- By 2030
- 108,896 · +1.0%
- By 2040
- 109,581 · +1.6%
- By 2050
- 108,110 · +0.3%
- By 2075
- 101,523 · -5.8%
- By 2100
- 85,787 · -20.4%
Race, ethnicity, and origin ACS 2023
- Neighborhood character
- Predominantly White (87%)
- Race & ethnicity
- White 87% Two or more races 6% Hispanic / Latino 4% Asian 3% Black 3%
- Common ancestry
- Lithuanian 4% Slovak 2% Iranian 2%
- Foreign-born
- 4% · Canada
- Languages at home
- 96% English-only · Other Asian/Pacific 2% Spanish 1% Other Indo-European 1%
Political lean MEDSL · Miami
- 2024 margin
- Solid R (+45.1) · D 27.0% · R 72.1%
- 2008→2024 swing
- -16.6pp toward R · 2008: -28.5pp · 2024: -45.1pp
- All cycles
- 2024: R+45.1 2020: R+44.3 2016: R+45.6 2012: R+35.6 2008: R+28.5
Not yet ingested
- Civics
- —
Market trends
- HPI YoY
- ▼ -158.93%
- Current HPI
- 211.5279
- Rent YoY
- ▲ 5.06%
- Metro
- Dayton-Kettering, OH
- State GDP YoY
- ▲ 1.98%
- F500 in state
- 48
Industry mix (Fortune 500 HQ in OH)
| Industry | F500 HQs | Revenue |
|---|---|---|
| Insurance | 3 | $145B |
|
||
| Industrial Machinery | 3 | $49B |
|
||
| Financial Services | 3 | $24B |
|
||
| Consumer Goods | 2 | $93B |
|
||
| Aerospace / Defense | 2 | $47B |
|
||
| Utilities | 2 | $33B |
|
||
Price history
+491.8% since first listed25 events — show timeline
- 2026-06-17 Listed $150,900 Dayton MLS
- 2024-07-18 Sold (MLS) $75,000 Dayton MLS
- 2024-07-18 Sold (MLS) $75,000 Dayton MLS
- 2024-07-07 Pending — Dayton MLS
- 2024-07-01 Relisted — Dayton MLS
- 2024-06-26 Pending — Dayton MLS
- 2024-06-24 Listed $125,000 Dayton MLS
- 2019-05-06 Sold (Public Records) $63,000 Public Records
- 2019-05-03 Sold (MLS) $63,000 Dayton MLS
- 2019-05-03 Sold (MLS) $63,000 Dayton MLS
- 2019-04-02 Pending — Dayton MLS
- 2019-03-14 Relisted — Dayton MLS
- 2019-02-22 Contingent — Dayton MLS
- 2019-02-13 Listed $65,000 Dayton MLS
- 2015-04-13 Sold (Public Records) $46,000 Public Records
- 2015-04-10 Sold (MLS) $46,000 WRIST
- 2015-04-10 Sold (MLS) $46,000 Dayton MLS
- 2015-04-10 Sold (MLS) $46,000 Dayton MLS
- 2015-03-16 Listing Removed — Dayton MLS
- 2014-09-03 Listed $49,500 WRIST
- 2014-09-03 Listed $49,500 Dayton MLS
- 2014-08-12 Listing Removed — Dayton MLS
- 2013-08-14 Listed $50,000 Dayton MLS
- 1997-07-15 Sold (Public Records) $53,000 Public Records
- 1990-10-31 Sold (Public Records) $25,500 Public Records
Property tax history
-0.8%/yrLatest (2025): $598 · +11.6% YoY. Source: county tax records.
Cash-flow waterfall
monthlySold comps — $/sqft
last 12 mo · ≤1 miLoading sold comps…