 Duplex
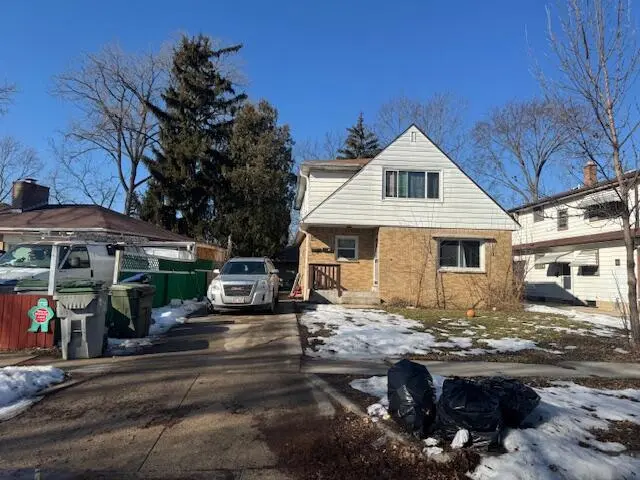
4861 N 50 St #4863 · Milwaukee, WI
Flood risk 1/10 · Minimal
- FEMA flood zone
- X (unshaded)
- Chance of flooding over 30 yrs
- 0.0%
- Est. flood insurance / yr
- $473 – $860
Fire risk 1/10 · Minimal
- Est. fire insurance / yr
- $636 – $1,182
Heat risk 2/10 · Minimal
- Hot days now (above 100°F)
- 7 days/yr
- Hot days in 30 yrs
- 13 days/yr
Wind risk 2/10 · Minimal
- Chance of severe wind over 30 yrs
- —
Air-quality risk 2/10 · Minimal
- Unhealthy air days now
- 2 days/yr
- Unhealthy air days in 30 yrs
- 2 days/yr
Risk factors via First Street. Map © Google.
Why this score? — see what drove the C+ grade
The composite is a weighted blend of 9 inputs, each scored 0–100. Each bar is that input's sub-score; the figure is the points it added to the 100-point composite (weight × sub-score).
- Cash flow +29.2/30.0
- DSCR +10.0/10.0
- 1% rule +8.1/10.0
- Livability +4.0/5.0
- Rent growth +3.8/5.0
- ARV discount +3.6/15.0
- Condition / age +2.2/5.0
- Schools +1.2/10.0
- Appreciation +0.0/10.0
$199,900
🖨 Deal sheet 📄 Offer letter ✓ Due diligence
Multi-family units
County records classify this as Multi-Family (2-4 Unit). Listing-text estimate: 2 units. confirmed
Listing remarks MLS
3/2 Brick and Aluminum duplex with side drive and garage in a popular rental location; features newer roof, and the craftsmanship of the 1950's construction.
Key facts
- Newer roof
- 5,662 sq ft lot
- 2 garage spots
Tags
Neighborhood map
What this means for you Summary
Snapshot
- This is a 2 × 2-bed/1.0-bath units multifamily listed at $200k. Condition is rated fair.
Deal economics
- At list price, monthly cash flow is $694 ($8k/yr) — positive. Per door: $347/mo.
- The deal already cash-flows at list — no discount required.
- Meets the 1% rule at list price ($3k rent vs $200k).
- Recommended offer: $182k (9.0% below list) — sets the bar for market timing.
- Cap rate 10.5% vs local median 5.1% in Milwaukee — top-decile yield for the area; either an underpriced asset or a hidden risk that comps aren't pricing in. Stress-test before assuming the spread holds.
Location & tenants
- Location reads 81/100 on livability (#55 in WI, #1,534 nationally) — a professional / high-income tenant draw. Strengths: amenities A+, commute A+, cost of living A+; Watch: employment D+, schools F, crime F.
- Milwaukee School District (urban): math 10% / reading 18% proficiency, ranked #337 of 342 in WI (top 98%) — low school quality limits family demand, transient renter base, plan for 1-2y turnover; 77% free/reduced lunch — lower-income household profile, screen leases tightly.
- Market conditions: Rents rising fast (+5.3%/yr); 153 active listings in the ZIP; 5 comparable units currently listed for rent nearby; rentals leasing fast (median 11d on market — plan ~1-2 weeks tenant-placement turnaround); 1,017 units permitted in Milwaukee County in 2024 (803 in 5+ unit buildings).
- At $2,627/mo this rent would consume 69% of the median local household income ($46k/yr) (locally 2421% of renters already pay >50% of income on rent) — very limited rent-growth headroom before tenants either downsize or default.
Forward outlook
- Local home prices are declining (-3.0%/yr); year-one equity from $1k of loan paydown is wiped out by about $6k of value loss. Plan a longer hold.
- Milwaukee County population projected at +4% by 2050 — modest demand growth; plan on rents tracking national, not racing it.
- At projected returns (-3.0% appreciation + 5.3% rent growth), your $56k cash investment doubles in ~7 years — after that, you're playing with house money.
Negotiation context
- It's been on market 120 days — a 9% lower offer ($182k) is reasonable based on typical stale-listing flexibility.
- 2 sale attempts; this cycle's ask is 18089% above the opening price — seller raised mid-cycle; expect resistance to lowballs.
Risks & watch-outs
- Watch-outs: built in 1959 — expect roof / HVAC / electrical / plumbing capex.
Questions for the listing agent
- It's been on market 120 days. Have you received any prior offers? Is the seller open to a 9% concession, seller financing, or rate buy-down credit?
- Can we see the unit-by-unit rent roll, current vacancy, and any below-market leases? What's the average tenancy length?
- What capital expenditures (roof, boiler, parking lot, exteriors) have been made in the last 5 years, and what's planned in the next 2?
- Have any recent inspections been done? Can we get a copy of the seller's disclosures and any deferred-maintenance estimates?
- Built in 1959 — when were the roof, HVAC, electrical panel, plumbing, and water heater last replaced?
- Why hasn't it sold? Are there any deal-killer items the seller is aware of (foundation, flood, title, zoning, code violations)?
- Is there a deadline driving the sale (1031 exchange, divorce, estate, relocation)? That informs how much negotiation room exists.
- Schools are F-rated, which usually means shorter tenancies and higher turnover. Who's the typical renter profile here, and what's been the actual vacancy rate?
- Crime grade is F in this area — have there been break-ins, vandalism, or insurance claims at this property in the last 3 years? What carrier currently insures it and at what premium?
- What's the average days-on-market for RENTAL listings here right now (not sales)? A rising rental-DOM trend means longer vacancies and softer asking-rent achievability than the comps imply.
- What's the recent tenant-quality profile in this submarket — average credit score on applications, eviction rate, late-payment / NSF rate, and stable-employment percentage? A property-management company in the area should have these aggregated.
- How much new apartment / multifamily construction is in the pipeline within 1–3 miles? Heavy new supply (>2% of stock underway) typically softens rents 12–24 months out; light construction supports rent growth.
Investment metrics
- 1% rule
- 1.31% ✓
- Cap rate
- 10.46%
- Cash-on-cash
- 14.88%
- DSCR
- 1.66
- GRM
- 6.3
CMA / ARV
- ARV (median comp)
- $183,944
- List price
- $199,900
- Delta
- 8.67%
- Verdict
- FAIR
- Comps
- 20 within 1.0 mi
Show comp detail 12 sales within ~0.75 mi
| Address | Dist | Beds/Ba | Sqft | Sold | Price | $/sf | Match |
|---|---|---|---|---|---|---|---|
| 4568 N 51st Blvd #4570 | 0.39mi | 4/2.0 | 1,886 (-6%) | 8mo | $147,000 | $78 | 64 |
| 4960 N 48th St #4962 | 0.20mi | 5/2.0 (+1) | 2,201 (+9%) | 9mo | $195,000 | $89 | 63 |
| 5324 N 48th St | 0.60mi | 5/2.0 (+1) | 1,986 (-1%) | 2mo | $240,000 | $121 | 63 |
| 5011 N 47th St Unit 5011A | 0.26mi | 5/2.0 (+1) | 2,212 (+10%) | 5mo | $132,500 | $60 | 62 |
| 5101 W Lincoln Creek Dr #5103 | 0.49mi | 4/2.0 | 1,903 (-6%) | 9mo | $166,900 | $88 | 60 |
| 5269 N Sherman Blvd | 0.68mi | 4/2.0 | 2,102 (+4%) | 4mo | $192,000 | $91 | 58 |
| 6130 W Fairmount Ave | 0.68mi | 4/2.0 | 2,022 (+0%) | 11mo | $280,000 | $138 | 58 |
| 4908 N 60th St Unit 4908A | 0.54mi | 5/2.0 (+1) | 2,112 (+5%) | 10mo | $60,000 | $28 | 53 |
| 4668 N 42nd St #4670 | 0.60mi | 4/2.0 | 2,094 (+4%) | 15mo | $153,000 | $73 | 53 |
| 5066 N Hopkins St #5068 | 0.72mi | 4/2.0 | 1,904 (-6%) | 11mo | $165,000 | $87 | 48 |
| 4432 N 55th St Unit 4432A | 0.64mi | 3/2.0 (-1) | 1,833 (-9%) | 6mo | $191,000 | $104 | 45 |
| 4547 N 60th St | 0.71mi | 4/2.0 | 2,232 (+11%) | 12mo | $228,000 | $102 | 39 |
Match score weights: distance 35% · size 25% · config 20% · recency 20%. Top-matched comps best support the ARV.
Projected returns pro-forma
-3.0% appreciation · 5.29% rent growth · sell at horizon
- IRR
- 8.0%
- Equity multiple
- 1.32×
- Total profit
- $18,031
- Equity at exit
- $29,806
- IRR
- 19.2%
- Equity multiple
- 2.78×
- Total profit
- $99,392
- Equity at exit
- $17,284
Cash invested: $55,972 (down + closing). Projections, not guarantees.
Landlord ↔ Tenant lean methodology
- Overall (STATE)
- 73 Landlord-Friendly
- State Wisconsin
- 73 Landlord-Friendly · R+2
- County
- — inherits STATE
- City
- — inherits STATE
ZIP-level market 53218
- Home prices YoY
- -19.0%
- Rents YoY
- 5.3%
- Active inventory
- 153
- Price-to-rent
- 12.7×
Monthly cashflow live
- Estimated rent
- $2,627 high interval (Pro) →
- Mortgage (P&I)
- −$1,048
- Tax est. 1.5%
- −$250 /mo · $2,998/yr
- Insurance
- −$83
- HOA
- −$0
- Vacancy / Maint / Mgmt
- −$552
- Net cashflow
- $694
Break-even live
2-unit breakdown (identical units grouped — click to expand)
| Units | Beds | Baths | Est. rent |
|---|---|---|---|
| 2× units | 2 | 1 | $2,626 |
| #1 | 2 | 1 | $1,313 |
| #2 | 2 | 1 | $1,313 |
| Total (2 units) | $2,627 | ||
UW: 25.0% down · 7.5% · 30yr · 1.5% tax · 5.0% vac · 8.0% maint · 8.0% mgmt
Financing live
Cash to close
- Down payment
- $49,975
- Closing costs
- $5,997
- Reserves months
- —
- Total cash needed
- —
Loan-product check · same deal, 3 products live
Conventional
25% down · 7.5% · 30yr
- Down + closing
- —
- Monthly P&I
- —
- Monthly cashflow
- —
- DSCR
- —
- Eligible?
- —
Personal DTI + credit; lowest rate.
DSCR
20% down · 8.5% · 30yr
- Down + closing
- —
- Monthly P&I
- —
- Monthly cashflow
- —
- DSCR
- —
- Eligible?
- —
No personal income docs; deal must DSCR.
Hard money
10% down · 12.0% · 12mo
- Down + closing
- —
- Monthly P&I
- —
- Monthly cashflow
- —
- DSCR
- —
- Eligible?
- —
Short-term bridge; refi at stabilization.
Rent comps 5 comps
| Address | Beds | Baths | Sqft | Rent | $/sqft | DOM | Units | Dist |
|---|---|---|---|---|---|---|---|---|
| 4900 N 58th St Milwaukee, WI | 3.0 | 1.0 | 1455 | $1,450 | $1.00 | 4d | 1 | 0.50mi |
| 5268 N 64th St Milwaukee, WI | 5.0 | 1.0 | 1672 | $1,850 | $1.11 | 10d | 1 | 0.96mi |
| 6813 W Hampton Ave Unit Rear (Unit B) Milwaukee, WI | 3.0 | 2.0 | 1600 | $1,350 | $0.84 | 23d | 1 | 1.13mi |
| 4079 N 63rd St Milwaukee, WI | 3.0 | 1.0 | 1600 | $1,595 | $1.00 | 20d | 1 | 1.28mi |
| 6921 W Herbert Ave Milwaukee, WI | 3.0 | 2.0 | 1414 | $1,620 | $1.15 | 4d | 1 | 1.35mi |
Listing history 18 events
-
2026-06-18days on market $199,900 Active 120 DOM
-
2026-06-17days on market $199,900 Active 119 DOM
-
2026-06-16days on market $199,900 Active 118 DOM
-
2026-06-15days on market $199,900 Active 117 DOM
-
2026-06-13days on market $199,900 Active 115 DOM
-
2026-06-13days on market $199,900 Active 114 DOM
-
2026-06-09days on market $199,900 Active 111 DOM
-
2026-06-08days on market $199,900 Active 110 DOM
-
2026-06-07days on market $199,900 Active 109 DOM
-
2026-06-05days on market $199,900 Active 106 DOM
-
2026-06-03days on market $199,900 Active 105 DOM
-
2026-06-02days on market $199,900 Active 104 DOM
-
2026-06-01days on market $199,900 Active 103 DOM
-
2026-05-31days on market $199,900 Active 102 DOM
-
2026-05-13historical $1,099
-
2026-04-29$1,099
-
2026-03-23price $199,900 157-char remark
Show marketing remark (157 chars)
3/2 Brick and Aluminum duplex with side drive and garage in a popular rental location; features newer roof, and the craftsmanship of the 1950's construction.
-
2026-02-18$209,900 Active 157-char remark
Show marketing remark (157 chars)
3/2 Brick and Aluminum duplex with side drive and garage in a popular rental location; features newer roof, and the craftsmanship of the 1950's construction.
ⓘ Source: listings_history table (triggers on properties + properties_extension) + one-shot
backfill from property_details.listing_events for pre-trigger history.
Climate risk First Street
- Flood 1/10 Low FEMA zone X (unshaded) · 0% chance over 30 yrs
- Wildfire 1/10 Low
- Heat 2/10 Low 7 d/yr ≥100°F today · 13 d/yr by 30 yrs out
- Wind 2/10 Low
- Air quality 2/10 Low 2 unhealthy d/yr today · 2 by 30 yrs out
Nearby sold comps map
Loading sold comps map…
Walkable amenities ~0.75 mi
Loading nearby amenities…
Taxation est. · year 1
- Rental income
- $31,524
- − Mortgage interest
- −$11,198
- − Property taxes
- −$2,998
- − Insurance
- −$1,000
- − Repairs & maintenance
- −$2,522
- − Management
- −$2,522
- − Depreciation
- −$5,815
- Taxable income
- $5,469
- Est. tax owed @ 24.0%
- −$1,313
- After-tax cash flow
- $7,014/yr
For passive investors: Depreciation is non-cash, so a rental often shows a tax loss while cash-flowing — sheltering income. Rental losses are passive: they offset passive income freely, and up to $25,000/yr can offset ordinary (W-2) income if you actively participate and your MAGI is under $100k (phasing out to $0 by $150k); unused losses carry forward. On sale, claimed depreciation is recaptured at up to 25%, and gains may owe capital-gains tax (a 1031 exchange can defer both). Figures are a year-1 estimate at your 24.0% rate — not tax advice; consult a CPA.
Condition & rehab AI · 4 photos
This 3/2 brick and aluminum duplex requires significant repairs and maintenance to improve its condition and value.
Repairs flagged
- Major roof — Significant wear and tear
- Major exterior siding — Peeling paint and siding damage
- Major flooring — Worn and damaged
- Major interior walls — Painted walls show significant wear
- Major windows — Visible damage and potential leaks
- Major HVAC/mechanicals — No visible signs of recent maintenance
Value-add opportunities
- Both Paint exterior — Enhances curb appeal and value
- Both Replace flooring — Improves living space and value
- Both Repair windows — Enhances energy efficiency and value
- Both Service HVAC — Improves comfort and value
Renovation cost estimate screening
| Repair item | Severity | Est. cost |
|---|---|---|
| roof · Significant wear and tear | Major | $15,000–50,000 |
| exterior siding · Peeling paint and siding damage | Major | $15,000–50,000 |
| flooring · Worn and damaged | Major | $15,000–50,000 |
| interior walls · Painted walls show significant wear | Major | $15,000–50,000 |
| windows · Visible damage and potential leaks | Major | $15,000–50,000 |
| HVAC/mechanicals · No visible signs of recent maintenance | Major | $15,000–50,000 |
| Total estimated repair cost · 6 items | $90,000–300,000 |
Value-add ROI direction
- Both Paint exterior — Enhances curb appeal and value ↑
- Both Replace flooring — Improves living space and value ↑
- Both Repair windows — Enhances energy efficiency and value ↑
- Both Service HVAC — Improves comfort and value ↑
ⓘ Cost ranges are severity-bucket heuristics (US national rule-of-thumb). Get contractor quotes + a written scope before underwriting a rehab budget.
Schools (NCES district)
- District
- Milwaukee School District
- NCES district ID
- 5509600
- Math proficiency
- 10% ▼ -5.00%
- Reading proficiency
- 18% ▬ 0.00%
- Median HH income
- $36,339
- Composite
- 11.61/100
- National rank
- #9696
- State rank
- #337 of 342 in WI
Livability — Milwaukee
- Score
- 81/100
- State rank
- #55
- US rank
- #1534
Category grades
Schools grade is shown separately in the Schools card above.
Census & demographics
- Census place
- Milwaukee, WI
- County
- Milwaukee County · 926,379 people
- City population
- 573,768
- Metro
- Milwaukee-Waukesha, WI
- Population (ZIP)
- 41,196
- Household income
- $45,642
- Rent vs Own
- Severe rent burden
- 2421.0
Population outlook (Milwaukee County) Hauer SSP2
- Today (2025)
- 995,758 people
- By 2030
- 1,009,124 · +1.3%
- By 2040
- 1,028,128 · +3.3%
- By 2050
- 1,040,066 · +4.4%
- By 2075
- 1,057,849 · +6.2%
- By 2100
- 1,039,774 · +4.4%
Race, ethnicity, and origin ACS 2023
- Neighborhood character
- Predominantly Black (72%)
- Race & ethnicity
- Black 72% Asian 10% White 10% Hispanic / Latino 5% Two or more races 3%
- Common ancestry
- Romanian 1% Lithuanian 1%
- Foreign-born
- 6% · Philippines, Canada
- Languages at home
- 89% English-only · Other Asian/Pacific 7% Spanish 3%
Political lean MEDSL · Milwaukee
- 2024 margin
- Solid D (+38.5) · D 68.3% · R 29.8% · Other 1.8%
- 2008→2024 swing
- +2.7pp toward D · 2008: 35.9pp · 2024: 38.5pp
- All cycles
- 2024: D+38.5 2020: D+39.9 2016: D+37.5 2012: D+34.6 2008: D+35.9
Not yet ingested
- Civics
- —
Market trends
- HPI YoY
- ▼ -76.44%
- Current HPI
- 325.1975
- Rent YoY
- ▲ 5.29%
- Metro
- Milwaukee-Waukesha, WI
- State GDP YoY
- ▲ 2.10%
- F500 in state
- 20
Industry mix (Fortune 500 HQ in WI)
| Industry | F500 HQs | Revenue |
|---|---|---|
| Industrial Machinery | 4 | $23B |
|
||
| Industrial Technology | 2 | $36B |
|
||
| Insurance | 1 | $36B |
|
||
| Professional Services | 1 | $19B |
|
||
| Utilities | 1 | $9B |
|
||
| Consumer Goods | 1 | $3B |
|
||
Price history
-99.5% since first listed4 events — show timeline
- 2026-05-13 Rental Removed $1,099 APPFOLIO
- 2026-04-29 Listed for Rent $1,099 APPFOLIO
- 2026-03-23 Price Changed $199,900 METROMLS
- 2026-02-18 Listed $209,900 METROMLS
Cash-flow waterfall
monthlySold comps — $/sqft
last 12 mo · ≤1 miLoading sold comps…