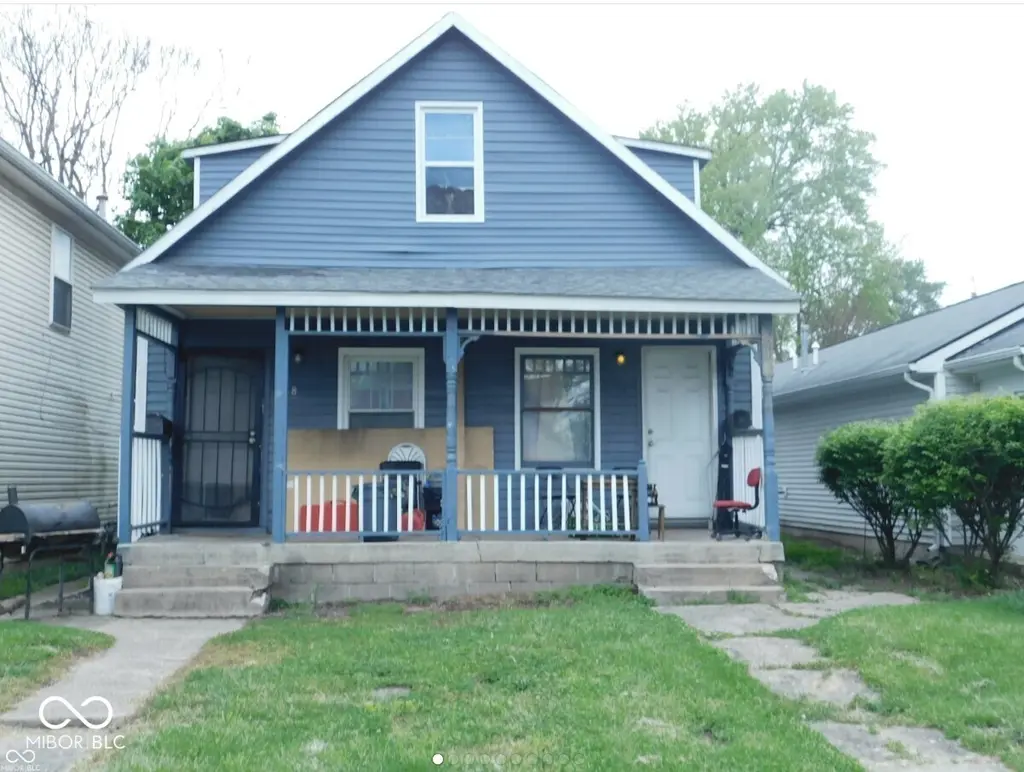
 Duplex
946 W 26th St · Indianapolis city (balance), IN
Flood risk 1/10 · Minimal
- FEMA flood zone
- X (unshaded)
- Chance of flooding over 30 yrs
- 0.0%
- Est. flood insurance / yr
- $507 – $1,088
Fire risk 1/10 · Minimal
- Est. fire insurance / yr
- $717 – $1,331
Heat risk 4/10 · Minor
- Hot days now (above 101°F)
- 7 days/yr
- Hot days in 30 yrs
- 19 days/yr
Wind risk 2/10 · Minimal
- Chance of severe wind over 30 yrs
- 0.0%
Air-quality risk 4/10 · Minor
- Unhealthy air days now
- 5 days/yr
- Unhealthy air days in 30 yrs
- 7 days/yr
Risk factors via First Street. Map © Google.
Why this score? — see what drove the B- grade
The composite is a weighted blend of 9 inputs, each scored 0–100. Each bar is that input's sub-score; the figure is the points it added to the 100-point composite (weight × sub-score).
- Cash flow +30.0/30.0
- 1% rule +10.0/10.0
- DSCR +10.0/10.0
- ARV discount +7.9/15.0
- Rent growth +4.1/5.0
- Livability +2.5/5.0
- Condition / age +2.5/5.0
- Schools +1.4/10.0
- Appreciation +0.0/10.0
$139,900
🖨 Deal sheet (PDF) 📄 Offer letter ✓ Due diligence
Multi-family units
County records classify this as Multi-Family (2-4 Unit). Listing-text estimate: 2 units. confirmed
Listing remarks MLS
Nice duplex two bedrooms each side. One bedroom one bedroom down. Galley kitchen. There are currently tenants in both sides. Tenants are on month-to-month status. Parking behind the property or on the street. Owners made lots of improvements last couple years. Please do not disturb tenants. Showings will only be done after a purchase agreement has been accepted, with the caveat subject to viewing after agreed to on price. Trying disturb tenants as little as possible. Owner will give $10,000 to replace roof and other minor repairs at closing.
Key facts
- 3,750 sq ft lot
- Built 1910
- Listed 45 days
Neighborhood map
What this means for you Summary
Snapshot
- This is a 2 × 2-bed/1.0-bath units multifamily listed at $140k.
Deal economics
- At list price, monthly cash flow is $854 ($10k/yr) — positive. Per door: $427/mo.
- The deal already cash-flows at list — no discount required.
- Meets the 1% rule at list price ($2k rent vs $140k).
- Recommended offer: $136k (3.0% below list) — sets the bar for market timing.
- Cap rate 13.6% vs local median 4.4% in Indianapolis city (balance) — top-decile yield for the area; either an underpriced asset or a hidden risk that comps aren't pricing in. Stress-test before assuming the spread holds.
Location & tenants
- Location reads: area grade B — affects rentability + tenant quality, not the cash-flow math above.
- Indianapolis Public Schools (urban): math 14% / reading 20% proficiency, ranked #286 of 301 in IN (top 95%) — low school quality limits family demand, transient renter base, plan for 1-2y turnover; 77% free/reduced lunch — lower-income household profile, screen leases tightly.
- Zoned schools: Center For Inquiry School 27 (math 25% / reading 29%, grade F, #737 of 994 statewide, top 76%, 525 students, 51% FRL); H L Harshman Middle School (math 3% / reading 16%, grade F, #316 of 330 statewide, top 96%, 549 students, 84% FRL).
- Market conditions: Rents rising fast (+6.4%/yr); 283 active listings in the ZIP; 40 comparable units currently listed for rent nearby; rentals at typical pace (median 26d on market — plan ~3-4 weeks tenant-placement turnaround); 1,906 units permitted in Marion County in 2024 (621 in 5+ unit buildings).
- This rent runs 43% of the median local income ($60k/yr) — at the standard rent-burdened threshold; future hikes will face affordability resistance.
Forward outlook
- Local home prices are declining (-3.0%/yr); year-one equity from $967 of loan paydown is wiped out by about $4k of value loss. Plan a longer hold.
- Marion County population projected at +18% by 2050 — long-run rental-demand tailwind backs the buy-and-hold thesis.
- At projected returns (-3.0% appreciation + 6.4% rent growth), your $39k cash investment doubles in ~5 years — after that, you're playing with house money.
Negotiation context
- It's been on market 45 days — a 3% lower offer ($136k) is reasonable based on typical stale-listing flexibility.
- 7 sale attempts since 24y ago with the ask held roughly flat each time — persistent listings suggest the price (not the market) is what's stuck; bring a comps-based counter.
- Current owner paid $16k; list at $140k implies a 748% gain — meaningful room to come down on a strong offer.
Risks & watch-outs
- Watch-outs: built in 1910 — expect roof / HVAC / electrical / plumbing capex.
Questions for the listing agent
- It's been on market 45 days. Have you received any prior offers? Is the seller open to a 3% concession, seller financing, or rate buy-down credit?
- Can we see the unit-by-unit rent roll, current vacancy, and any below-market leases? What's the average tenancy length?
- What capital expenditures (roof, boiler, parking lot, exteriors) have been made in the last 5 years, and what's planned in the next 2?
- Built in 1910 — when were the roof, HVAC, electrical panel, plumbing, and water heater last replaced?
- Is there a deadline driving the sale (1031 exchange, divorce, estate, relocation)? That informs how much negotiation room exists.
- What's the average days-on-market for RENTAL listings here right now (not sales)? A rising rental-DOM trend means longer vacancies and softer asking-rent achievability than the comps imply.
- What's the recent tenant-quality profile in this submarket — average credit score on applications, eviction rate, late-payment / NSF rate, and stable-employment percentage? A property-management company in the area should have these aggregated.
- How much new apartment / multifamily construction is in the pipeline within 1–3 miles? Heavy new supply (>2% of stock underway) typically softens rents 12–24 months out; light construction supports rent growth.
Investment metrics
- 1% rule
- 1.55% ✓
- Cap rate
- 13.62%
- Cash-on-cash
- 26.15%
- DSCR
- 2.16
- GRM
- 5.4
CMA / ARV
- ARV (median comp)
- $141,063
- List price
- $139,900
- Delta
- -0.82%
- Verdict
- FAIR
- Comps
- 17 within 1.0 mi
Show comp detail 4 sales within ~0.75 mi
| Address | Dist | Beds/Ba | Sqft | Sold | Price | $/sf | Match |
|---|---|---|---|---|---|---|---|
| 906 Burdsal Pkwy | 0.20mi | 2/2.0 (-1) | 936 (+3%) | 2mo | $96,000 | $103 | 71 |
| 733 W 25th St | 0.30mi | 2/2.0 (-1) | 983 (+8%) | 10mo | $109,000 | $111 | 52 |
| 1263 W 32nd St | 0.75mi | 2/1.0 (-1) | 832 (-9%) | 8mo | $140,000 | $168 | 27 |
| 1244-1246 W 30th St | 0.58mi | 2/2.0 (-1) | 1,024 (+12%) | 15mo | $137,500 | $134 | 27 |
Match score weights: distance 35% · size 25% · config 20% · recency 20%. Top-matched comps best support the ARV.
Projected returns pro-forma
-3.0% appreciation · 6.43% rent growth · sell at horizon
- IRR
- 23.5%
- Equity multiple
- 2.01×
- Total profit
- $39,422
- Equity at exit
- $20,860
- IRR
- 33.4%
- Equity multiple
- 4.53×
- Total profit
- $138,328
- Equity at exit
- $12,096
Cash invested: $39,172 (down + closing). Projections, not guarantees.
Landlord ↔ Tenant lean methodology
- Overall (STATE)
- 90 Strongly Landlord-Friendly
- State Indiana
- 90 Strongly Landlord-Friendly · R+11
- County
- — inherits STATE
- City
- — inherits STATE
ZIP-level market 46208
- Rents YoY
- 6.4%
- Active inventory
- 283
- Price-to-rent
- 10.7×
Monthly cashflow live
- Estimated rent
- $2,170 medium interval (Pro) →
- Mortgage (P&I)
- −$734
- Tax from tax record
- −$69 /mo · $823/yr
- Insurance
- −$58
- HOA
- −$0
- Vacancy / Maint / Mgmt
- −$456
- Net cashflow
- $854
Break-even live
Sensitivity live
| Price | -10% $933 | -5% $893 | +0% $854 | +5% $814 | +10% $775 |
|---|---|---|---|---|---|
| Rent | -10% $682 | -5% $768 | +0% $854 | +5% $939 | +10% $1,025 |
| Rate | -1.0pp $924 | -0.5pp $889 | base $854 | +0.5pp $818 | +1.0pp $781 |
2-unit breakdown (identical units grouped — click to expand)
| Units | Beds | Baths | Est. rent |
|---|---|---|---|
| 2× units | 2 | 1 | $2,170 |
| #1 | 2 | 1 | $1,085 |
| #2 | 2 | 1 | $1,085 |
| Total (2 units) | $2,170 | ||
UW: 25.0% down · 7.5% · 30yr · 1.5% tax · 5.0% vac · 8.0% maint · 8.0% mgmt
Financing live
Cash to close
- Down payment
- $34,975
- Closing costs
- $4,197
- Reserves months
- —
- Total cash needed
- —
Loan-product check · same deal, 3 products live
Conventional
25% down · 7.5% · 30yr
- Down + closing
- —
- Monthly P&I
- —
- Monthly cashflow
- —
- DSCR
- —
- Eligible?
- —
Personal DTI + credit; lowest rate.
DSCR
20% down · 8.5% · 30yr
- Down + closing
- —
- Monthly P&I
- —
- Monthly cashflow
- —
- DSCR
- —
- Eligible?
- —
No personal income docs; deal must DSCR.
Hard money
10% down · 12.0% · 12mo
- Down + closing
- —
- Monthly P&I
- —
- Monthly cashflow
- —
- DSCR
- —
- Eligible?
- —
Short-term bridge; refi at stabilization.
Rent comps 40 comps
| Address | Beds | Baths | Sqft | Rent | $/sqft | DOM | Units | Dist |
|---|---|---|---|---|---|---|---|---|
| 970 Edgemont Ave Indianapolis, IN | 2.0 | 1.0 | 740 | $845 | $1.14 | 6d | 1 | 0.14mi |
| 970 Edgemont Ave Indianapolis, IN | 2.0 | 1.0 | 740 | $845 | $1.14 | 0d | 1 | 0.14mi |
| 906 Burdsal Pkwy Indianapolis, IN | 2.0 | 1.0 | 936 | $1,295 | $1.38 | 25d | 1 | 0.21mi |
| 908 Burdsal Pkwy Marion, IN | 2.0 | 1.0 | 936 | $1,300 | $1.39 | 25d | 1 | 0.21mi |
| 1244 Edgemont Ave Indianapolis, IN | 2.0 | 1.0 | 1092 | $1,275 | $1.17 | 45d | 1 | 0.42mi |
| 1227 W 29th St Indianapolis, IN | 3.0 | 1.5 | 1056 | $1,250 | $1.18 | 25d | 1 | 0.45mi |
| 1319 W 27th St Indianapolis, IN | 2.0 | 1.0 | 651 | $900 | $1.38 | 14d | 1 | 0.48mi |
| 516 W 28th St Indianapolis, IN | 2.0 | 1.0 | 1005 | $1,100 | $1.09 | 25d | 1 | 0.48mi |
| 538 W 29th St Unit B Indianapolis, IN | 3.0 | 1.0 | 1031 | $1,349 | $1.31 | 0d | 1 | 0.51mi |
| 524 W 23rd St Unit 2 Indianapolis, IN | 2.0 | 1.0 | 669 | $949 | $1.42 | 0d | 1 | 0.53mi |
| 524 W 23rd St Indianapolis, IN | 2.0 | 1.0 | 664 | $949 | $1.43 | 45d | 1 | 0.53mi |
| 2235 Doctor Martin Luther King Junior St Indianapolis, IN | 3.0 | 1.5 | 948 | $1,700 | $1.79 | 45d | 1 | 0.57mi |
| 3017 Ethel Ave Indianapolis, IN | 3.0 | 1.5 | 1079 | $1,400 | $1.30 | 25d | 1 | 0.64mi |
| 926 W 32nd St Indianapolis, IN | 3.0 | 2.0 | 1050 | $1,295 | $1.23 | 9d | 1 | 0.64mi |
| 1367 W Pruitt St Indianapolis, IN | 3.0 | 1.0 | 1088 | $1,450 | $1.33 | 45d | 1 | 0.65mi |
| 2248 N Harding St Indianapolis, IN | 2.0 | 1.0 | 1100 | $899 | $0.82 | 25d | 1 | 0.67mi |
| 1457 W 29th St Indianapolis, IN | 2.0 | 1.0 | 686 | $995 | $1.45 | 22d | 1 | 0.71mi |
| 1519 W 28th St Indianapolis, IN | 2.0 | 1.0 | 816 | $895 | $1.10 | 45d | 1 | 0.72mi |
| 1415 W Pruitt St Indianapolis, IN | 3.0 | 1.0 | 1001 | $1,249 | $1.25 | 25d | 1 | 0.72mi |
| 1261 W 32nd St Indianapolis, IN | 2.0 | 1.0 | 832 | $975 | $1.17 | 45d | 1 | 0.74mi |
| 2808 N Capitol Ave Indianapolis, IN | 2.0 | 1.0 | 900 | $975 | $1.08 | 25d | 1 | 0.84mi |
| 1039 W 36th St Indianapolis, IN | 2.0 | 1.0 | 864 | $995 | $1.15 | 45d | 1 | 0.92mi |
| 1470 W 32nd St Indianapolis, IN | 2.0 | 1.0 | 700 | $1,000 | $1.43 | 45d | 1 | 0.92mi |
| 1228 W 18th St Indianapolis, IN | 2.0 | 1.0 | 1050 | $1,200 | $1.14 | 45d | 1 | 0.95mi |
| 3440 N Harding St Indianapolis, IN | 2.0 | 1.0 | 754 | $1,325 | $1.76 | 45d | 1 | 0.98mi |
| 3440 N Harding St Indianapolis, IN | 2.0 | 1.0 | 754 | $1,275 | $1.69 | 21d | 1 | 0.98mi |
| 55 W Fall Creek Parkway South Dr Unit C Indianapolis, IN | 2.0 | 1.0 | 1000 | $1,035 | $1.03 | 45d | 1 | 0.99mi |
| 2625 N Meridian St Indianapolis, IN | 1.0–2.0 | 1.0–2.0 | 850 | $2,150 | $2.53 | 9d | 8 | 1.14mi |
| 2131 N Meridian St Indianapolis, IN | 2.0 | 1.0 | 994 | $1,455 | $1.46 | 45d | 1 | 1.19mi |
| 1441 W Lynn Dr Indianapolis, IN | 3.0 | 2.0 | 967 | $1,550 | $1.60 | 45d | 1 | 1.23mi |
| 3413 N Capitol Ave Indianapolis, IN | 3.0 | 1.0 | 588 | $1,299 | $2.21 | 25d | 1 | 1.26mi |
| 1410 Breedlove Ln Indianapolis, IN | 2.0 | 1.0–2.0 | 947 | $2,557 | $2.70 | 0d | 61 | 1.30mi |
| 3469 Graceland Ave Indianapolis, IN | 2.0 | 1.0 | 1000 | $1,200 | $1.20 | 45d | 1 | 1.30mi |
| 1510 Stadium Way Unit Stadium Flats-2203 Indianapolis, IN | 2.0 | 1.0 | 770 | $1,462 | $1.90 | 0d | 1 | 1.32mi |
| 1201 Indiana Ave Indianapolis, IN | 1.0–3.0 | 1.0–3.5 | 967 | $2,404 | $2.49 | 0d | 34 | 1.32mi |
| 1401 Doctor Martin Luther King Junior St Indianapolis, IN | 1.0–2.0 | 1.0 | 982 | $1,875 | $1.91 | 15d | 1 | 1.33mi |
| 3310 N Meridian St Indianapolis, IN | 1.0–2.0 | 1.0 | 750 | $1,150 | $1.53 | 45d | 3 | 1.33mi |
| 75 W 18th St Indianapolis, IN | 1.0–2.0 | 1.0–2.0 | 845 | $2,395 | $2.83 | 18d | 8 | 1.35mi |
| 2205 N Delaware St Indianapolis, IN | 2.0 | 1.0–2.0 | 946 | $1,950 | $2.06 | 12d | 5 | 1.35mi |
| 2060 N Delaware St #3 Indianapolis, IN | 2.0 | 1.0 | 750 | $929 | $1.24 | 0d | 1 | 1.35mi |
Listing history 24 events
-
2026-06-21days on market $139,900 Active 45 DOM
-
2026-06-18days on market $139,900 Active 42 DOM
-
2026-06-17days on market $139,900 Active 41 DOM
-
2026-06-16days on market $139,900 Active 40 DOM
-
2026-06-15days on market $139,900 Active 39 DOM
-
2026-06-13days on market $139,900 Active 37 DOM
-
2026-06-13days on market $139,900 Active 36 DOM
-
2026-06-09days on market $139,900 Active 33 DOM
-
2026-06-08days on market $139,900 Active 32 DOM
-
2026-06-07statusdays on market $139,900 Active 31 DOM
-
2026-05-12status Pending 547-char remark
Show marketing remark (547 chars)
Nice duplex two bedrooms each side. One bedroom one bedroom down. Galley kitchen. There are currently tenants in both sides. Tenants are on month-to-month status. Parking behind the property or on the street. Owners made lots of improvements last couple years. Please do not disturb tenants. Showings will only be done after a purchase agreement has been accepted, with the caveat subject to viewing after agreed to on price. Trying disturb tenants as little as possible. Owner will give $10,000 to replace roof and other minor repairs at closing.
-
2026-04-20status Active 547-char remark
Show marketing remark (547 chars)
Nice duplex two bedrooms each side. One bedroom one bedroom down. Galley kitchen. There are currently tenants in both sides. Tenants are on month-to-month status. Parking behind the property or on the street. Owners made lots of improvements last couple years. Please do not disturb tenants. Showings will only be done after a purchase agreement has been accepted, with the caveat subject to viewing after agreed to on price. Trying disturb tenants as little as possible. Owner will give $10,000 to replace roof and other minor repairs at closing.
-
2026-03-03status Pending 547-char remark
Show marketing remark (547 chars)
Nice duplex two bedrooms each side. One bedroom one bedroom down. Galley kitchen. There are currently tenants in both sides. Tenants are on month-to-month status. Parking behind the property or on the street. Owners made lots of improvements last couple years. Please do not disturb tenants. Showings will only be done after a purchase agreement has been accepted, with the caveat subject to viewing after agreed to on price. Trying disturb tenants as little as possible. Owner will give $10,000 to replace roof and other minor repairs at closing.
-
2026-02-25$139,900 Active 547-char remark
Show marketing remark (547 chars)
Nice duplex two bedrooms each side. One bedroom one bedroom down. Galley kitchen. There are currently tenants in both sides. Tenants are on month-to-month status. Parking behind the property or on the street. Owners made lots of improvements last couple years. Please do not disturb tenants. Showings will only be done after a purchase agreement has been accepted, with the caveat subject to viewing after agreed to on price. Trying disturb tenants as little as possible. Owner will give $10,000 to replace roof and other minor repairs at closing.
-
2025-04-03historical
-
2025-03-31status Active
-
2024-12-05status Active
-
2024-10-01status Pending
-
2024-08-12price $119,000
-
2024-08-06status Active
-
2024-07-10status Pending
-
2024-07-02$129,900 Active
-
2002-09-23soldstatus $16,500
-
2002-07-09$18,000
ⓘ Source: listings_history table (triggers on properties + properties_extension) + one-shot
backfill from property_details.listing_events for pre-trigger history.
Tax reassessment forecast IN · Partial reset (capped growth)
- Current annual tax
- $823 · $69/mo
- Projected year-2 tax
- $1,006 · $84/mo
- Expected delta
- +$183/yr (+$15/mo · 22.3%)
ⓘ Screening estimate from a state-policy table — verify with the county assessor before closing.
Climate risk First Street
- Flood 1/10 Low FEMA zone X (unshaded) · 0% chance over 30 yrs
- Wildfire 1/10 Low
- Heat 4/10 Moderate 7 d/yr ≥101°F today · 19 d/yr by 30 yrs out
- Wind 2/10 Low 0% chance of damaging wind over 30 yrs
- Air quality 4/10 Moderate 5 unhealthy d/yr today · 7 by 30 yrs out
Nearby sold comps map
Loading sold comps map…
Walkable amenities ~0.75 mi
Loading nearby amenities…
Taxation est. · year 1
- Rental income
- $26,040
- − Mortgage interest
- −$7,837
- − Property taxes
- −$823
- − Insurance
- −$700
- − Repairs & maintenance
- −$2,083
- − Management
- −$2,083
- − Depreciation
- −$4,070
- Taxable income
- $8,445
- Est. tax owed @ 24.0%
- −$2,027
- After-tax cash flow
- $8,219/yr
For passive investors: Depreciation is non-cash, so a rental often shows a tax loss while cash-flowing — sheltering income. Rental losses are passive: they offset passive income freely, and up to $25,000/yr can offset ordinary (W-2) income if you actively participate and your MAGI is under $100k (phasing out to $0 by $150k); unused losses carry forward. On sale, claimed depreciation is recaptured at up to 25%, and gains may owe capital-gains tax (a 1031 exchange can defer both). Figures are a year-1 estimate at your 24.0% rate — not tax advice; consult a CPA.
Schools (NCES district)
- District
- Indianapolis Public Schools
- NCES district ID
- 1804770
- Math proficiency
- 14% ▼ -7.00%
- Reading proficiency
- 20% ▼ -3.00%
- Median HH income
- $32,034
- Composite
- 13.69/100
- National rank
- #9499
- State rank
- #286 of 301 in IN
Livability — Indianapolis city (balance)
No livability data for this city. (Only ~50 U.S. cities are tracked.)
Census & demographics
- Census place
- Indianapolis city (balance), IN
- County
- Marion County · 998,460 people
- City population
- 881,119
- Metro
- Indianapolis-Carmel-Anderson, IN
- Population (ZIP)
- 22,379
- Household income
- $60,062
- Rent vs Own
- Severe rent burden
- 978.0
Population outlook (Marion County) Hauer SSP2
- Today (2025)
- 1,025,572 people
- By 2030
- 1,065,727 · +3.9%
- By 2040
- 1,141,577 · +11.3%
- By 2050
- 1,208,920 · +17.9%
- By 2075
- 1,367,288 · +33.3%
- By 2100
- 1,438,201 · +40.2%
Race, ethnicity, and origin ACS 2023
- Neighborhood character
- Diverse neighborhood (Simpson 0.62)
- Race & ethnicity
- White 46% Black 40% Hispanic / Latino 8% Two or more races 6% Asian 2%
- Hispanic origin (detail)
- Mexican 4%
- Common ancestry
- Romanian 2% Slovak 2% Italian 1%
- Foreign-born
- 4% · Canada
- Languages at home
- 93% English-only · Spanish 5% French/Haitian/Cajun 1% Other Indo-European 1%
Political lean MEDSL · Marion
- 2024 margin
- Strong D (+27.7) · D 63.0% · R 35.3% · Other 1.7%
- 2008→2024 swing
- -0.7pp no change · 2008: 28.4pp · 2024: 27.7pp
- All cycles
- 2024: D+27.7 2020: D+29.1 2016: D+22.8 2012: D+22.2 2008: D+28.4
Not yet ingested
- Civics
- —
Market trends
- HPI YoY
- ▼ -324.63%
- Current HPI
- 319.7725
- Rent YoY
- ▲ 6.43%
- Metro
- Indianapolis-Carmel-Anderson, IN
- State GDP YoY
- ▲ 2.90%
- F500 in state
- 18
Industry mix (Fortune 500 HQ in IN)
| Industry | F500 HQs | Revenue |
|---|---|---|
| Industrial Machinery | 2 | $37B |
|
||
| Healthcare | 1 | $177B |
|
||
| Pharmaceuticals | 1 | $45B |
|
||
| Metals / Steel | 1 | $18B |
|
||
| Agriculture | 1 | $17B |
|
||
| Packaging | 1 | $12B |
|
||
Price history
+677.2% since first listed14 events — show timeline
- 2026-05-12 Pending — MIBOR as Distributed by MLS Grid
- 2026-04-20 Relisted — MIBOR as Distributed by MLS Grid
- 2026-03-03 Pending — MIBOR as Distributed by MLS Grid
- 2026-02-25 Listed $139,900 MIBOR as Distributed by MLS Grid
- 2025-04-03 Listing Removed — MIBOR as Distributed by MLS Grid
- 2025-03-31 Relisted — MIBOR as Distributed by MLS Grid
- 2024-12-05 Relisted — MIBOR as Distributed by MLS Grid
- 2024-10-01 Pending — MIBOR as Distributed by MLS Grid
- 2024-08-12 Price Changed $119,000 MIBOR as Distributed by MLS Grid
- 2024-08-06 Relisted — MIBOR as Distributed by MLS Grid
- 2024-07-10 Pending — MIBOR as Distributed by MLS Grid
- 2024-07-02 Listed $129,900 MIBOR as Distributed by MLS Grid
- 2002-09-23 Sold (MLS) $16,500 MIBOR as Distributed by MLS Grid
- 2002-07-09 Listed $18,000 MIBOR as Distributed by MLS Grid
Property tax history
+1.6%/yrLatest (2025): $823 · -0.5% YoY. Source: county tax records.
Cash-flow waterfall
monthlySold comps — $/sqft
last 12 mo · ≤1 miLoading sold comps…