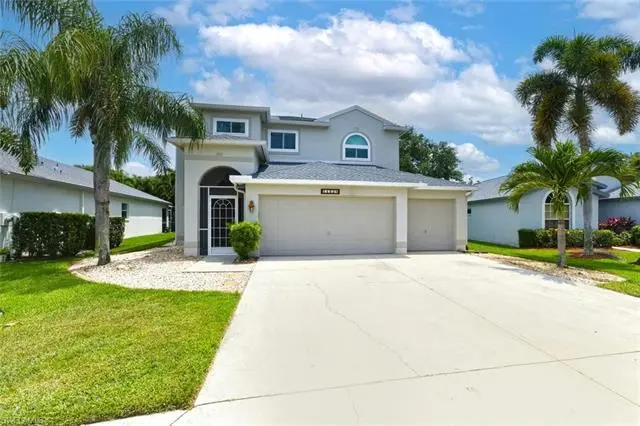
11528 Woodmount Ln · Estero, FL
Flood risk 1/10 · Minimal
- FEMA flood zone
- X (unshaded)
- Chance of flooding over 30 yrs
- 0.0%
- Est. flood insurance / yr
- $507 – $1,088
Fire risk 7/10 · Major
- Est. fire insurance / yr
- $947 – $1,759
Heat risk 10/10 · Severe
- Hot days now (above 107°F)
- 7 days/yr
- Hot days in 30 yrs
- 32 days/yr
Wind risk 10/10 · Severe
- Chance of severe wind over 30 yrs
- 99.0%
Air-quality risk 3/10 · Minor
- Unhealthy air days now
- 2 days/yr
- Unhealthy air days in 30 yrs
- 2 days/yr
Risk factors via First Street. Map © Google.
Why this score? — see what drove the D+ grade
The composite is a weighted blend of 9 inputs, each scored 0–100. Each bar is that input's sub-score; the figure is the points it added to the 100-point composite (weight × sub-score).
- Cash flow +20.7/30.0
- DSCR +6.6/10.0
- 1% rule +5.1/10.0
- Schools +4.1/10.0
- Livability +4.0/5.0
- Condition / age +2.5/5.0
- Rent growth +2.1/5.0
- ARV discount +1.2/15.0
- Appreciation +0.0/10.0
$608,000
🖨 Deal sheet (PDF) 📄 Offer letter ✓ Due diligence
Listing remarks
Beautifully maintained 4-bedroom, 2.5-bath pool home with a 3-car garage located in the desirable Golf Course community of Stoneybrook. This spacious home features brand-new kitchen, hurricane impact windows throughout, a new roof (2024), and a new AC system (2025). Flooring includes tile, laminate, and wood throughout the home. The thoughtfully designed floor plan offers comfortable living and entertaining spaces, while the kitchen includes a reverse osmosis system for added convenience. Residents enjoy resort-style amenities including basketball courts, bocce courts, community pool and spa, exercise room, fishing pier, pickleball, tennis courts, volleyball, and much more. An exceptional o
Key facts
- 7,819 sq ft lot
- 3 garage spots
- Pool
Property features AI
Finance
- Other: Property located in the Stoneybrook development (gated, golf course community); Zoning: RPD; Lot is regular and deeded; Irrigation using reclaimed water; Lot dimensions reported by Property Appraiser Office
- HOA & community: Mandatory HOA; Quarterly master HOA fee; Master HOA fee listed (quarterly): $706; Total annual recurring HOA fees: $2,824; Total one-time fees: $2,322; Professional management; HOA maintenance covers cable, internet/Wi-Fi, legal/accounting, and recreation facilities; Community amenities include clubhouse, community pool and spa, exercise room, tennis, pickleball, bocce, basketball, volleyball, golf course, fishing pier, library, bike/jog path, playground, sidewalks and streetlights
Exterior
- Parking: Attached 3-car garage; Driveway (paved) with space for 2+ vehicles
- Security: Gated community with guard at gate and patrolled security
- Utilities: Central water with partial reverse osmosis; Central sewer; Cable available
- Home design: Single family residential; 2-story home; Rear exposure facing south; Stucco exterior
- Construction: Concrete block construction; Shingle roof; Built in 2001
- Exterior features: Sprinkler system (automatic); Screened, below-ground concrete private pool with equipment staying; Impact resistant windows; Gated community with guard at gate and security patrol
Interior
- Kitchen: Dishwasher; Range; Microwave; Refrigerator/ice maker; Disposal; Pantry
- Bedrooms: 4 bedrooms; Master bedroom located upstairs
- Flooring: Tile; Vinyl; Wood
- Bathrooms: 2 full bathrooms; 1 half bathroom; Master bath with dual sinks and separate tub and shower
- Heating & cooling: Central electric heat; Central electric cooling; Ceiling fans
- Interior features: Cable prewire and high-speed internet available; Pantry; Smoke detectors; Walk-in closet; Window coverings; Breakfast bar, formal dining and dining in living area; Family room; Screened lanai/porch; Unfurnished; 2-story floor plan
- Laundry & utility: Washer and dryer; Laundry in residence; Auto garage door
Neighborhood map
What this means for you Summary
Snapshot
- This is a 4-bed/3.0-bath single-family listed at $608k.
Deal economics
- At list price, monthly cash flow is $827 ($10k/yr) — positive.
- The deal already cash-flows at list — no discount required.
- Meets the 1% rule at list price ($6k rent vs $608k).
- Recommended offer: $590k (3.0% below list) — sets the bar for market timing.
- Cap rate 7.9% vs local median 3.4% in Estero — top-decile yield for the area; either an underpriced asset or a hidden risk that comps aren't pricing in. Stress-test before assuming the spread holds.
Location & tenants
- Location reads 79/100 on livability (#149 in FL, #2,242 nationally) — a middle-class / working-renter tenant base. Strengths: crime A+, employment A+, housing A+; Watch: amenities F, commute F, cost of living D-.
- Lee (suburban): math 47% / reading 50% proficiency, ranked #42 of 73 in FL (top 58%) — families likely to look elsewhere, expect single-tenant / working-renter base with shorter leases.
- Market conditions: Rents soft (-1.4%/yr); 668 active listings in the ZIP; 10 comparable units currently listed for rent nearby; rentals at typical pace (median 24d on market — plan ~3-4 weeks tenant-placement turnaround); solid renter incomes; 15,411 units permitted in Lee County in 2024 (4,686 in 5+ unit buildings).
- At $6,143/mo this rent would consume 72% of the median local household income ($103k/yr) (locally 606% of renters already pay >50% of income on rent) — very limited rent-growth headroom before tenants either downsize or default.
Forward outlook
- Local home prices are declining (-3.0%/yr); year-one equity from $4k of loan paydown is wiped out by about $18k of value loss. Plan a longer hold.
- Lee County population projected at +44% by 2050 — long-run rental-demand tailwind backs the buy-and-hold thesis.
Negotiation context
- It's been on market 36 days — a 3% lower offer ($590k) is reasonable based on typical stale-listing flexibility.
- 2 sale attempts with the ask held roughly flat each time — persistent listings suggest the price (not the market) is what's stuck; bring a comps-based counter.
Risks & watch-outs
- Climate carrying-cost: severe wind risk, 99% chance of damaging wind over 30y; major wildfire risk; extreme-heat days projected 7→32/yr by 2055 (HVAC capex compounding) — expect insurance premiums to compound above CPI over the hold.
Questions for the listing agent
- It's been on market 36 days. Have you received any prior offers? Is the seller open to a 3% concession, seller financing, or rate buy-down credit?
- What does the HOA fee cover, when was the last increase, and are there any pending special assessments or reserve-fund shortfalls?
- Is there a deadline driving the sale (1031 exchange, divorce, estate, relocation)? That informs how much negotiation room exists.
- Schools are A-rated — typically a magnet for longer-tenancy family renters. What's the average tenant stay here, and is there a school-zone premium baked into asking?
- The area grade is low — what's the realistic commute time and amenity access for the typical tenant pool here? Any planned neighborhood developments (good or bad) we should know about?
- What's the average days-on-market for RENTAL listings here right now (not sales)? A rising rental-DOM trend means longer vacancies and softer asking-rent achievability than the comps imply.
- What's the recent tenant-quality profile in this submarket — average credit score on applications, eviction rate, late-payment / NSF rate, and stable-employment percentage? A property-management company in the area should have these aggregated.
- How much new for-sale + rental construction is in the pipeline within 1–3 miles? Heavy new supply typically softens prices + rents 12–24 months out; constrained supply supports both.
Investment metrics
- 1% rule
- 1.01% ✓
- Cap rate
- 7.92%
- Cash-on-cash
- 5.83%
- DSCR
- 1.26
- GRM
- 8.2
CMA / ARV
- ARV (on-the-fly)
- $533,010
- Comps found
- 2
Show comp detail 2 sales within ~0.75 mi
| Address | Dist | Beds/Ba | Sqft | Sold | Price | $/sf | Match |
|---|---|---|---|---|---|---|---|
| 11451 Pembrook Run | 0.38mi | 4/3.0 | 2,528 (+3%) | 1mo | $550,000 | $218 | 76 |
| 21661 Windham Run | 0.36mi | 5/3.0 (+1) | 2,704 (+11%) | 23mo | $570,000 | $211 | 41 |
Match score weights: distance 35% · size 25% · config 20% · recency 20%. Top-matched comps best support the ARV.
Projected returns pro-forma
-3.0% appreciation · 0.0% rent growth · sell at horizon
- IRR
- -10.6%
- Equity multiple
- 0.62×
- Total profit
- $-63,885
- Equity at exit
- $90,655
- IRR
- -6.0%
- Equity multiple
- 0.66×
- Total profit
- $-57,462
- Equity at exit
- $52,569
Cash invested: $170,240 (down + closing). Projections, not guarantees.
Landlord ↔ Tenant lean methodology
- Overall (STATE)
- 87 Strongly Landlord-Friendly
- State Florida
- 87 Strongly Landlord-Friendly · R+3
- County
- — inherits STATE
- City
- — inherits STATE
ZIP-level market 33928
- Rents YoY
- -1.4%
- Active inventory
- 668
- Price-to-rent
- 8.2×
Monthly cashflow live
- Estimated rent
- $6,143 high interval (Pro) →
- Mortgage (P&I)
- −$3,188
- Tax from tax record
- −$349 /mo · $4,193/yr
- Insurance
- −$253
- HOA
- −$235
- Vacancy / Maint / Mgmt
- −$1,290
- Net cashflow
- $827
Break-even live
Sensitivity live
| Price | -10% $1,171 | -5% $999 | +0% $827 | +5% $655 | +10% $483 |
|---|---|---|---|---|---|
| Rent | -10% $341 | -5% $584 | +0% $827 | +5% $1,069 | +10% $1,312 |
| Rate | -1.0pp $1,133 | -0.5pp $981 | base $827 | +0.5pp $669 | +1.0pp $509 |
UW: 25.0% down · 7.5% · 30yr · 1.5% tax · 5.0% vac · 8.0% maint · 8.0% mgmt
Financing live
Cash to close
- Down payment
- $152,000
- Closing costs
- $18,240
- Reserves months
- —
- Total cash needed
- —
Loan-product check · same deal, 3 products live
Conventional
25% down · 7.5% · 30yr
- Down + closing
- —
- Monthly P&I
- —
- Monthly cashflow
- —
- DSCR
- —
- Eligible?
- —
Personal DTI + credit; lowest rate.
DSCR
20% down · 8.5% · 30yr
- Down + closing
- —
- Monthly P&I
- —
- Monthly cashflow
- —
- DSCR
- —
- Eligible?
- —
No personal income docs; deal must DSCR.
Hard money
10% down · 12.0% · 12mo
- Down + closing
- —
- Monthly P&I
- —
- Monthly cashflow
- —
- DSCR
- —
- Eligible?
- —
Short-term bridge; refi at stabilization.
Rent comps 10 comps
| Address | Beds | Baths | Sqft | Rent | $/sqft | DOM | Units | Dist |
|---|---|---|---|---|---|---|---|---|
| 11533 Woodmount Ln Estero, FL | 5.0 | 3.0 | 2664 | $6,500 | $2.44 | 24d | 1 | 0.03mi |
| 21489 Sheridan Run Estero, FL | 3.0 | 2.0 | 1645 | $10,000 | $6.08 | 24d | 1 | 0.42mi |
| 21565 Windham Run Estero, FL | 3.0 | 2.0 | 1947 | $3,000 | $1.54 | 24d | 1 | 0.51mi |
| 21301 S Branch Blvd Estero, FL | 1.0–3.0 | 1.0–2.0 | 1510 | $4,670 | $3.09 | 2d | 12 | 1.00mi |
| 20271 Calice Ct #2304 Estero, FL | 3.0 | 2.0 | 2009 | $10,500 | $5.23 | 24d | 1 | 1.14mi |
| 20240 Burnside Pl #1603 Estero, FL | 3.0 | 2.5 | 1656 | $5,995 | $3.62 | 24d | 1 | 1.21mi |
| 20187 Buttermere Ct Estero, FL | 3.0 | 3.0 | 2490 | $10,995 | $4.42 | 24d | 1 | 1.35mi |
| 9923 Springlake Cir Estero, FL | 4.0 | 2.5 | 2541 | $3,350 | $1.32 | 24d | 1 | 1.35mi |
| 20150 Seagrove St #2701 Estero, FL | 3.0 | 2.5 | 1856 | $2,895 | $1.56 | 16d | 1 | 1.38mi |
| 10257 South Silver Palm Dr Estero, FL | 5.0 | 3.0 | 2918 | $3,500 | $1.20 | 24d | 1 | 1.38mi |
HOA detail
- Monthly dues
- $235 · $2,820/yr
- Likely covers
- pool
Listing history 17 events
-
2026-06-17days on market $608,000 Active 36 DOM
-
2026-06-16days on market $608,000 Active 35 DOM
-
2026-06-15days on market $608,000 Active 34 DOM
-
2026-06-13days on market $608,000 Active 32 DOM
-
2026-06-10days on market $608,000 Active 29 DOM
-
2026-06-09days on market $608,000 Active 28 DOM
-
2026-06-08days on market $608,000 Active 27 DOM
-
2026-06-07days on market $608,000 Active 26 DOM
-
2026-06-03days on market $608,000 Active 22 DOM
-
2026-06-02days on market $608,000 Active 21 DOM
-
2026-06-01days on market $608,000 Active 20 DOM
-
2026-05-31days on market $608,000 Active 19 DOM
-
2026-05-12$608,000 Active
-
2026-04-11price $599,000
-
2026-03-03price $575,000
-
2026-01-06price $599,900
-
2025-10-31$625,000 Active
ⓘ Source: listings_history table (triggers on properties + properties_extension) + one-shot
backfill from property_details.listing_events for pre-trigger history.
Tax reassessment forecast FL · Resets to sale price
- Current annual tax
- $4,193 · $349/mo
- Projected year-2 tax
- $5,046 · $421/mo
- Expected delta
- +$853/yr (+$71/mo · 20.3%)
ⓘ Screening estimate from a state-policy table — verify with the county assessor before closing.
Climate risk First Street
- Flood 1/10 Low FEMA zone X (unshaded) · 0% chance over 30 yrs
- Wildfire 7/10 Severe
- Heat 10/10 Extreme 7 d/yr ≥107°F today · 32 d/yr by 30 yrs out
- Wind 10/10 Extreme 99% chance of damaging wind over 30 yrs
- Air quality 3/10 Moderate 2 unhealthy d/yr today · 2 by 30 yrs out
Nearby sold comps map
Loading sold comps map…
Walkable amenities ~0.75 mi
Loading nearby amenities…
Taxation est. · year 1
- Rental income
- $73,715
- − Mortgage interest
- −$34,057
- − Property taxes
- −$4,193
- − Insurance
- −$3,040
- − Repairs & maintenance
- −$5,897
- − Management
- −$5,897
- − HOA
- −$2,820
- − Depreciation
- −$17,687
- Taxable income
- $123
- Est. tax owed @ 24.0%
- −$29
- After-tax cash flow
- $9,891/yr
For passive investors: Depreciation is non-cash, so a rental often shows a tax loss while cash-flowing — sheltering income. Rental losses are passive: they offset passive income freely, and up to $25,000/yr can offset ordinary (W-2) income if you actively participate and your MAGI is under $100k (phasing out to $0 by $150k); unused losses carry forward. On sale, claimed depreciation is recaptured at up to 25%, and gains may owe capital-gains tax (a 1031 exchange can defer both). Figures are a year-1 estimate at your 24.0% rate — not tax advice; consult a CPA.
Schools (NCES district)
- District
- Lee
- NCES district ID
- 1201080
- Math proficiency
- 47% ▼ -11.00%
- Reading proficiency
- 50% ▼ -4.00%
- Median HH income
- $49,518
- Composite
- 41.49/100
- National rank
- #3458
- State rank
- #42 of 73 in FL
Livability — Estero
- Score
- 79/100
- State rank
- #149
- US rank
- #2242
Category grades
Schools grade is shown separately in the Schools card above.
Census & demographics
- Census place
- Estero, FL
- County
- Lee County · 788,662 people
- City population
- 31,926
- Metro
- Cape Coral-Fort Myers, FL
- Population (ZIP)
- 31,926
- Household income
- $102,624
- Rent vs Own
- Severe rent burden
- 606.0
Population outlook (Lee County) Hauer SSP2
- Today (2025)
- 871,946 people
- By 2030
- 955,468 · +9.6%
- By 2040
- 1,113,587 · +27.7%
- By 2050
- 1,256,891 · +44.1%
- By 2075
- 1,560,270 · +78.9%
- By 2100
- 1,726,848 · +98.0%
Race, ethnicity, and origin ACS 2023
- Neighborhood character
- Predominantly White (85%)
- Race & ethnicity
- White 85% Hispanic / Latino 8% Two or more races 7% Asian 3% Black 1%
- Hispanic origin (detail)
- Mexican 2% Puerto Rican 2% Cuban 1%
- Common ancestry
- Romanian 5% Lithuanian 3% Slovak 2%
- Foreign-born
- 11% · Canada, China, Jamaica
- Languages at home
- 90% English-only · Spanish 5% Other Indo-European 1% French/Haitian/Cajun 1%
Political lean MEDSL · Lee
- 2024 margin
- Strong R (+28.4) · D 35.5% · R 63.9%
- 2008→2024 swing
- -18.0pp toward R · 2008: -10.4pp · 2024: -28.4pp
- All cycles
- 2024: R+28.4 2020: R+19.2 2016: R+20.4 2012: R+16.6 2008: R+10.4
Not yet ingested
- Civics
- —
Market trends
- HPI YoY
- ▼ -109.49%
- Current HPI
- 197.5913
- Rent YoY
- ▼ -1.42%
- Metro
- Cape Coral-Fort Myers, FL
- State GDP YoY
- ▲ 3.28%
- F500 in state
- 36
Industry mix (Fortune 500 HQ in FL)
| Industry | F500 HQs | Revenue |
|---|---|---|
| Industrial Technology | 2 | $29B |
|
||
| Insurance | 2 | $17B |
|
||
| Retail | 1 | $60B |
|
||
| Technology Distribution | 1 | $58B |
|
||
| Homebuilding | 1 | $35B |
|
||
| Technology Manufacturing | 1 | $35B |
|
||
Price history
-2.7% since first listed5 events — show timeline
- 2026-05-12 Listed $608,000 NAPLESMLS
- 2026-04-11 Price Changed $599,000 BEARMLS
- 2026-03-03 Price Changed $575,000 BEARMLS
- 2026-01-06 Price Changed $599,900 BEARMLS
- 2025-10-31 Listed $625,000 BEARMLS
Property tax history
+1.5%/yrLatest (2025): $4,193 · +2.9% YoY. Source: county tax records.
Cash-flow waterfall
monthlySold comps — $/sqft
last 12 mo · ≤1 miLoading sold comps…